Chapter at a Glance

These days, every organization seems to be either using or aspiring to use dashboards. The term dashboard often has different connotations for different people, but it is almost always used to describe the presentation of various sets of data in a single screen. The most common types of dashboards are:
Strategic Typically used by managers to understand overall performance. For example, a typical strategic dashboard could include charts showing sales versus goals for a specified time period, along with current pipeline and customer service metrics.
Tactical Typically used by employees to highlight current or recent work. For example, a typical tactical dashboard could include a list of current activities due this week presented along with opportunities expected to close this month.
Knowledge is power. Managers and employees alike want the ability to monitor performance at a glance. Microsoft Dynamics CRM provides you with the flexibility to use the built-in dashboards to monitor performance and create additional dashboards to meet your unique business needs.
In this chapter, you will learn how to use the dashboard features of Microsoft Dynamics CRM.
Important
The images used in this book reflect the default form and field names in Microsoft Dynamics CRM. Because the software offers extensive customization capabilities, it’s possible that some of the record types or fields have been relabeled in your Microsoft Dynamics CRM environment. If you cannot find the forms, fields, or security roles referred to in this book, contact your system administrator for assistance.
Important
You must know the location of your Microsoft Dynamics CRM website to work the exercises in this book. Check with your system administrator to verify the web address if you don’t know it.
In Chapter 13, you learned how to view, analyze, and drill down into your application data. You focused on specific areas of the application in each exercise. Dashboards allow you to pull the charts and views available in other parts of the application into a single view. Microsoft Dynamics CRM provides several built-in dashboards that are ready for your organization to use. These are listed in the following table.
Name | Type | Charts Included | Views Included |
|---|---|---|---|
3-Column Multi-Focused Dashboard | Activities By Owner and Priority Service Leaderboard Articles By Status Cases By Origin (Per Day) Cases By Priority (Per Day) | ||
Customer Service Performance Dashboard | 2-Column Regular Dashboard | Service Leaderboard Case Resolution Trend (By Day) Goal Progress (Count) Articles By Status | |
Customer Service Representative Dashboard | 2-Column Regular Dashboard | Case Mix (By Origin) Cases By Priority (Per Day) Case Resolution Trend (By Day) Goal Progress (Count) | My Activities |
2-Column Regular Dashboard | Campaign Type Mix Campaign Budget vs. Actual Costs (By Fiscal) Leads by Source Campaign Revenue Generated by Campaign | My Activities My Campaigns | |
3-Column Focused Dashboard | Sales Pipeline Leads By Source Campaign Cases By Priority (Per Day) | My Activities | |
3-Column Focused Dashboard | Sales Pipeline Percentage Achieved Leads By Source Top Opportunities Top Customers | My Activities | |
3-Column Focused Dashboard | Sales Pipeline Goal Progress (Money) - My Goals Goal Progress (Money) - My Group’s Goals Percentage Achieved Sales Leaderboard Deals Won vs. Deals Lost By Owner |
In this exercise, you will use the built-in dashboard features of Microsoft Dynamics CRM. You will also interact with the dashboard elements.
Note
SET UP Use the Windows Internet Explorer web browser to navigate to your Microsoft Dynamics CRM website before beginning this exercise.
In the Workplace area, click Dashboards.
The dashboard view appears.
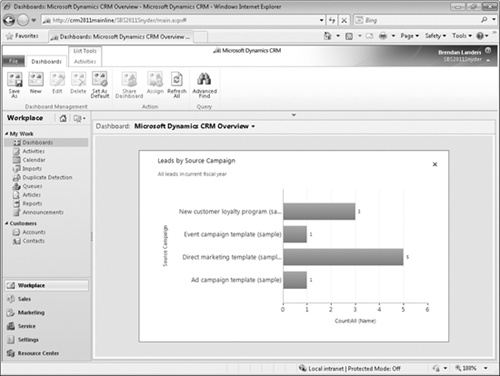
In the view selector, select Microsoft Dynamics CRM Overview.
The screen changes to show the dashboard elements as described in the table shown earlier in this section.
In the Sales Pipeline chart, click one of the sections of the funnel.
 In the Select
Field box on the shortcut menu, select Probability, and then click the arrow to
submit the field.
In the Select
Field box on the shortcut menu, select Probability, and then click the arrow to
submit the field.The drilldown data appears in a bar chart format.
Drill into one of the chart bars by clicking it. Choose Est. Close Date in the Select Field box, and then click the arrow to submit.
 In the lower-left corner of the chart,
click the Back button.
In the lower-left corner of the chart,
click the Back button.You are returned to the previous view.
In the lower-left corner of the chart, click the Home button.
You return to the original Sales Pipeline chart.
 On the Leads by
Source Campaign chart, click the Enlarge button to enlarge the chart. This is useful when
you want to focus on one particular dashboard report.
On the Leads by
Source Campaign chart, click the Enlarge button to enlarge the chart. This is useful when
you want to focus on one particular dashboard report. In the upper-right corner of the Leads by Source Campaign chart, click the
Close button.
In the upper-right corner of the Leads by Source Campaign chart, click the
Close button.You return to the Microsoft Dynamics CRM Overview dashboard.
 In the upper-right corner of the Leads by Source Campaign chart, click the
View Records button.
In the upper-right corner of the Leads by Source Campaign chart, click the
View Records button.A list of the records that are included in the chart is displayed alongside the chart in a new window.


You might find that the seven built-in dashboards satisfy a majority of your needs, but they will probably not provide all the visibility you’d like. With more than 50 charts and hundreds of lists, the possible dashboard combinations seem endless. Microsoft Dynamics CRM allows you to create your own dashboards by using the built-in charts and lists or custom charts and lists that your company creates in the system.
Note
See Also For more information about creating custom charts and lists, see Chapter 13.
Note
See Also Dashboards can contain web resources and iFrames in addition to charts and lists. Web resources and iFrames are beyond the scope of this book, but you can learn more about creating them in Working with Microsoft Dynamics CRM 2011 by Mike Snyder and Jim Steger (Microsoft Press, 2011).
In this exercise, you will create a sample sales representative dashboard in Microsoft Dynamics CRM.
Note
SET UP Use the Internet Explorer web browser to navigate to your Microsoft Dynamics CRM website, if necessary, before beginning this exercise.
In the Workplace area, click Dashboards.
The dashboard view appears.
 On the ribbon, in the Dashboard Management group, click the
New button.
On the ribbon, in the Dashboard Management group, click the
New button.Select the 3-Column Multi-Focused Dashboard, and then click Create.
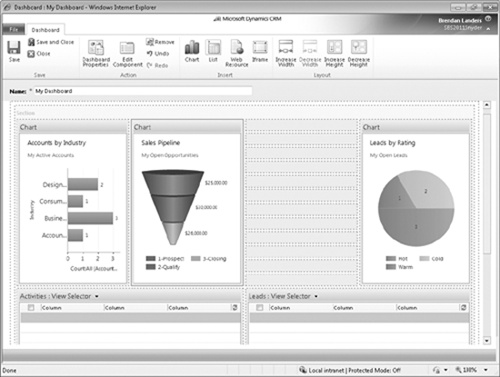
In the Name field, type My Dashboard.
 As you might have noticed, each available
section on the dashboard layout screen contains four buttons. In
the upper-left section, click the Chart button.
As you might have noticed, each available
section on the dashboard layout screen contains four buttons. In
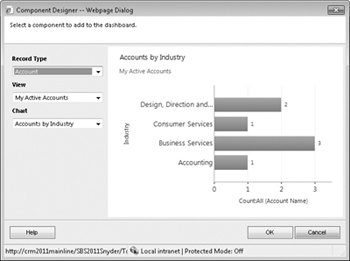
the upper-left section, click the Chart button.In the Record Type field, leave Account selected.
In the View field, leave My Active Accounts selected.
In the Chart field, leave Accounts by Industry selected, and click OK.
This adds the Accounts By Industry chart to the dashboard.
In the upper-middle section of the dashboard, click the Chart button.
In the Component Designer dialog box, in the Record Type list, select Opportunity.
Leave My Open Opportunities selected in the View list, and select Sales Pipeline in the Chart selection box. Click OK.
This adds the Sales Pipeline chart to the dashboard.
In the upper-right section of the dashboard, click the Chart button.
In the Record Type list in the Component Designer dialog box, select Lead.
Leave My Open Leads selected in the View list, select Leads by Rating in the Chart list, and then click OK.
This adds the Leads By Rating chart to the dashboard.
 In the lower-left section of the dashboard,
click the List button.
In the lower-left section of the dashboard,
click the List button.In the Record Type list, select Activities.
In the View list, leave My Activities selected, and click OK.
This adds the My Activities list to the dashboard.
In the lower-right section of the dashboard, click the List button.
In the Record Type list, select Leads.
In the View list, leave My Open Leads selected, and click OK.
This adds the My Open Leads list to the dashboard.
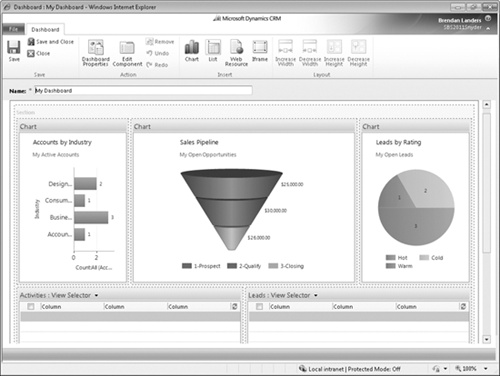
 Click Save and
Close to save the dashboard and return to the dashboard
view.
Click Save and
Close to save the dashboard and return to the dashboard
view.The newly created dashboard is displayed.


In the previous exercise, you were able to create a robust dashboard in just a few minutes by using the Dashboard designer. As your needs change, you might want to modify your dashboards accordingly. For example, you might want to add, remove, or replace a chart or list. Similarly, you might want to modify the size of a particular dashboard component. By using the same designer, you can accomplish these goals and more.
In this exercise, you will edit a dashboard in Microsoft Dynamics CRM.
Note
SET UP Use the Internet Explorer web browser to navigate to your Microsoft Dynamics CRM website, if necessary, before beginning this exercise. You need the My Dashboard dashboard you created in the previous exercise.
In the Workplace area, click Dashboards.
In the view selector, select My Dashboard.
The dashboard created in the previous exercise appears.
 On the ribbon, in the Dashboard Management group, click the
Edit button to edit the
dashboard.
On the ribbon, in the Dashboard Management group, click the
Edit button to edit the
dashboard.The dashboard layout screen is displayed.
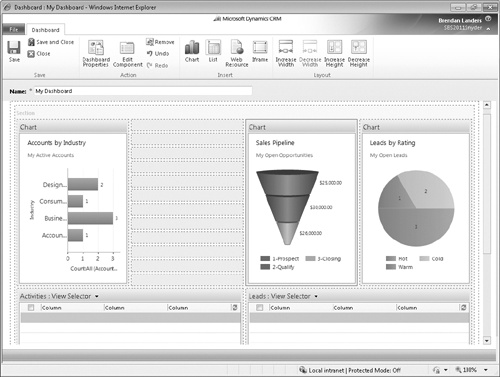
Select the Sales Pipeline chart by clicking it.
 In the Layout group on the ribbon, click the
Decrease Width button.
In the Layout group on the ribbon, click the
Decrease Width button.Drag the Sales Pipeline chart to the right so that it is next to the Leads by Rating chart.
 Select the Accounts
by Industry chart by clicking it, and then click the
Increase Width button on the ribbon.
Select the Accounts
by Industry chart by clicking it, and then click the
Increase Width button on the ribbon.The Accounts By Industry chart is expanded.
 Select the Leads by
Rating chart, and then click Edit
Component in the Action
group on the ribbon.
Select the Leads by
Rating chart, and then click Edit
Component in the Action
group on the ribbon.At the bottom of the dialog box, select the Display Chart Selection check box, and then click OK.
This allows you to change the chart to any of the other lead-based charts on the dashboard.
Select the Sales Pipeline chart, and click Edit Component on the ribbon.
In the Data Source area of the List or Chart Properties dialog box, in the Default View field, select Open Opportunities.
In the View Selector field, select Show All Views.
This allows you to change the view behind the chart on the dashboard.
Click OK to return to the dashboard layout screen.
Click Save and Close to view the modified dashboard.
The view and chart selectors are now present on the dashboard.
In the view selector on the Sales Pipeline chart, change the view to Opportunities Closing Next Month.
The chart is now updated to show the subset of opportunities.
In the chart selector on the Leads by Rating chart, change the chart to Leads by Source.
The dashboard is updated to display the Leads By Source chart.


Now that you are able to create and modify dashboards, you will probably find that you are using one particular dashboard more often than others. You might find it inconvenient to continually change the dashboard to your favorite each time you return to the dashboard screen. Microsoft Dynamics CRM allows you to set up a default dashboard to provide a convenient way to access your most heavily used dashboard.
In this exercise, you will set a default dashboard in Microsoft Dynamics CRM.
Note
SET UP Use the Internet Explorer web browser to navigate to your Microsoft Dynamics CRM website, if necessary, before beginning this exercise. You need the My Dashboard dashboard you created earlier in this chapter.
In the Workplace area, click Dashboards.
In the view selector, select My Dashboard.
The dashboard created in the earlier exercise appears.
 In the Dashboard
Management group on the ribbon, select the Set As Default button.
In the Dashboard
Management group on the ribbon, select the Set As Default button.The My Dashboard dashboard is now set as the default.
In the Workplace area, click Activities
In the Workplace area, click Dashboards.
My Dashboard now appears as the default dashboard.
In Chapter 13, you learned how to share custom charts with your colleagues. As with charts, it’s likely that your dashboards will also be useful to your colleagues. You can share a dashboard with other users in Microsoft Dynamics CRM.
In this exercise, you will share a custom dashboard with another Microsoft Dynamics CRM user.
Note
SET UP Use the Internet Explorer web browser to navigate to your Microsoft Dynamics CRM website, if necessary, before beginning this exercise. You need the My Dashboard dashboard you created earlier in this chapter.
In the Workplace area, click Dashboards.
The dashboard view appears.
In the view selector, select My Dashboard, if necessary.
 In the Action group on the ribbon, click Share Dashboard.
The Who Would You Like To Share The Selected User Dashboard With? dialog box appears.
Click Add User/Team.
In the Look Up Records dialog box, select a colleague to share the dashboard with, click the Add button, and then click OK.
Click OK to exit the previous dialog box.
Your dashboard is now shared with the selected colleague and will appear in his or her dashboard list.


Note
See Also For more information on record sharing, see Chapter 16.
Several dashboards are built into Microsoft Dynamics CRM for immediate use.
You can easily create additional dashboards to satisfy your unique business requirements.
After your dashboard has been created, you can modify them as your needs evolve.
You can set up your own default dashboard.
You can share dashboards with your colleagues so they can benefit from the dashboards you’ve built.