
Dashboards, where would the modern AV administrator be without them? A good dashboard ties large amount of relevant data into a single location and gives the administrator the ability to quickly ascertain his or her environment's overall health at a glance.
SCEP has two dashboards. One is built into the SCCM console itself, the other is accessible through SQL Reporting Services (which means it can be accessed remotely in a web browser).
For this recipe, we will be focusing on the SCCM console-based dashboard as it is the more useful of the two, allowing you to quickly perform tasks based on the information it contains. In this example, we will be ascertaining the definition health status of our clients and taking actions to resolve a deficiency.
For this recipe, you will need to be utilizing an account that has at least the SCEP administrator role assignment attached to it.
Follow these steps:
- Log into your SCCM CAS server and launch your SCCM 2012 management console.
- Navigate to
Monitoring|Overview|System Center 2012 Endpoint Protection Status. - Click on the drop-down window under Collection and select the collection you wish to evaluate. Note that you will only be presented with a list of collections that have had SCEP deployed to them; if you're in the middle of a pilot for SCEP, this might be very limited subset of collections. When you have gone production-wide with SCEP and deployed to the All Systems collection, you will be able to see information on all of your SCEP clients at once. Refer to the following screenshot:
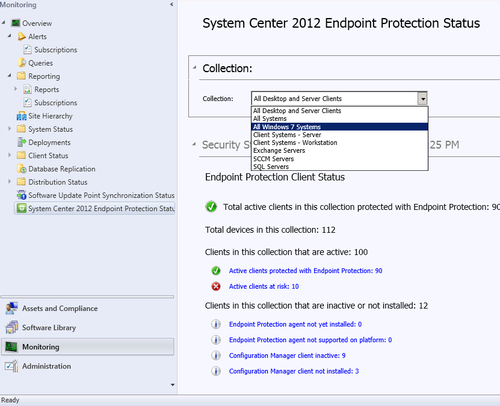
- Scroll down to the Operational State panel. On the right-hand side, you should see a column titled Definition Status on Computers, as shown in the following screenshot:

- Notice the five items under Definition Status on Computers in blue. These are actually links that, when clicked on, will create a temporary collection which contains all of the computers that fall into a given category.
- Click on the link that reads Up to 3 days old: 1 (50.0%).
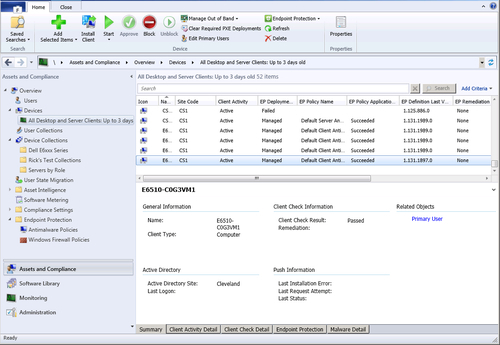
- Your view should automatically be moved to the Assets and Compliance tab and you will be looking at a collection of PCs that have definitions which are up to three days old. Refer to the following screenshot:
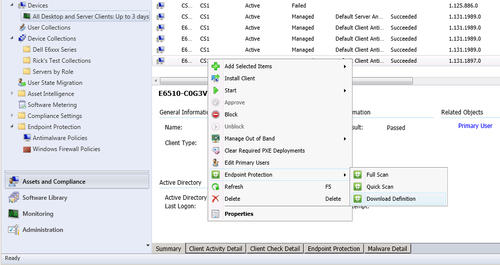
- Right-click on a computer in this list and select Endpoint Protection, Download Definition to remediate the definition status on the targeted client, as shown in the following screenshot:
- To return to the SCEP dashboard, click on the Monitoring button in the bottom left-hand side of the console.
- After waiting for a reasonable amount of time (10 minutes or more), you can force the dashboard to be re-populated with current data by clicking on the Run Summarization button at the top of console.