
C H A P T E R 6
Analyzing Operating System Performance
Solving database performance issues sometimes requires the use of operating system (OS) utilities. These tools often provide information that can help isolate database performance problems. Consider the following situations:
- You're running multiple databases and multiple applications on one server and want to use OS utilities to identify which database (and corresponding process) is consuming the most operating system resources. This approach is invaluable when one database application is consuming resources to the point of causing other databases on the box to perform poorly.
- You need to verify if the database server is adequately sized for current application workload in terms of CPU, memory, disk I/O, and network bandwidth.
- An analysis is needed to determine at what point the server will not be able to handle larger (future) workloads.
- You've used database tools to identify system bottlenecks and want to double-check the analysis via operating system tools.
In these scenarios, to effectively analyze, tune, and troubleshoot, you'll need to employ OS tools to identify resource-intensive processes. Furthermore, if you have multiple databases and applications running on one server, when troubleshooting performance issues, it's often more efficient to first determine which database and process is consuming the most resources. Operating system utilities help pinpoint whether the bottleneck is CPU, memory, disk I/O, or a network issue. In Linux/Unix environments, once you have the operating system identifier, you can then query the database to show any corresponding database processes and SQL statements.
Take a look at Figure 6-1. This flowchart details the decision-making process and the relevant Linux/Unix operating system tools that a DBA steps through when diagnosing sluggish server performance. For example, when you're dealing with performance problems, one common first task is to log on to the box and quickly check for disk space issues using OS utilities like df and du. A full mount point is a common cause of database unavailability.
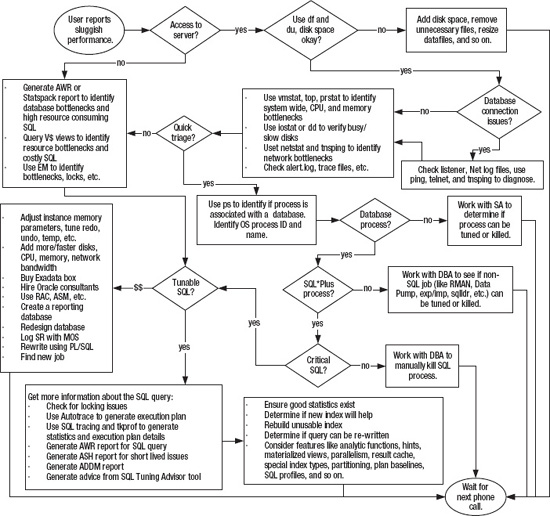
Figure 6-1. Troubleshooting poor performance
After inspecting disk space issues, the next task is to use an OS utility such as vmstat, top, or ps to determine what type of bottleneck you have. For example, is sluggish performance related to a disk I/O issue, CPU, memory, or the network? After determining the type of bottleneck, the next step is to determine if a database process is causing the bottleneck.
The ps command is useful for displaying the process name and ID of the resource-consuming session. When you have multiple databases running on one box, you can determine which database is associated with the process from the process name. Once you have the process ID and associated database, you can then log on to the database and run SQL queries to determine if the process is associated with a SQL query. If the problem is SQL-related, then you can identify further details regarding the SQL query and where it might be tuned.
Figure 6-1 encapsulates the difficulty of troubleshooting performance problems. Correctly pinpointing the cause of performance issues and recommending an efficient solution is often easier said than done. When trying to resolve issues, some paths result in relatively efficient and inexpensive solutions, such as terminating a runaway operating system process or regenerating fresh statistics. Other decisions may lead you to conclude that you need to add expensive hardware or redesign the system. Your performance tuning conclusions can have long-lasting financial impact on your company and thus influence your ability to retain a job. Obviously you want to focus on the cause of a performance problem and not just address the symptom. If you can consistently identify the root cause of the performance issue and recommend an effective and inexpensive solution, this will greatly improve your employment opportunities.
The focus of this chapter is to provide detailed examples that show how to use Linux/Unix operating system utilities to identify server performance issues. These utilities are invaluable for providing extra information used to diagnose performance issues outside of tools available within the database. Operating system utilities act as an extra set of eyes to help zero in on the cause of poor database performance.
6-1. Detecting Disk Space Issues
Problem
Users are reporting that they can't connect to a database. You log on to the database server, attempt to connect to SQL*Plus, and receive this error:
ORA-09817: Write to audit file failed.

Linux Error: 28: No space left on device

Additional information: 12
You want to quickly determine if a mount point is full and where the largest files are within this mount point.
Solution
In a Linux/Unix environment, use the df command to identify disk space issues. This example uses the -h to format the output so that space is reported in megabytes or gigabytes:
$ df -h
Here is some sample output:
Filesystem            Size  Used Avail Use% Mounted on

/dev/mapper/VolGroup00-LogVol00

                       29G   28G     0 100% /

/dev/sda1              99M   19M   75M  20% /boot
The prior output indicates that the root (/) file system is full on this server. In this situation, once a full mount point is identified, then use the find command to locate the largest files contained in a directory structure. This example navigates to the ORACLE_HOME directory and then connects the find, ls, sort, and head commands to identify the largest files beneath that directory:
If you have a full mount point, also consider looking for the following types of files that can be moved or removed:
- Deleting database trace files
- Removing large Oracle Net log files
- Moving, compressing, or deleting old archive redo log files
- Removing old installation files or binaries
- If you have datafiles with ample free space, consider resizing them to smaller sizes
Another way to identify where the disk space is being used is to find the largest space-consuming directories beneath a given directory. This example combines the du, sort, and head commands to show the ten largest directories beneath the current working directory:
$ du -S . | sort -nr | head -10
The prior command is particularly useful for identifying a directory that might not necessarily have large files in it, but lots of small files consuming space (like trace files).
![]() Note On Solaris Unix systems, the prior command will need to use
Note On Solaris Unix systems, the prior command will need to use du with the -o option.
How It Works
When you have a database that is hung because there is little or no free disk space, you should quickly find files that can be safely removed without compromising database availability. On Linux/Unix servers, the df, find, and du commands are particularly useful.
When working with production database servers, it's highly desirable to proactively monitor disk space so that you're warned about a mount point becoming full. Listed next is a simple shell script that monitors disk space for a given set of mount points:
#!/bin/bash

mntlist="/orahome /oraredo1 /oraarch1 /ora01 /oradump01 /"

for ml in $mntlist

do

echo $ml

usedSpc=$(df -h $ml | awk '{print $5}' | grep -v capacity | cut -d "%" -f1 -)

BOX=$(uname -a | awk '{print $2}')

#

case $usedSpc in

[0-9])

arcStat="relax, lots of disk space: $usedSpc"

;;

[1-7][0-9])

arcStat="disk space okay: $usedSpc"

;;

[8][0-9])

arcStat="space getting low: $usedSpc"

;;

[9][0-9])

arcStat="warning, running out of space: $usedSpc"

echo $arcStat $ml | mailx -s "space on: $BOX" [email protected]

;;

[1][0][0])

arcStat="update resume, no space left: $usedSpc"

echo $arcStat $ml | mailx -s "space on: $BOX" [email protected]

;;

*)

arcStat="huh?: $usedSpc"
esac

#

BOX=$(uname -a | awk '{print $2}')

echo $arcStat

#

done

#

exit 0
You'll have to modify the script to match your environment. For example, the second line of the script specifies the mount points on the box being monitored:
mntlist="/orahome /oraredo1 /oraarch1 /ora01 /oradump01 /"
These mount points should match the mount points listed in the output of the df –h command. For a Solaris box that this script runs on, here's the output of df:
Filesystem             size   used  avail capacity  Mounted on

/                       35G   5.9G    30G    17%    /

/ora01                 230G   185G    45G    81%    /ora01

/oraarch1              100G    12G    88G    13%    /oraarch1

/oradump01             300G    56G   244G    19%    /oradump01

/orahome                20G    15G   5.4G    73%    /orahome

/oraredo1               30G   4.9G    25G    17%    /oraredo1
Also, depending on what version of Linux/Unix you're using, you'll have to modify this line as well:
usedSpc=$(df -h $ml | awk '{print $5}' | grep -v capacity | cut -d "%" -f1 -)
The prior line of code depends on the output of the df command, which can vary somewhat depending on the operating system vendor and version. For example, on one Linux system, the output of df might span two lines and reports on Use% instead of capacity, so in this scenario, the usedSpc variable is populated as shown:
usedSpc=$(for x in `df -h $ml | grep -v "Use%"` ; do echo $x ; done |

grep "%" |  cut -d "%" -f1 -)
The prior code (broken into two lines to fit on the page) runs several Linux/Unix commands and places the output in the usedSpc variable. The command first runs df –h, which is piped to the awk command. The awk command takes the output and prints out the fifth column. This is piped to the grep command, which uses –v to eliminate the word Use% from the output. This is finally piped to the cut command, which cuts out the “%” character from the output.
On a Linux/Unix system, a shell script such as the prior one can easily be run from a scheduling utility such as cron. For example, if the shell script is named filesp.bsh, here is a sample cron entry:
#-----------------------------------------------------------------

# Filesystem check

7 * * * * /orahome/oracle/bin/filesp.bsh 1>/orahome/oracle/bin/log/filesp.log 2>&1

#-----------------------------------------------------------------
The prior entry instructs the system to run the filesp.bsh shell script at seven minutes after the hour for every hour of the day.
6-2. Identifying System Bottlenecks (vmstat)
Problem
You want to determine if a server performance issue is specifically related to disk I/O, CPU, memory, or network.
![]() Note If you are running under Solaris, see Recipe 6-3 for a specific solution applying to that operating system.
Note If you are running under Solaris, see Recipe 6-3 for a specific solution applying to that operating system.
Solution
Use vmstat to determine where the system is resource-constrained. For example, the following command reports on system resource usage every five seconds on a Linux system:
$ vmstat 5
Here is some sample output:
procs -----------memory---------- ---swap-- -----io---- --system-- -----cpu------

 r  b   swpd   free   buff  cache   si   so    bi    bo   in   cs us sy id wa st

2  0 228816 2036164  78604 3163452   0    0     1   16    0    0 29  0 70  0  0

 2  0 228816 2035792  78612 3163456   0    0     0   59  398  528 50  1 49  0  0

 2  0 228816 2035172  78620 3163448   0    0     0   39  437  561 50  1 49  0  0
To exit out of vmstat in this mode, press Ctrl+C. You can also have vmstat report for a specific number of runs. For example, this instructs vmstat to run every six seconds for a total of ten reports:
$ vmstat 6 10
Here are some general heuristics you can use when interpreting the output of vmstat:
- If the
wa(time waiting for I/O) column is high, this is usually an indication that the storage subsystem is overloaded. See Recipe 6-6 for identifying the sources of I/O contention. - If
b(processes sleeping) is consistently greater than 0, then you may not have enough CPU processing power. See Recipes 6-5 and 6-9 for identifying Oracle processes and SQL statements consuming the most CPU. - If
so(memory swapped out to disk) andsi(memory swapped in from disk) are consistently greater than 0, you may have a memory bottleneck. See Recipe 6-5 for details on identifying Oracle processes and SQL statements consuming the most memory.
How It Works
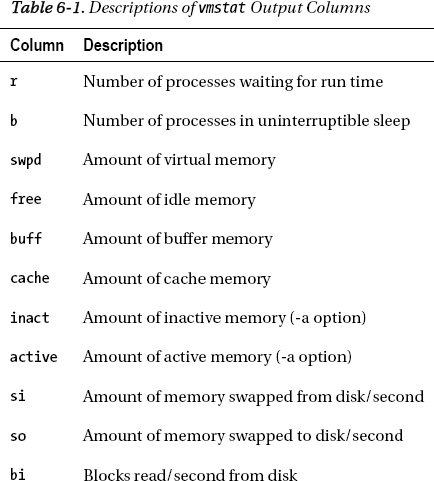
The vmstat (virtual memory statistics) tool helps quickly identify bottlenecks on your server. Use the output of vmstat to help determine if the performance bottleneck is related to CPU, memory, or disk I/O. Table 6-1 describes the columns available in the output of vmstat. These columns may vary somewhat depending on your operating system and version.

OS WATCHER
6-3. Identifying System Bottlenecks (Solaris)
Problem
You're working on a Solaris system, and irate users are reporting the database application is slow. You have multiple databases running on this box and want to identify which processes are consuming the most CPU resources. Once the resource-consuming processes are identified at the OS, then you want to map them (if possible) to a database process.
![]() Note If you are not running Solaris, then see the solution in Recipe 6-2.
Note If you are not running Solaris, then see the solution in Recipe 6-2.
Solution
On most Solaris systems, the prstat utility is used to identify which processes are consuming the most CPU resources. For example, you can instruct the prstat to report system statistics every five seconds:
$ prstat 5
Here is some sample output:
   PID USERNAME  SIZE   RSS STATE  PRI NICE      TIME  CPU PROCESS/NLWP

 16609 oracle   2364M 1443M cpu2    60    0   3:14:45  20% oracle/11

 27565 oracle   2367M 1590M cpu3    21    0   0:11:28  16% oracle/14

 23632 oracle   2284M 1506M run     46    2   0:16:18 6.1% oracle/11

  4066 oracle   2270M 1492M sleep   59    0   0:02:52 1.7% oracle/35

 15630 oracle   2274M 1482M sleep   48    0  19:40:41 1.2% oracle/11
Type q or press Ctrl+C to exit prstat. In the prior output, process 16609 is consistently showing up as a top CPU-consuming process.
After identifying a top resource-consuming process, you can determine which database the process is associated with by using the ps command. This example reports on process information associated with the PID of 16609:
$ ps -ef | grep 16609

  oracle 16609  3021  18   Mar 09 ?         196:29 ora_dw00_ENGDEV
In this example, the name of the process is ora_dw00_ENGDEV and the associated database is ENGDEV.
How It Works
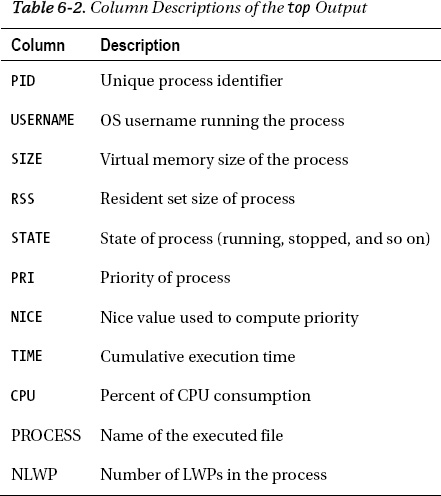
If you're working on a Solaris server, the top utility is oftentimes not installed. In these environments, the prstat command can be used to determine top resource-consuming processes on the system. Table 6-2 describes several of the columns displayed in the default output of prstat.
6-4. Identifying Top Server-Consuming Resources (top)
Problem
You have a Linux server that hosts multiple databases. Users are reporting sluggishness with an application that uses one of the databases. You want to identify which processes are consuming the most resources on the server and then determine if the top consuming process is associated with a database.
Solution
The top command shows a real-time display of the highest resource-consuming processes on a server. Here's the simplest way to run top:
$ top
Listed next is a fragment of the output:
top - 04:40:05 up 353 days, 15:16,  3 users,  load average: 2.84, 2.34, 2.45

Tasks: 454 total,   4 running, 450 sleeping,   0 stopped,   0 zombie

Cpu(s): 64.3%us,  3.4%sy,  0.0%ni, 20.6%id, 11.8%wa,  0.0%hi,  0.0%si,  0.0%st

Mem:   7645184k total,  6382956k used,  1262228k free,   176480k buffers

Swap:  4128760k total,      184k used,  4128576k free,  3953512k cached


  PID USER      PR  NI  VIRT  RES  SHR S %CPU %MEM    TIME+  COMMAND

19888 oracle    25   0  148m  13m  11m R 100.1  0.2 313371:45 oracle

19853 oracle    25   0  148m  13m  11m R 99.8  0.2 313375:41 oracle

 9722 oracle    18   0 1095m 287m 150m R 58.6  3.8   0:41.89 oracle

  445 root      11  -5     0    0    0 S  0.3  0.0   8:32.67 kjournald

 9667 oracle    15   0  954m  55m  50m S  0.3  0.7   0:01.03 oracle

    2 root      RT  -5     0    0    0 S  0.0  0.0   2:17.99 migration/0
Type q or press Ctrl+C to exit top. In the prior output, the first section of the output displays general system information such as how long the server has been running, number of users, CPU information, and so on. The second section shows which processes are consuming the most CPU resources (listed top to bottom). In the prior output, the process ID of 19888 is consuming a large amount of CPU. To determine which database this process is associated with, use the ps command:
$ ps 19888
Here is the associated output:
PID TTY      STAT   TIME COMMAND

19888 ?        Rs   313393:32 oracleO11R2 (DESCRIPTION=(LOCAL=YES)
In the prior output, the fourth column displays the value of oracleO11R2. This indicates that this is an Oracle process associated with the O11R2 database. If the process continues to consume resources, you can next determine if there is a SQL statement associated with the process (see Recipe 6-9) or terminate the process (see Recipe 6-10).
![]() Tip If you work in a Solaris operating system environment, use the
Tip If you work in a Solaris operating system environment, use the prstat command to view the top CPU-consuming processes (see Recipe 6-3 for details).
How It Works
If installed, the top utility is often the first investigative tool employed by DBAs and system administrators to identify resource-intensive processes on a server. If a process is continuously consuming excessive system resources, then you should further determine if the process is associated with a database and a specific SQL statement.
By default, top will repetitively refresh (every few seconds) information regarding the most CPU-intensive processes. While top is running, you can interactively change its output. For example, if you type >, this will move the column that top is sorting one position to the right. Table 6-3 lists the most useful hot key features to alter the top display to the desired format.

Table 6-4 describes several of the columns displayed by top. Use these descriptions to help interpret the output.


6-5. Identifying CPU and Memory Bottlenecks (ps)
Problem
You want to quickly isolate which processes on the server are consuming the most CPU and memory resources.
Solution
The ps (process status) command is handy for quickly identifying top resource-consuming processes. For example, this command displays the top ten CPU-consuming resources on the box:
$ ps -e -o pcpu,pid,user,tty,args | sort -n -k 1 -r | head
Here is a partial listing of the output:
97.8 26902 oracle   ?        oracleO11R2 (DESCRIPTION=(LOCAL=YES)(ADDRESS=(PROTOCOL=beq)))

 0.5 27166 oracle   ?        ora_diag_O11R2

0.0     9 root     ?        [ksoftirqd/2]
In the prior output, the process named oracleO11R2 is consuming an inordinate amount of CPU resources on the server. The process name identifies this as an Oracle process associated with the O11R2 database.
Similarly, you can also display the top memory-consuming processes:
$ ps -e -o pmem,pid,user,tty,args | sort -n -k 1 -r | head
How It Works
The Linux/Unix ps command displays information about currently active processes on the server. The pcpu switch instructs the process status to report the CPU usage of each process. Similarly the pmem switch instructs ps to report on process memory usage. This gives you a quick and easy way to determine which processes are consuming the most resources.
When using multiple commands on one line (such as ps, sort, and head), it's often desirable to associate the combination of commands with a shortcut (alias). Here's an example of creating aliases:
$ alias topc='ps -e -o pcpu,pid,user,tty,args | sort -n -k 1 -r | head'

$ alias topm='ps -e -o pmem,pid,user,tty,args | sort -n -k 1 -r | head'
Now instead of typing in the long line of commands, you can use the alias—for example:
$ topc
Also consider establishing the aliases in a startup file (like .bashrc or .profile) so that the commands are automatically defined when you log on to the database server.
6-6. Identifying I/O Bottlenecks
Problem
You are experiencing performance problems and want to determine if the issues are related to slow disk I/O.
Solution
Use the iostat command with the -x (extended) option combined with the -d (device) option to generate I/O statistics. This next example displays extended device statistics every ten seconds:
$ iostat –xd 10
You need a fairly wide screen to view this output; here's a partial listing:
Device:    rrqm/s wrqm/s   r/s   w/s  rsec/s  wsec/s    rkB/s    wkB/s avgrq-sz

avgqu-sz   await  svctm  %util

sda          0.01   3.31  0.11  0.31    5.32   28.97     2.66    14.49    83.13

0.06  138.44   1.89   0.08
This periodic extended output allows you to view in real time which devices are experiencing spikes in read and write activity. To exit from the previous iostat command, press Ctrl+C. The options and output may vary depending on your operating system. For example, on some Linux/Unix distributions, the iostat output may report the disk utilization as %b (percent busy).
When trying to determine whether device I/O is the bottleneck, here are some general guidelines when examining the iostat output:
- Look for devices with abnormally high blocks read or written per second.
- If any device is near 100% utilization, that's a strong indicator I/O is a bottleneck.
How It Works
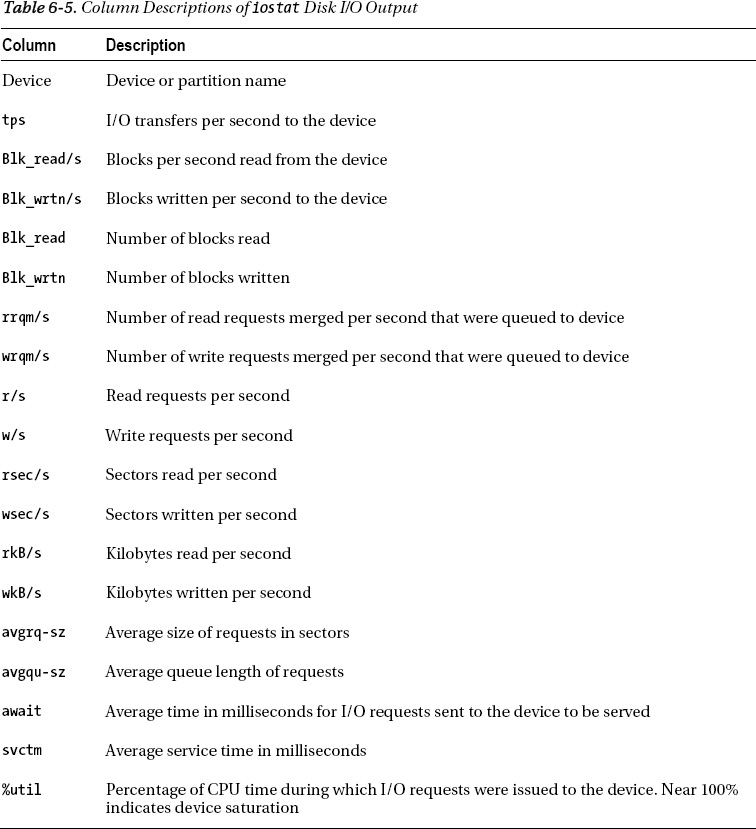
The iostat command can help you determine whether disk I/O is potentially a source of performance problems. Table 6-5 describes the columns displayed in the iostat output.
You can also instruct iostat to display reports at a specified interval. The first report displayed will report averages since the last server reboot; each subsequent report shows statistics since the previously generated snapshot. The following example displays a device statistic report every three seconds:
You can also specify a finite number of reports that you want generated. This is useful for gathering metrics to be analyzed over a period of time. This example instructs iostat to report every 2 seconds for a total of 15 reports:
$ iostat 2 15
When working with locally attached disks, the output of the iostat command will clearly show where the I/O is occurring. However, it is not that clear-cut in environments that use external arrays for storage. What you are presented with at the file system layer is some sort of a virtual disk that might also have been configured by a volume manager. In virtualized storage environments, you'll have to work with your system administrator or storage administrator to determine exactly which disks are experiencing high I/O activity.
Once you have determined that you have a disk I/O contention issue, then you can use utilities such as AWR (if licensed), Statspack (no license required), or the V$ views to determine if your database is I/O stressed. For example, the AWR report contains an I/O statistics section with the following subsections:
- IOStat by Function summary
- IOStat by Filetype summary
- IOStat by Function/Filetype summary
- Tablespace IO Stats
- File IO Stats
You can also directly query data dictionary views such as V$SQL to determine which SQL statements are using excessive I/O—for example:
SELECT *

FROM

(SELECT

  parsing_schema_name

 ,direct_writes

 ,SUBSTR(sql_text,1,75)

 ,disk_reads

FROM v$sql

ORDER BY disk_reads DESC)

WHERE rownum < 20;
To determine which sessions are currently waiting for I/O resources, query V$SESSION:
SELECT

 username

,program

,machine

,sql_id

FROM v$session

WHERE event LIKE 'db file%read';
To view objects that are waiting for I/O resources, run a query such as this:
SELECT

 object_name

,object_type

,owner

FROM v$session   a

    ,dba_objects b

WHERE a.event LIKE 'db file%read'

AND   b.data_object_id = a.row_wait_obj#;
Once you have identified queries (using the prior queries in this section), then consider the following factors, which can cause a SQL statement to consume inordinate amounts of I/O:
- Poorly written SQL
- Improper indexing
- Improper use of parallelism (which can cause excessive full table scans)
You'll have to examine each query and try to determine if one of the prior items is the cause of poor performance as it relates to I/O.
6-7. Identifying Network-Intensive Processes
Problem
You're investigating performance issues on a database server. As part of your investigation, you want to determine if there are network bottlenecks on the system.
Solution
Use the netstat (network statistics) command to display network traffic. Perhaps the most useful way to view netstat output is with the -ptc options. These options display the process ID and TCP connections, and they continuously update the output:
$ netstat -ptc
Press Ctrl+C to exit the previous command. Here's a partial listing of the output:
(Not all processes could be identified, non-owned process info

 will not be shown, you would have to be root to see it all.)

Active Internet connections (w/o servers)

Proto Recv-Q Send-Q Local Address  Foreign Address  State       PID/Program name

tcp        0      0 rmug.com:62386 rmug.com:1521    ESTABLISHED 22864/ora_pmon_RMDB

tcp        0      0 rmug.com:53930 rmug.com:1521    ESTABLISHED 6091/sqlplus

tcp        0      0 rmug.com:1521  rmug.com:53930   ESTABLISHED 6093/oracleRMDB1

tcp        0      0 rmug.com:1521  rmug.com:62386   ESTABLISHED 10718/tnslsnr
If the Send-Q (bytes not acknowledged by remote host) column has an unusually high value for a process, this may indicate an overloaded network. The useful aspect about the previous output is that you can determine the operating system process ID (PID) associated with a network connection. If you suspect the connection in question is an oracle session, you can use the techniques described in the “Solution” section of Recipe 6-9 to map an operating system PID to an Oracle process or SQL statement.
How It Works
When experiencing performance issues, usually the network is not the cause. Most likely you'll determine that bad performance is related to a poorly constructed SQL statement, inadequate disk I/O, or not enough CPU or memory resources. However, as a DBA, you need to be aware of all sources of performance bottlenecks and how to diagnose them. In today's highly interconnected world, you must possess network troubleshooting and monitoring skills. The netstat utility is a good starting place for monitoring server network connections.
6-8. Troubleshooting Database Network Connectivity
Problem
A user has reported that he or she can't connect to a database. You know there are many components involved with network connectivity and want to figure out the root cause of the problem.
Solution
Use these steps as guidelines when diagnosing Oracle database network connectivity issues:
- Use the operating system
pingutility to determine whether the remote box is accessible—for example:
$ ping dwdb

dwdb is alive
Ifpingdoesn't work, work with your system or network administrator to ensure you have server-to-server connectivity in place. - Use
telnetto see if you can connect to the remote server and port (that the listener is listening on)—for example:
$ telnet ora03 1521

Trying 127.0.0.1...

Connected to ora03.

Escape character is '^]'.
The prior output indicates that connectivity to a server and port is okay. If the prior command hangs, then contact your SA or network administrator for further assistance. - Use
tnspingto determine whether Oracle Net is working. This utility will verify that an Oracle Net connection can be made to a database via the network—for example:
$ tnsping dwrep

..........

Used TNSNAMES adapter to resolve the alias

Attempting to contact (DESCRIPTION = (ADDRESS = (PROTOCOL = TCP)

(HOST = dwdb1.us.farm.com)(PORT = 1521))

(CONNECT_DATA = (SERVER = DEDICATED) (SERVICE_NAME = DWREP)))

OK (500 msec)
Iftnspingcan't contact the remote database, verify that the remote listener and database are both up and running. On the remote box, use thelsnrctl statuscommand to verify that the listener is up. Verify that the remote database is available by establishing a local connection as a non-SYSaccount (SYScan often connect to a troubled database when other schemas will not work). - Verify that the
TNSinformation is correct. If the remote listener and database are working, then ensure that the mechanism for determiningTNSinformation (like thetnsnames.orafile) contains the correct information.
Sometimes the client machine will have multipleTNS_ADMINlocations andtnsnames.orafiles. One way to verify whether a particulartnsnames.orafile is being used is to rename it and see whether you get a different error when attempting to connect to the remote database.
How It Works
Network connectivity issues can be troublesome to diagnose because there are several architectural components that have to be in place for it to work correctly. You need to have the following in place:
- A functional network
- Open ports from point to point
- Oracle Net correctly installed and configured
- Target database and listener up and running
- Correct navigational information from the client to the target database
If you're still having issues, examine the client sqlnet.log file and the remote server listener.log file. Sometimes these log files will show additional information that will pinpoint the issue.
6-9. Mapping a Resource-Intensive Process to a Database Process
Problem
It's a dark and stormy night, and the system is performing poorly. You identify an operating system–intensive process on the box. You want to map an operating system process back to a database process. If the database process is a SQL process, you want to display the user of the SQL statement and also the SQL.
Solution
In Linux/Unix environments, if you can identify the resource-intensive operating system process, then you can easily check to see if that process is associated with a database process. The process consists of the following:
- Run an OS command to identify resource-intensive processes and associated IDs.
- Identify the database associated with the process.
- Extract details about the process from the database data dictionary views.
- If it's a SQL statement, get those details.
- Generate an execution plan for the SQL statement.
For example, suppose you identify the top CPU-consuming queries with the ps command:
$ ps -e -o pcpu,pid,user,tty,args|grep -i oracle|sort -n -k 1 -r|head
Here is some sample output:
16.4 11026   oracle ?       oracleDWREP (DESCRIPTION=(LOCAL=YES)(ADDRESS=(PROTOCOL=beq)))

 0.1  6448   oracle ?       oracleINVPRD (LOCAL=NO)

 0.5  3639   oracle ?       ora_dia0_STAGE

 0.4 28133   oracle ?       ora_dia0_DEVSEM

 0.4  4093   oracle ?       ora_dia0_DWODI

 0.4  3534   oracle ?       ora_dia0_ENGDEV

 0.2  4111   oracle ?       ora_mmnl_DWODI
The prior output identifies one operating system process consuming an excessive amount of CPU (16.4%). The process ID is 11026 and name is oracleDWREP. From the process name, it's an Oracle process associated with the DWREP database.
You can determine what type of Oracle process this is by querying the data dictionary:
SELECT

  'USERNAME   : ' || s.username     || CHR(10) ||

  'SCHEMA     : ' || s.schemaname   || CHR(10) ||

  'OSUSER     : ' || s.osuser       || CHR(10) ||

  'PROGRAM    : ' || s.program      || CHR(10) ||
  'SPID       : ' || p.spid         || CHR(10) ||

  'SID        : ' || s.sid          || CHR(10) ||

  'SERIAL#    : ' || s.serial#      || CHR(10) ||

  'KILL STRING: ' || '''' || s.sid || ',' || s.serial# || ''''  || CHR(10) ||

  'MACHINE    : ' || s.machine      || CHR(10) ||

  'TYPE       : ' || s.type         || CHR(10) ||

  'TERMINAL   : ' || s.terminal     || CHR(10) ||

  'SQL ID     : ' || q.sql_id       || CHR(10) ||

  'SQL TEXT   : ' || q.sql_text

FROM v$session s

    ,v$process p

    ,v$sql     q

WHERE s.paddr  = p.addr

AND   p.spid   = '&&PID_FROM_OS'

AND   s.sql_id = q.sql_id(+);
The prior script prompts you for the operating system process ID. Here is the output for this example:
USERNAME   : MV_MAINT

SCHEMA     : MV_MAINT

OSUSER     : oracle

PROGRAM    : sqlplus@dwdb (TNS V1-V3)

SPID       : 11026

SID        : 410

SERIAL#    : 30653

KILL STRING: '410,30653'

MACHINE    : dwdb

TYPE       : USER

TERMINAL   : pts/2

SQL ID     : by3c8848gyngu

SQL TEXT   : SELECT "A1"."REGISTRATION_ID","A1"."PRODUCT_INSTANCE_ID"

,"A1"."SOA_ID","A1"."REG_SOURCE_IP_ADDR","A1"...
The output indicates that this is a SQL*Plus process with a database SID of 410 and SERIAL# of 30653. You'll need this information if you decide to terminate the process with the ALTER SYSTEM KILL SESSION statement (see Recipe 6-10 for details).
In this example, since the process is running a SQL statement, further details about the query can be extracted by generating an execution plan:
SQL> SELECT * FROM table(DBMS_XPLAN.DISPLAY_CURSOR(('&&sql_id')));
You'll be prompted for the sql_id when you run the prior statement (in this example, the sql_id is by3c8848gyngu). Here is a partial listing of the output:
SQL_ID  by3c8848gyngu, child number 0

-------------------------------------

SELECT "A1"."REGISTRATION_ID","A1"."PRODUCT_INSTANCE_ID","A1"."SOA_ID","

A1"."REG_SOURCE_IP_ADDR","A1"."REGISTRATION_STATUS","A1"."CREATE_DTT","A

1"."DOMAIN_ID","A1"."COUNT_FLG","A2"."PRODUCT_INSTANCE_ID","A2"."SVC_TAG

Plan hash value: 4286489280
-----------------------------------------------------------------------------------------

| Id|Operation                   |Name          | Rows  | Bytes | Cost (%CPU)| Time     |

-----------------------------------------------------------------------------------------

|  0|SELECT STATEMENT            |              |       |       | 64977 (100)|          |

|  1| NESTED LOOPS               |              |       |       |            |          |

|  2|  NESTED LOOPS              |              |     1 |   499 | 64977   (5)| 00:13:00 |

|  3|   NESTED LOOPS OUTER       |              |     1 |   462 | 64975   (5)| 00:13:00 |

|  4|    NESTED LOOPS OUTER      |              |     1 |   454 | 64973   (5)| 00:13:00 |

|  5|     NESTED LOOPS           |              |     1 |   420 | 64972   (5)| 00:13:00 |

|  6|      NESTED LOOPS OUTER    |              |     1 |   351 | 64971   (5)| 00:13:00 |

|  7|       NESTED LOOPS         |              |     1 |   278 | 64969   (5)| 00:13:00 |

|  8|        NESTED LOOPS OUTER  |              |     1 |   188 | 64967   (5)| 00:13:00 |

|  9|         NESTED LOOPS       |              |     1 |   180 | 64966   (5)| 00:13:00 |

|*10|          TABLE ACCESS FULL |REGISTRATIONS |     1 |    77 | 64964   (5)| 00:13:00 |
This output will help you determine the efficiency of the SQL statement and provide insight on how to tune it. Refer to Chapter 9 for details on how to manually tune a query and Chapter 11 for automated SQL tuning.
How It Works
The process described in the “Solution” section of this recipe allows you to quickly identify resource-intensive processes, then map the OS process to a database process, and subsequently map the database process to a SQL statement. Once you know which SQL statement is consuming resources, then you can generate an execution plan to further attempt to determine any possible inefficiencies.
Sometimes the resource-consuming process will not be associated with a database. In these scenarios, you'll have to work with your SA to determine what the process is and if it can be tuned or terminated.
Also, you may encounter resource-intensive processes that are database-specific but not associated with a SQL statement. For example, you might have a long-running RMAN backup process, Data Pump, or PL/SQL jobs running. In these cases, work with your DBA to identify whether these types of processes can be tuned or killed.
ORADEBUG
Use oradebug help to display all options available.
6-10. Terminating a Resource-Intensive Process
Problem
You have identified a process that is consuming inordinate amounts of system resources (see Recipe 6-9) and determined that it's a runaway SQL statement that needs to be killed.
Solution
There are three basic ways to terminate a SQL process:
- If you have access to the terminal where the SQL statement is running, you can press Ctrl+C and attempt to halt the process.
- Determine the session ID and serial number, and then use the SQL
ALTER SYSTEM KILL SESSIONstatement. - Determine the operating system process ID, and use the
killutility to stop the process.
If you happen to have access to the terminal from which the resource-consuming SQL statement is running, you can attempt to press Ctrl+C to terminate the process. Oftentimes you don't have access to the terminal and will have to use a SQL statement or an operating system command to terminate the process.
Using SQL to Kill a Session
If it's an Oracle process and you have identified the SID and SERIAL# (see Recipe 6-9), you can terminate a process from within SQL*Plus. Here is the general syntax:
alter system kill session 'integer1, integer2 [,integer3]' [immediate];
In the prior syntax statement, integer1 is the value of the SID column and integer2 is the value from the SERIAL# column (of V$SESSION). In a RAC environment, you can optionally specify the value of the instance ID for integer3. The instance ID can be retrieved from the GV$SESSION view.
Here's an example that terminates a process with a SID of 1177 and a SERIAL# of 38583:
SQL> alter system kill session '1177,38583';
If successful, you should see this output:
System altered.
When you kill a session, this will mark the session as terminated, roll back active transactions (within the session), and release any locks (held by the session). The session will stay in a terminated state until any dependent transactions are rolled back. If it takes a minute or more to roll back the transaction, Oracle reports the session as “marked to be terminated” and returns control to the SQL prompt. If you specify IMMEDIATE (optional), Oracle will roll back any active transactions and immediately return control back to you.
Using the OS Kill Command
If you have access to the database server and access to an operating system account that has privileges to terminate an Oracle process (such as the oracle OS account), you can also terminate a process directly with the kill command.
For example, suppose you run the ps command and have done the associated work to determine that you have a SQL statement that has been running for hours and needs to be terminated. The kill command directly terminates the operating system process. In this example, the process ID of 6254 is terminated:
$ kill -9 6254
![]() Caution Ensure that you don't kill the wrong Oracle process. If you accidentally kill a required Oracle background process, this will cause your instance to abort.
Caution Ensure that you don't kill the wrong Oracle process. If you accidentally kill a required Oracle background process, this will cause your instance to abort.
How It Works
Sometimes you'll find yourself in a situation where you need to kill hung SQL processes, database jobs, or SQL statements that are consuming inordinate amounts of resources. For example, you may have a test server where a job has been running for several hours, is consuming much of the server resources, and needs to be stopped so that other jobs can continue to process in a timely manner.
Manually killing a SQL statement will cause the transaction to be rolled back. Therefore take care when doing this. Ensure that you are killing the correct process. If you erroneously terminate a critical process, this obviously will have an adverse impact on the application and associated data.