
C H A P T E R 15
Executing SQL in Parallel
Parallelism can help improve performance on particular operations simply by assigning multiple resources to a task. Parallelism is best used on systems with multiple CPUs, as the multiple processes used (that is, the parallel processes) will use those extra CPU resources to more quickly complete a given task.
As a general rule, parallelism is also best used on large tables or indexes, and on databases with large volumes of data. It is ideal for use in data warehouse environments, which are large by their nature. Parallelism is not well suited for OLTP environments, just because of the transactional nature of those systems.
In order to use parallelism properly, there are several important factors to understand:
- The number of CPUs on your system
- Proper configuration of the related initialization parameters
- The key SQL statements that you want to tune for parallelization
- The degree of parallelism (DOP) configured on your database
- The actual performance vs. expected performance of targeted SQL operations
One of the most common pitfalls of parallelism is overuse. It is sometimes seen as a magic bullet to tune and speed up SQL operations. In turn, parallelism can actually lead to poorer rather than better performance. Therefore, it is critically important for the DBA to understand the physical configuration of his or her system, and configure parallelism-related parameters to best suit the system. Educating developers and users of your database about basic questions will increase the success rate of parallel operations. When is it appropriate to use parallelism? How do you properly enable parallelism in SQL operations? What type of operations can be parallelized? Parallelism is a powerful tool to aid in drastically improving performance of database operations, but with that power comes responsibility.
This chapter focuses on the methods to properly configure your database for parallelism, key operations that can be parallelized, how to induce parallelism in your SQL, and some tools to use to see if parallel operations are running optimally.
15-1. Enabling Parallelism for a Specific Query
Problem
You have a slow-running query accessing data from a large table. You want to see if you can speed up the query by instructing Oracle to use multiple processes to retrieve the data.
Solution
There are two distinct types of hints to place in your SQL to try to speed up your query by using multiple processes, or parallelism. One type of hint is for data retrieval itself, and the other is to help speed the process of reading the indexes on a table.
Parallel Hints for Tables
First, you need to determine the degree of parallelism (DOP) desired for the query. This instructs Oracle how many processes it will use to retrieve the data. Second, place a parallel hint inside of the query specifying the table(s) on which to execute parallel SQL, as well the degree of parallelism to use for the query—for example:
SELECT /*+ parallel(emp,4) */  empno, ename

FROM emp;
If you use a table alias in your query, you must use it in your hint, else the Oracle optimizer will ignore the hint.
SELECT/*+ parallel(e,4) */  empno, ename

FROM emp e;
The hints in the preceding two queries result in four processes dividing the work of reading rows from the EMP table. Four processes working together will get the job done faster in terms of wall-clock time than one process doing all the work by itself.
Optionally, you can omit specifying a degree of parallelism within the hint. If you specify only the table name or alias in the hint, Oracle will derive the degree of parallelism based on the database initialization parameters, which may or may not give you the desired degree of parallelism:
SELECT/*+ parallel(e) */  empno, ename

FROM emp e;
Parallel Hints for Indexes
Specify the parallel_index hint to control parallel access to indexes. You can generally access an index in parallel only when the index is a locally partitioned index. In that case, you can apply the parallel_index hint. Here's an example:
SELECT /*+ parallel_index(emp, emp_i4 ,4) */ empno, ename

FROM emp

WHERE deptno = 10;
There are two arguments to the parallel_index hint: table name and index name. As with specifying the degree of parallelism on tables, if you omit the degree of parallelism from within an index hint, the database itself will compute the degree of parallelism for the query.
If you alias your tables, then you must use the alias names in your hints. See the preceding section on “Parallel Hints for Tables” for an example.
How It Works
In order to effectively use parallel hints, you need to take the following items into consideration:
- The number of tables in your query
- The size of table(s) in your query
- The number of CPUs on your system
- The filtering columns in your
WHEREclause - What columns are indexed, if any
You also must analyze and understand three key components of your system prior to using parallel hints in queries:
- System configuration, such as amount of memory and CPUs, and even disk configuration
- Database configuration parameters related to parallelism
- The DOP specified on the objects themselves (tables and indexes)
Parallel SQL must be used with caution, as it is common to overuse, and can cause an over-utilization of system resources, which ultimately results in slower rather than faster performance. Overuse is a very common mistake in the use of parallelism.
Depending on the number of tables in your query, you may want to place parallelism on one or more of the tables—depending on their size. A general rule of thumb is that if a table contains more than 10 million rows, or is at least 2 gigabytes in size, it may be a viable candidate for using parallelism.
The degree of parallelism (DOP) should be directly related to the number of CPUs on your system. If you have a single-CPU system, there is little, if any, benefit of using parallel SQL, and the result could very well be returned slower than if no parallelism was used at all.
To help determine if you can use parallelism on any indexes, you need to first determine if any of the filtering columns in your WHERE clause are indexed. If so, check to see if the table is partitioned. Typically, then, for a query on a large table, a parallel_index hint may help the speed of your query. Overall, when trying to determine whether to use parallelism for your query, it's helpful to perform an explain plan to determine if parallelism will be used. Also, there may be parallelism already specified for an object within your query, so it is also a good idea to check the DEGREE column in the USER_TABLES or USER_INDEXES view prior to checking the degree of parallelism within a hint.
Table 15-1 shows the different parallel hints that can be used.

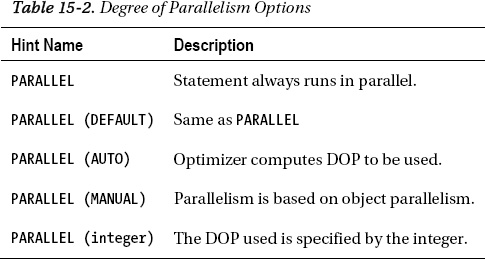
There are many options Oracle gives you to help you determine a proper DOP, and whether you want to specify it yourself, or you want Oracle to determine the DOP for your query. Table 15-2 briefly describes these options.
Parallel Hints for Tables
In order to determine if parallelism is being used in your query, first perform an explain plan on your query. The following are a simple query and its associated execution plan:
select * from emp;


--------------------------------------------------------------------------

| Id  | Operation         | Name | Rows  | Bytes | Cost (%CPU)| Time     |

--------------------------------------------------------------------------

|   0 | SELECT STATEMENT  |      |    14 |  1218 |     3   (0)| 00:00:01 |

|   1 |  TABLE ACCESS FULL| EMP  |    14 |  1218 |     3   (0)| 00:00:01 |

--------------------------------------------------------------------------
If parallelism isn't being used, you can insert the parallel hint, and then rerun the explain plan to verify that the optimizer will use parallelism in the execution plan—for example:
select /*+ parallel(emp,4) */ * from emp;


----------------------------------------------------------------------

| Id  | Operation            | Name     |    TQ  |IN-OUT| PQ Distrib |

----------------------------------------------------------------------

|   0 | SELECT STATEMENT     |          |        |      |            |

|   1 |  PX COORDINATOR      |          |        |      |            |

|   2 |   PX SEND QC (RANDOM)| :TQ10000 |  Q1,00 | P->S | QC (RAND)  |

|   3 |    PX BLOCK ITERATOR |          |  Q1,00 | PCWC |            |

|   4 |     TABLE ACCESS FULL| EMP      |  Q1,00 | PCWP |            |

----------------------------------------------------------------------
![]() Note The proper database initialization parameters need to be properly set in order for parallelism to be enabled via the use of hints.
Note The proper database initialization parameters need to be properly set in order for parallelism to be enabled via the use of hints.
Parallel Hints for Indexes
Although it is far less common to parallelize index-based queries, it may be of benefit in certain circumstances. For example, you may want to parallelize the query against a local index that is part of a partitioned table. The following is an example query and the resulting execution plan:
SELECT /*+ parallel_index(emp, emp_i3) */ empno, ename

FROM emp

WHERE hiredate between '2010-01-01' and '2010-12-31';


------------------------------------------------------------------------------------------

| Id  | Operation                            | Name             |    TQ  |IN-OUT| PQ Dist|

------------------------------------------------------------------------------------------

|   0 | SELECT STATEMENT                     |                  |        |      |        |

|   1 |  PX COORDINATOR                      |                  |        |      |        |

|   2 |   PX SEND QC (RANDOM)                | :TQ10000         |  Q1,00 | P->S |        |

|   3 |    PX PARTITION RANGE ITERATOR       |                  |  Q1,00 | PCWC |        |

|   4 |     TABLE ACCESS BY LOCAL INDEX ROWID| EMP              |  Q1,00 | PCWP |        |

|   5 |      INDEX RANGE SCAN                | EMP_I3           |  Q1,00 | PCWP |        |

------------------------------------------------------------------------------------------
When formatting the hint, you can specify all the parameters that tell the optimizer exactly which index to use, and what DOP you desire. In the following query, we're telling the optimizer that we want to use the EMP_I3 index, with a DOP of 4.
SELECT /*+ parallel_index(emp, emp_i3, 4) */ empno, ename

FROM emp

WHERE hiredate between '2010-01-01' and '2010-12-31';
If you omit the DOP from the hint, the optimizer determines the DOP based on the initialization parameter settings. For instance, in the following example, the table name and index name are specified in the hint, but the DOP is not specified. Oracle will compute the DOP for us in these cases.
SELECT /*+ parallel_index(emp, emp_i3) */ empno, ename

FROM emp

WHERE hiredate between '2010-01-01' and '2010-12-31';
You can also simply place the table name in the hint, and the optimizer will also determine which index, if any, can be used. If the optimizer determines that no index is suitable, then no index will be used. In the following example, only the table name is used in the hint:
SELECT /*+ parallel_index(emp) */ empno, ename

FROM emp

WHERE hiredate between '2010-01-01' and '2010-12-31';
![]() Note As of Oracle 11g Release 2, the
Note As of Oracle 11g Release 2, the NOPARALLEL and NOPARALLEL_INDEX hints have been deprecated. Instead, use NO_PARALLEL and NO_PARALLEL_INDEX.
15-2. Enabling Parallelism at Object Creation
Problem
You have new tables to create in your database that will be growing to a very large size, and you want speed the queries against those tables.
Solution
Having a higher than default DOP on a table or index is an easy way to set a more consistent and fixed method of enabling multiple processes on tables and indexes. Enabling parallelism on tables or indexes is done within DDL commands. You can enable parallelism within the CREATE statement when creating a table or an index.
For a new table, if you are expecting to have consistent queries that can take advantage of multiple processes, it may be easier to set a fixed DOP on your object, rather than having to place hints in your SQL, or let Oracle set the DOP for you. In the following example, we've specified a DOP of 4 on the EMP table:
CREATE TABLE EMP

(

 EMPNO NUMBER(4) CONSTRAINT PK_EMP PRIMARY KEY,

 ENAME VARCHAR2(10),

 JOB VARCHAR2(9),

 MGR NUMBER(4),
 HIREDATE DATE,

 SAL NUMBER(7,2),

 COMM NUMBER(7,2),

 DEPTNO NUMBER(2) CONSTRAINT FK_DEPTNO REFERENCES DEPT

)

PARALLEL(DEGREE 4);
By placing a static DOP of 4 on the table, any user accessing the EMP table will get a DOP of 4 for each query executed.
select * from emp;


----------------------------------------------------------------------

| Id  | Operation            | Name     |    TQ  |IN-OUT| PQ Distrib |

----------------------------------------------------------------------

|   0 | SELECT STATEMENT     |          |        |      |            |

|   1 |  PX COORDINATOR      |          |        |      |            |

|   2 |   PX SEND QC (RANDOM)| :TQ10000 |  Q1,00 | P->S | QC (RAND)  |

|   3 |    PX BLOCK ITERATOR |          |  Q1,00 | PCWC |            |

|   4 |     TABLE ACCESS FULL| EMP      |  Q1,00 | PCWP |            |

----------------------------------------------------------------------
You can also specify a default DOP when creating an index. There are circumstances where it may be beneficial to create an index with a higher DOP. With large partitioned tables, it is common to have secondary locally partitioned indexes on often-used columns in the WHERE clause. Some queries that use these indexes may benefit from increasing the DOP. In the following DDL, we've created this index with a DOP of 4:
CREATE INDEX EMP_I1

ON EMP (HIREDATE)

LOCAL

PARALLEL(DEGREE 4);
How It Works
Placing parallelism on objects themselves helps multiple processes complete the task at hand sooner—whether it be to speed up queries, or to help speed up the creation of an index. In order to be able to assess the proper DOP to place on an object, you should know the access patterns of the data. If less information is known about the objects, the more conservative the DOP should be. Placing a high DOP on a series of objects can hurt performance just as easily as it can help, so enabling DOP on objects needs to be done with careful planning and consideration.
![]() Tip If automatic DOP is enabled and configured properly (
Tip If automatic DOP is enabled and configured properly (PARALLEL_DEGREE_POLICY=AUTO), then the parallelism that you set on objects is ignored, and the optimizer chooses the degree of parallelism to be used. See Recipe 15-10 for details on enabling automatic DOP.
15-3. Enabling Parallelism for an Existing Object
Problem
You have a series of slow-running queries accessing a set of existing database tables, and you want to take steps to reduce the execution time of the queries.
Solution
Setting a higher DOP on an existing table or index is an easy way to have a more consistent and fixed method of enabling multiple processes on tables and indexes. Setting the DOP for tables or indexes is done within DDL commands. You can change the DOP on a table or index by using the ALTER statement. For instance, if you have an existing table that needs to have the DOP changed to accommodate user queries that want to take advantage of multiple processes, they can be added easily to the table, which takes effect immediately. The following example alters the default DOP for a table:
ALTER TABLE EMP

PARALLEL(DEGREE 4);
If, after a time, you wish to reset the DOP on your table, you can also do that with the ALTER statement. See the following two examples on how to reset the DOP for a table:
ALTER TABLE EMP

PARALLEL(DEGREE 1);


ALTER TABLE EMP

NOPARALLEL;
If you have an already existing index that you think will benefit from a higher DOP, it can also easily be changed. As with tables, the change takes effect immediately. The following example shows how to change the default DOP for an index:
ALTER INDEX EMP_I1

PARALLEL(DEGREE 4);
As with tables, you can reset the DOP on an index either of the following two ways:
ALTER INDEX EMP_I4

PARALLEL(DEGREE 1);


ALTER INDEX EMP_I4

NOPARALLEL;
How It Works
Increasing the DOP on an existing object is a sign that you already have a performance issue for queries accessing tables within your database. Monitoring parallelism performance is a key factor in knowing if the DOP set for an object or set of objects is appropriate. Examine data in the V$PQ_TQSTAT to assist in determining the DOP that has been used, or V$SYSSTAT to assist in the extent that parallelism is being used on your database. Refer to Recipe 15-12 for some examples of using these data dictionary views.
15-4. Implementing Parallel DML
Problem
You want to induce parallelism when performing DML operations (INSERT, UPDATE, MERGE, DELETE) in order to speed performance and reduce transaction time.
Solution
If operating within a data warehouse environment or an environment with large tables that require a high volume of bulk transactions, parallel DML can help speed up processing and reduce the time it takes to perform these operations. Parallel DML is disabled by default on a database, and must be explicitly enabled with the following statement:
ALTER SESSION ENABLE PARALLEL DML;
By specifying the foregoing statement, it truly enables parallel DML to be possible in a session, but does not guarantee it. Parallel DML operations will occur only under certain conditions:
- Hints are specified in a DML statement.
- Tables with a parallel attribute are part of a DML statement.
- The DML operations meet the appropriate rules for a statement to run in parallel. Key restrictions for using parallel DML are noted later in the recipe.
You may desire, in certain circumstances, to force parallel behavior, regardless of the parallel degree you have placed on an object, or regardless of any hints you've placed in your DML. So, alternatively, you can force parallel DML with the following statement:
ALTER SESSION FORCE PARALLEL DML;
As a general rule, it is not good practice to force parallel DML in your regularly run DML, as it can quickly consume system resources to a point where performance begins to suffer. It is best used sparingly, and can help with occasional large DML operations.
How It Works
Parallel DML can work for any DML operation—INSERT, UPDATE, MERGE, and DELETE. The rules vary slightly depending on which DML operation you are running. If you want to run an INSERT statement in parallel, for instance, first enable parallelism for your session, and then execute your INSERT statement with the appropriate mechanism in order for the DML to run in parallel:
ALTER SESSION ENABLE PARALLEL DML;


INSERT /*+ PARALLEL(DEPT,4) */ INTO DEPT

SELECT /*+ PARALLEL(DEPT_COPY,4) */ * FROM DEPT_COPY;
With the foregoing statement, we put a parallel hint into the INSERT statement, and also put a parallel HINT into the SELECT portion of the statement. A very important thing to remember is that even if parallelism is in effect for your DML statement, it does not directly impact any parallelism on a related query within the same statement. For instance, the following statement's DML operation can run in parallel, but the corresponding SELECT statement will run in serial mode, as no parallelism is specified on the query itself.
ALTER SESSION ENABLE PARALLEL DML;


INSERT /*+ PARALLEL(DEPT,4) */ INTO DEPT

SELECT * FROM DEPT_COPY;
In order to take full advantage of parallel capabilities, try to parallelize all portions of a statement. If you parallelize the INSERT but not the SELECT, the SELECT portion becomes a bottleneck for the INSERT, and the INSERT performance suffers.
Parallel DML operations can also occur on UPDATE, MERGE, and DELETE statements. Let's say your company was generous and decided to give everyone in the accounting department a 1% raise:
UPDATE /*+ PARALLEL(EMP,4) */ EMP

SET SAL = SAL*1.01

WHERE DEPTNO=10;
Then, after a period of months, your company decides to lay off those employees they gave raises to in accounting:
DELETE /*+ PARALLEL(EMP,4) */ FROM EMP

WHERE DEPTNO=10;
Another way to parallelize a DML transaction within your database is to use the DBMS_PARALLEL_EXECUTE PL/SQL package. Although more complex to configure, there are some key advantages of using this package to run your parallelized transactions:
- The overall transaction is split into pieces, each of which has its own commit point.
- Transactions are restartable.
- Locks are done only on affected rows.
- Undo utilization is reduced.
- You have more control over how the work is divided. You can divide the work in several ways:
- By column
- By ROWID
- By SQL statement
The obvious benefits of using the DBMS_PARALLEL_EXECUTE package are greater control over how large transactions are run, increased functionality, and more efficient use of database resources. The key trade-off with using this package is it is simply more complex to configure, set up, and run—but may be well worth it when processing large volumes of data.
![]() Tip You must execute the
Tip You must execute the ALTER SESSION ENABLE | FORCE PARALLEL DML statement in order for parallel DML to occur for your transaction.
Restrictions on Parallel DML
There are plenty of restrictions in using parallel DML, and you need to understand that even if dealing with a large volume of data, parallel DML may not be possible in certain circumstances:
- Individual inserts of rows (using
VALUESclause) cannot be run in parallel. - You can modify a table only one time within a transaction.
- Cannot be run for tables with triggers
- Tables with certain constraints may not be eligible.
- There is limited parallel DML functionality on tables with objects or LOB columns.
- There is limited parallel DML functionality on temporary tables.
- Distributed transactions cannot be parallelized.
Degree of Parallelism
Once you submit a parallelized DML operation for execution, Oracle determines, based on a set of precedence rules, what DOP will be used for the entire statement being submitted. It is important to understand these rules so you get the desired DOP you are expecting for your transaction.
For DML transactions, Oracle applies the following base rules of precedence to determine DOP:
- Checks to see if an hint is specified on
INSERT,UPDATE,MERGE, orDELETEstatements - Checks to see if there are any session-level instructions
- Checks the object-level parallelism on the target object
- Chooses maximum DOP specified between the queried table or any associated indexes for the query portion of the statement (insert only)
After choosing the appropriate DOP for the insert and query portions of the statement, the query is executed. Note that the DOP chosen for each portion of the statement can be different.
Other Considerations
Using parallel DML can be complex, as there are many permutations of possibilities of the type of objects involved: whether they are partitioned, the DOP specified on the objects, the hints specified in statements, and the parallel parameter settings, just to name a few.
Here are some other factors that need to be considered when using parallel DML:
- For parallelized insert transactions, direct-path loads are performed.
- When deciding whether to use parallel DML, you must weigh the performance gain you will achieve with the space usage for that operation. Parallelized
INSERTstatements are fast, but cost you more space. If you have specified a DOP of 4 for an insert transaction, 4 extents will be allocated for that operation. You must determine based on your requirements what is more important. - If objects are partitioned, it can affect how a parallel DML transaction runs.
15-5. Creating Tables in Parallel
Problem
You need to quickly create a table from an existing large table, and want to employ the use of multiple processes to help speed up the creation of the table.
Solution
If you are administering very large databases (VLDBs) or have to rebuild a large table, parallel DDL is fast and has advantages over running parallel DML. Speed is the biggest factor in choosing to use parallel DDL to create a table from an existing large table. Within your specific DDL command, there is a PARALLEL clause that determines if operations are to be performed in parallel. This is done by using the CREATE TABLE ... AS SELECT operation:
CREATE TABLE EMP_COPY

PARALLEL(DEGREE 4)

AS

SELECT * FROM EMP;


------------------------------------------------------------------------

| Id  | Operation              | Name     |    TQ  |IN-OUT| PQ Distrib |

------------------------------------------------------------------------

|   0 | CREATE TABLE STATEMENT |          |        |      |            |

|   1 |  PX COORDINATOR        |          |        |      |            |

|   2 |   PX SEND QC (RANDOM)  | :TQ10000 |  Q1,00 | P->S | QC (RAND)  |

|   3 |    LOAD AS SELECT      | EMP_COPY |  Q1,00 | PCWP |            |

|   4 |     PX BLOCK ITERATOR  |          |  Q1,00 | PCWC |            |

|   5 |      TABLE ACCESS FULL | EMP      |  Q1,00 | PCWP |            |

------------------------------------------------------------------------
How It Works
The reason parallel DDL is popular is that it is a fast way to perform operations on a large amount of data. The work is divided up in several pieces and done concurrently. Let's say you just bought a new house, and are in the process of moving. If you are loading a large moving truck with boxes, it will simply be faster with four people loading rather than one. Moreover, parallel DDL is an attractive way to perform DML-type operations under the covers of DDL commands.
The most common reasons to use the CREATE TABLE ... AS SELECT include the following:
- The table structure has changed and you need to rebuild the table.
- You are creating a like structure for some specific application purpose.
- You are deleting a large number of rows from the table.
- You need to drop multiple columns from a large table.
Some of the foregoing operations could also be strictly handled with parallel DML, but using parallel DDL has a distinct advantage over parallel DML. Since DDL operations cannot be rolled back, undo is not generated for these operations, and it is simply a more efficient operation.
The DOP for a parallel DDL operation is determined by the object DOP. This also includes the query portion of the statement. If you choose to, you can override the DOP of the objects by issuing the following command:
ALTER SESSION FORCE PARALLEL DDL;
If you have a very large table from which you need to delete many rows, consider using CREATE TABLE ... AS SELECT rather than using a DML DELETE statement. Deleting rows is an expensive operation. In large data warehouse environments, in scenarios where a large volume of rows needs to be deleted, the cost and time of doing the delete can quickly become unmanageable. Because of the nature of delete, it is very resource-intensive for the database as far as the amount of redo and undo generation it takes to perform the operation. One good rule of thumb to use is that if you are deleting as little as 5–10% of the rows of a large table, it can be simply faster to create a new table with all the rows you want to keep.
Here is an example where we are deleting about 20% of the rows from our EMP table of 1,234,568 rows:
  delete /*+ parallel(emp,4) */ from emp

  where empno > 1000000

SQL> /


234568 rows deleted.


Elapsed: 00:00:09.94


--------------------------------------------------------------------------

| Id  | Operation                | Name     |    TQ  |IN-OUT| PQ Distrib |

--------------------------------------------------------------------------

|   0 | DELETE STATEMENT         |          |        |      |            |

|   1 |  PX COORDINATOR          |          |        |      |            |

|   2 |   PX SEND QC (RANDOM)    | :TQ10001 |  Q1,01 | P->S | QC (RAND)  |

|   3 |    INDEX MAINTENANCE     | EMP      |  Q1,01 | PCWP |            |

|   4 |     PX RECEIVE           |          |  Q1,01 | PCWP |            |

|   5 |      PX SEND RANGE       | :TQ10000 |  Q1,00 | P->P | RANGE      |

|   6 |       DELETE             | EMP      |  Q1,00 | PCWP |            |

|   7 |        PX BLOCK ITERATOR |          |  Q1,00 | PCWC |            |

|   8 |         TABLE ACCESS FULL| EMP      |  Q1,00 | PCWP |            |

--------------------------------------------------------------------------
This delete took 9.94 seconds to run. If we now run a CREATE TABLE ... AS SELECT statement to achieve the same result, we can see the difference in performance.
create table emp_ctas_new2

parallel(degree 4)

nologging

as select /*+ parallel(a,4) */ * from emp_ctas

where empno <= 1000000

SQL> /

Elapsed: 00:00:01.70


--------------------------------------------------------------------------------------

| Id  | Operation                        | Name         |    TQ  |IN-OUT| PQ Distrib |

--------------------------------------------------------------------------------------

|   0 | CREATE TABLE STATEMENT           |              |        |      |            |

|   1 |  PX COORDINATOR                  |              |        |      |            |

|   2 |   PX SEND QC (RANDOM)            | :TQ10001     |  Q1,01 | P->S | QC (RAND)  |

|   3 |    LOAD AS SELECT                | EMP_CTAS_NEW |  Q1,01 | PCWP |            |

|   4 |     PX RECEIVE                   |              |  Q1,01 | PCWP |            |

|   5 |      PX SEND ROUND-ROBIN         | :TQ10000     |        | S->P | RND-ROBIN  |

|   6 |       TABLE ACCESS BY INDEX ROWID| EMP_CTAS     |        |      |     |

|   7 |        INDEX RANGE SCAN          | EMP_CTAS_PK  |        |      |     |

--------------------------------------------------------------------------------
Creating the table took 1.7 seconds, over 5 times faster than performing the same operation with a DELETE statement. If you have indexes on the table, however, you need to consider that as a factor before choosing this method, because if you re-create a table, you must also re-create the associated indexes for that table. It's still likely to be faster, however, as you can re-create any indexes in parallel as well.
Keep in mind that, even though the foregoing example uses parallel DDL on these statements, this concept holds true even if you are running in serial mode. When you need to delete a large number of rows from a table, the CREATE TABLE ... AS SELECT can be compared favorably to DELETE with parallel-executed DDL or non-parallel, serial-executed DDL.
One potential drawback of creating tables in parallel is that the space allocations for these operations may leave the table more fragmented than if you created the table serially. This is a trade-off that should be considered when creating tables in parallel. The DOP that is specified in the operation spawns that number of parallel threads, and one extent is allocated for each thread. So, if you have specified a DOP of 4 for your parallel operation, there will be a minimum of 4 extents allocated for the operation. Depending on the MINIMUM EXTENT size for the tablespace, Oracle does attempt to trim unused space at the end of the operation. You should expect, though, that parallel create table operations are simply less space-efficient than operations run serially.
15-6. Creating Indexes in Parallel
Problem
You need to create indexes for a large table as quickly as possible and want to employ the use of multiple processes to help speed up the index creation.
Solution
Any time you have a large table, it is a good idea to always create any associated index for that table using parallel DDL, even if you want the DOP on the index to be non-parallelized for queries. The major benefit of creating an index in parallel is that it simply takes much less time to create the index. It always makes sense to create an index for a large table in parallel, and then optionally choose to reset the DOP used for queries after the create operation is complete. In the following example, we are creating the index with a DOP of 4, which will be used during the process of creating the index:
CREATE INDEX EMP_COPY_I1

ON EMP_COPY (HIREDATE)

PARALLEL(DEGREE 4);
Then, after the index has been created, we can choose to reset the DOP to a different value for use by queries, using either of the following examples:
ALTER INDEX EMP_COPY_I1 NOPARALLEL;

ALTER INDEX EMP_COPY_I1 PARALLEL(DEGREE 1);
How It Works
The primary reason you want to run parallel DDL on an index is to either create or rebuild a large, existing index. Some of the reasons you may have to do this include the following:
- Adding an index to an already existing large table
- Rebuilding an index that has become fragmented over time
- Rebuilding an index after a large, direct-path load of data
- You want to move an index to a different tablespace
- The index is in an unusable state due to a partition-level operation on the associated table
As with tables, if you wish to bypass the parallelism specified on the index, you can “force” the issue by running the following command:
ALTER SESSION FORCE PARALLEL DDL;
15-7. Rebuilding Indexes in Parallel
Problem
You have an existing index that needs to be rebuilt quickly, and you want to use multiple processes to speed up the index rebuild process.
Solution
Situations may arise where you may need to rebuild an index, for many of the same reasons to re-create an index. To rebuild an index in parallel, use the ALTER INDEX command:
ALTER INDEX EMP_COPY_I1

REBUILD

PARALLEL(DEGREE 4);


--------------------------------------------------------------------------------

| Id  | Operation                   | Name        |    TQ  |IN-OUT| PQ Distrib |

--------------------------------------------------------------------------------

|   0 | ALTER INDEX STATEMENT       |             |        |      |            |

|   1 |  PX COORDINATOR             |             |        |      |            |

|   2 |   PX SEND QC (ORDER)        | :TQ10001    |  Q1,01 | P->S | QC (ORDER) |

|   3 |    INDEX BUILD NON UNIQUE   | EMP_COPY_I1 |  Q1,01 | PCWP |            |

|   4 |     SORT CREATE INDEX       |             |  Q1,01 | PCWP |            |

|   5 |      PX RECEIVE             |             |  Q1,01 | PCWP |            |

|   6 |       PX SEND RANGE         | :TQ10000    |  Q1,00 | P->P | RANGE      |

|   7 |        PX BLOCK ITERATOR    |             |  Q1,00 | PCWC |            |

|   8 |         INDEX FAST FULL SCAN| EMP_COPY_I1 |  Q1,00 | PCWP |            |

--------------------------------------------------------------------------------
If you need to rebuild a partition of a large local index, you can also use parallelism to perform this operation. See the following example:
ALTER INDEX emppart_i1

REBUILD PARTITION emppart2001_p

PARALLEL(DEGREE 4);


--------------------------------------------------------------------------------------

| Id  | Operation                   | Name       | Pstart| Pstop |IN-OUT| PQ Distrib |

--------------------------------------------------------------------------------------

|   0 | ALTER INDEX STATEMENT       |            |       |       |      |            |

|   1 |  PX COORDINATOR             |            |       |       |      |            |

|   2 |   PX SEND QC (ORDER)        | :TQ10001   |       |       | P->S | QC ORDER)  |

|   3 |    INDEX BUILD NON UNIQUE   | EMPPART_I1 |       |       | PCWP |            |

|   4 |     SORT CREATE INDEX       |            |       |       | PCWP |            |

|   5 |      PX RECEIVE             |            |       |       | PCWP |            |

|   6 |       PX SEND RANGE         | :TQ10000   |       |       | P->P | RANGE      |

|   7 |        PX BLOCK ITERATOR    |            |     2 |     2 | PCWC |            |

|   8 |         INDEX FAST FULL SCAN| EMPPART_I1 |     2 |     2 | PCWP |            |

--------------------------------------------------------------------------------------
How It Works
Rebuilding an index has a key advantage over re-creating an index from scratch, as well as a key disadvantage. The advantage of rebuilding an index is that the existing index is in place until the rebuild operation is complete, so it can therefore be used by queries that are run concurrently with the rebuild process. The main disadvantage of the index rebuild process is that you will need space for both indexes, which is required during the rebuild process. Some of the key reasons to rebuild an index include the following:
- Rebuilding an index that has become fragmented over time
- Rebuilding an index after a large, direct-path load of data
- You want to move an index to a different tablespace
- The index is in an unusable state due to a partition-level operation on the associated table.
15-8. Moving Partitions in Parallel
Problem
You need to move a table partition to a different tablespace, and wish to employ the use of multiple processes to accomplish this task.
Solution
Let's say you want to move a table partition to another tablespace. For instance, you've created a tablespace on slower, cheaper storage, and you want to move older data there in order to reduce the overall cost of storage on your database. To alter a table to rebuild a partition in parallel, you would issue a command such as the one here:
ALTER TABLE EMP

MOVE PARTITION P2

TABLESPACE EMP_S

PARALLEL(DEGREE 4);
How It Works
The ALTER TABLE statement to move a partition is an easy, efficient way to move data around for a partitioned table. As with some of the other parallel DDL operations shown within this chapter, there are several reasons to need to move a table partition to a different tablespace:
- You are moving older data to cheaper, slower storage.
- You are consolidating a series of partitions to a single tablespace.
- You are moving certain partitions to separate tablespaces to logically group types of data.
Table partitioning is often done to store historical data. Over time, partition maintenance often needs to occur for partitioned tables. By enabling the use of parallelism when moving partitions for a table within your database, it can simply be done faster. With maintenance windows shrinking and data access needs growing, this helps perform necessary partition movements faster, while reducing downtime for your database tables.
15-9. Splitting Partitions in Parallel
Problem
You have a partition with a large amount of data, and want to split that larger partition into two or more smaller partitions.
Solution
As a DBA, at times the need arises to split partitions, and this operation can also be done in parallel. For instance, let's say you have a partitioned table that has a default high-end partition with a large amount of data, and you want to split that data into multiple partitions. In cases such as these, you can split that default partition in parallel to speed up the partition split process. Here is an example of splitting a partition using parallelism:
ALTER TABLE EMP

SPLIT PARTITION PMAX at ('2011-04-01') INTO

(PARTITION P4 TABLESPACE EMP_S,

PARTITION PMAX TABLESPACE EMP_S)

PARALLEL(DEGREE 4);
How It Works
Adding parallelism can speed up the process of splitting a partition with a large amount of data. Here is an example of a partition with over 16 million rows, and enabling parallelism for the split operation reduced the time of the split operation. First, the split was performed in parallel:
ALTER TABLE EMPPART SPLIT PARTITION emppart2000_p AT ('2000-01-01')

INTO (PARTITION emppart1990_p, PARTITION emppart2000_p)

PARALLEL(DEGREE 4);


Table altered.


Elapsed: 00:00:53.61
The same split was then performed on a similar table, to see the performance impact of doing the split serially:
ALTER TABLE EMPPART2 SPLIT PARTITION emppart2000_p AT ('2000-01-01')

INTO (PARTITION emppart1990_p, PARTITION emppart2000_p);


Table altered.


Elapsed: 00:01:05.36
Again, keep in mind that for parallel operations, an extent needs to be allocated for each parallel operation. For the foregoing partition split operation, the table that used parallelism has a significantly higher number of extents allocated:
SELECT segment_name, partition_name, extents

FROM dba_segments

WHERE segment_name LIKE '%EMP%'

AND owner = 'SCOTT'

ORDER BY 2,1;


SEGMENT_NAME         PARTITION_NAME       EXTENTS

-------------------- -------------------- ----------

EMPPART              EMPPART1990_P               335

EMPPART2             EMPPART1990_P               121

EMPPART              EMPPART2000_P               338

EMPPART2             EMPPART2000_P               125
15-10. Enabling Automatic Degree of Parallelism
Problem
You want to allow Oracle to automatically determine if a SQL statement should execute in parallel and what DOP it should use.
Solution
Set the PARALLEL_DEGREE_POLICY to AUTO to allow Oracle to determine whether a statement runs in parallel. You can set this either at the system level or session level. To set it for all SQL statements, run the following command:
alter system set parallel_degree_policy=auto scope=both;
To set it for a single SQL statement, you can alter your session to enable automatic DOP:
alter session set parallel_degree_policy=auto;
How It Works
By default, Oracle executes a statement in parallel only when the DOP is set for the table or the parallel hint is used. You can instruct Oracle to automatically consider using parallelism for a statement via the PARALLEL_DEGREE_POLICY initialization parameter. Oracle takes the following steps when a SQL statement is issued when PARALLEL_DEGREE_POLICY is set to AUTO:
- Statement is parsed.
- The
PARALLEL_MIN_TIME_THRESHOLDparameter is checked:- If execution time is less than the threshold set, then the statement runs without parallelism.
- If execution time is greater than the threshold set, then the statement runs in parallel depending on the automatic DOP that is calculated by the optimizer.
The PARALLEL_DEGREE_POLICY can be set to three different values: AUTO, LIMITED, and MANUAL. MANUAL is the default and turns off the automatic degree of parallelism. LIMITED instructs Oracle to use automatic DOP only on those objects with parallelism explicitly set. The AUTO setting gives Oracle full control over setting automatic DOP. One prerequisite of using automatic DOP is to run the DBMS_RESOURCE_MANAGER.CALIBRATE_IO procedure. This procedure needs to be run only once, and gathers information on the hardware characteristics of your system.
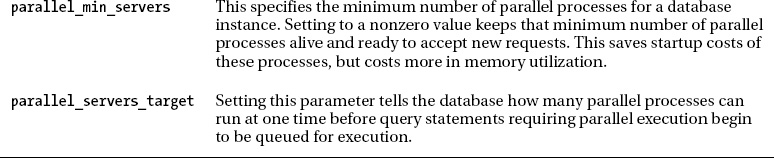
With automatic DOP, there is a shift away from downgrading parallel operations based on available parallel slaves, to use a new feature in Oracle 11g R2 called statement queuing. With statement queuing, statements will not be downgraded, and will always be run with the query's specified DOP. If there are not enough slaves to meet that DOP, the statement will be queued until that DOP is available. While it may appear that queuing could actually degrade the performance of queries in your database because some statements may have to wait for the specified DOP to be available, it is designed to improve the overall parallelism performance on the database, as running fewer statements with the specified DOP will outperform running more statements, some with a downgraded DOP. There are many other parameters that can be set related to parallelism. Table 15-3 lists other parallel parameters you may want to consider for your application.

15-11. Examining Parallel Explain Plans
Problem
You want to understand how to read parallel explain plans.
Solution
When reading your explain plan, interpret it from the innermost to outermost levels, and from the bottom going up. For instance, here again is our parallel execution plan from using a parallel hint against the EMP table:
select /*+ parallel(emp,4) */ * from emp;


----------------------------------------------------------------------

| Id  | Operation            | Name     |    TQ  |IN-OUT| PQ Distrib |

----------------------------------------------------------------------

|   0 | SELECT STATEMENT     |          |        |      |            |

|   1 |  PX COORDINATOR      |          |        |      |            |

|   2 |   PX SEND QC (RANDOM)| :TQ10000 |  Q1,00 | P->S | QC (RAND)  |

|   3 |    PX BLOCK ITERATOR |          |  Q1,00 | PCWC |            |

|   4 |     TABLE ACCESS FULL| EMP      |  Q1,00 | PCWP |            |

----------------------------------------------------------------------
Looking at the foregoing plan starting at the bottom, we are doing a full table scan of the EMP table. The PX BLOCK INTERATOR just above the table scan is responsible for taking that request for a full table scan, and breaking it up into chunks based on the DOP specified. The PX SEND processes pass the data to the consuming processes. Finally, the PX COORDINATOR is the process used by the query coordinator to receive the data from a given parallel process and return to the SELECT statement.
If you look at the IN-OUT column of your explain plan, you can see the execution flow of the operation, and determine if there are any bottlenecks, or any parts of the plan that are not parallelized, which may cause a decrease in the expected performance. As can be seen in Table 15-5, the operation that normally shows that there may be a bottleneck is the PARALLEL_FROM_SERIAL operation, because it means parallel processes are being spawned from a serial operation, which denotes an inefficiency in the process.
For instance, you have a series of employee tables by region of the country, and a user is performing a query to get information from several of these tables. However, the makeup of the query is such that a bottleneck occurs.
select /*+ parallel(emp_north,4) */ * from emp_north

union

select * from emp_south;


------------------------------------------------------------------------------------

| Id  | Operation                     | Name          |    TQ  |IN-OUT| PQ Distrib |

------------------------------------------------------------------------------------

|   0 | SELECT STATEMENT              |               |        |      |            |

|   1 |  PX COORDINATOR               |               |        |      |            |

|   2 |   PX SEND QC (RANDOM)         | :TQ10002      |  Q1,02 | P->S | QC (RAND)  |

|   3 |    SORT UNIQUE                |               |  Q1,02 | PCWP |            |

|   4 |     PX RECEIVE                |               |  Q1,02 | PCWP |            |

|   5 |      PX SEND HASH             | :TQ10001      |  Q1,01 | P->P | HASH       |

|   6 |       BUFFER SORT             |               |  Q1,01 | PCWP |            |

|   7 |        UNION-ALL              |               |  Q1,01 | PCWP |            |

|   8 |         PX BLOCK ITERATOR     |               |  Q1,01 | PCWC |            |

|   9 |          TABLE ACCESS FULL    | EMP_NORTH     |  Q1,01 | PCWP |            |

|  10 |         BUFFER SORT           |               |  Q1,01 | PCWC |            |

|  11 |          PX RECEIVE           |               |  Q1,01 | PCWP |            |

|  12 |           PX SEND ROUND-ROBIN | :TQ10000      |        | S->P |RND-ROBIN   |

|  13 |            TABLE ACCESS FULL  | EMP_SOUTH     |        |      |            |

------------------------------------------------------------------------------------
You can tell from the foregoing explain plan output that the PX SEND process is serial, and is sending data back to be fed into a parallel process. This represents a bottleneck in this query. If we change all aspects of the query to run in parallel, we see an improvement in the execution plan:
select /*+ parallel(emp_north,4) */ * from emp_north

union

select /*+ parallel(emp_south,4) */ * from emp_south;


-------------------------------------------------------------------------------

| Id  | Operation                | Name          |    TQ  |IN-OUT| PQ Distrib |

-------------------------------------------------------------------------------

|   0 | SELECT STATEMENT         |               |        |      |            |

|   1 |  PX COORDINATOR          |               |        |      |            |

|   2 |   PX SEND QC (RANDOM)    | :TQ10001      |  Q1,01 | P->S | QC (RAND)  |

|   3 |    SORT UNIQUE           |               |  Q1,01 | PCWP |            |

|   4 |     PX RECEIVE           |               |  Q1,01 | PCWP |            |

|   5 |      PX SEND HASH        | :TQ10000      |  Q1,00 | P->P | HASH       |

|   6 |       UNION-ALL          |               |  Q1,00 | PCWP |            |

|   7 |        PX BLOCK ITERATOR |               |  Q1,00 | PCWC |            |

|   8 |         TABLE ACCESS FULL| EMP_NORTH     |  Q1,00 | PCWP |            |

|   9 |        PX BLOCK ITERATOR |               |  Q1,00 | PCWC |            |

|  10 |         TABLE ACCESS FULL| EMP_SOUTH     |  Q1,00 | PCWP |            |

-------------------------------------------------------------------------------
How It Works
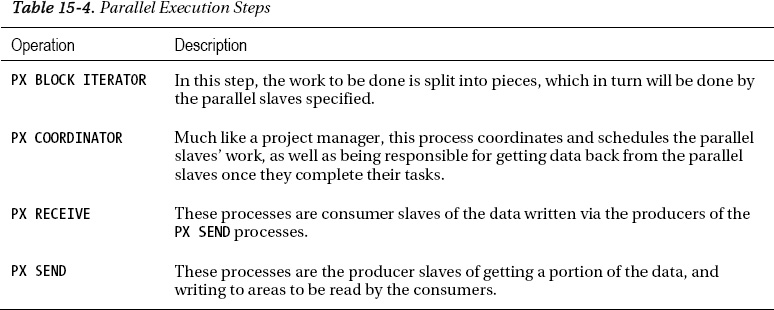
Tables 15-4 and 15-5 delineate the fundamental information that can be used to determine the execution plan for a parallel operation. In order to understand the basics of interpreting your explain plan output, you should be aware of two aspects:
- The possible parallel execution steps (Table 15-4)
- The parallel operations that occur within each step (Table 15-5)
The execution steps are the aspects of a parallelized plan, while the operations that occur within your parallel execution plan can help you determine if you have an optimized plan, or one that needs tuning and improvement.
As with non-parallel operations, the explain plan utility is a very useful tool in determining what the optimizer is planning to do to complete the task at hand. When executing operations in parallel, there are specific aspects of the explain plan related to parallelism. These are important to understand, so you can determine if the operation is running as optimized as possible. One of the key aspects of analyzing a parallel explain plan is to determine if there are any aspects of the plan that are being run serially, as this bottleneck can reduce the overall performance of a given operation. That it is why it is critical to understand aspects of the explain plan that relate to parallel operations, with the end goal being that all aspects of the operation are parallelized.

15-12. Monitoring Parallel Operations
Problem
You want to quickly get information regarding the performance of your parallel operations from the database.
Solution
If you look at the V$SYSSTAT view, which gives information on system-level statistics in your database, including parallelism-related statistics, you can see, at a quick glance, if the DOP requested was actually used, and if any of those operations were downgraded:
SELECT name , value

FROM v$sysstat

WHERE name LIKE '%Parallel%';
---------------------------------------------------------------- ----------

Parallel operations not downgraded                                    10331

Parallel operations downgraded to serial                                  0

Parallel operations downgraded 75 to 99 pct                               0

Parallel operations downgraded 50 to 75 pct                               0

Parallel operations downgraded 25 to 50 pct                               0

Parallel operations downgraded 1 to 25 pct                                1


6 rows selected.
If you look at the V$PQ_SYSSTAT view, you can see parallel slave activity on your database. From looking at these statistics, you can quickly see if parallelism is properly configured on your database, just by looking at the parallel slave activity. For instance, if you see that the Servers Shutdown and Servers Started values are high, it can be an indication that the PARALLEL_MIN_SERVERS parameter is set too low, as there is overhead occurring to consistently start and stop parallel processes.
SELECT * FROM v$pq_sysstat

WHERE statistic LIKE 'Server%';


STATISTIC                           VALUE

------------------------------ ----------

Servers Busy                            0

Servers Idle                            0

Servers Highwater                       4

Server Sessions                         8

Servers Started                         4

Servers Shutdown                        4

Servers Cleaned Up                      0


7 rows selected.
If you are looking for session-level statistics regarding a parallel operation, looking at the V$PQ_TQSTAT view is very useful in determining exactly how the work was split up among the parallel slaves, as well as giving you information about the actual DOP used based on the information within V$PQ_TQSTAT. Let's rerun our parallel query against the EMP table with a hint specifying a DOP of 4.
SELECT /*+ parallel(emp,4) */ * FROM emp;
After completion of the query, but also within the same session, we can query the V$PQ_TQSTAT to get information about the parallel operations used for that query:
SELECT dfo_number, tq_id, server_type, process, num_rows, bytes

FROM v$pq_tqstat

ORDER BY dfo_number DESC, tq_id, server_type DESC , process;


DFO_NUMBER      TQ_ID SERVER_TYP PROCESS      NUM_ROWS      BYTES

---------- ---------- ---------- ---------- ---------- ----------

         1          0 Producer   P000           298629   13211118

         1          0 Producer   P001           302470   13372088

         1          0 Producer   P002           315956   13978646

         1          0 Producer   P003           317512   14052340

         1          0 Consumer   QC            1234567   54614192
We can see that between the four producer parallel slaves, the work was divided fairly evenly between them. We can also validate that the actual DOP used for this query was 4, as specified in the query hint.
How It Works
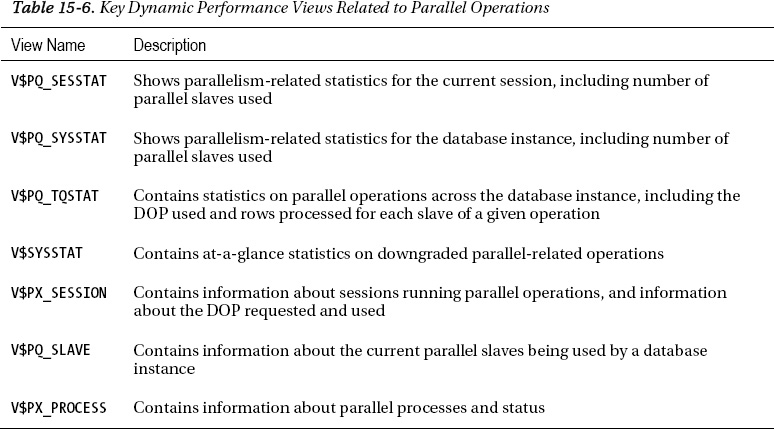
One of the quickest methods to analyze performance of parallel operations within your database is to analyze the dynamic performance views. These views give you a glimpse of how parallelism is performing overall within your database, which can indicate how well-tuned or badly tuned your database is for parallelism. It can also give you very session-specific details, such as how the work was split up between slaves, and information on the actual DOP used for a given operation. Table 15-6 gives you an overview of the parallelism-related dynamic performance views.
15-13. Finding Bottlenecks in Parallel Processes
Problem
You have some parallel processes that are underperforming, and you want to do analysis to find the bottlenecks.
Solution
There are many wait events related to parallelism. Many of these events are considered “idle” wait events—that is, they don't usually indicate a problem. If you query the V$SYSTEM_EVENT view, you can get an idea of the parallelism-related waits that have occurred in your database instance. The following query results show some of the common wait events that can occur:
SELECT event, wait_class, total_waits

FROM v$session_event

WHERE event LIKE 'PX%';


EVENT                        WAIT_CLASS   TOTAL_WAITS

---------------------------- ------------ -----------

PX Deq Credit: need buffer   Idle             6667936

PX Deq Credit: send blkd     Other            8161247

PX Deq: Execute Reply        Idle              490827

PX Deq: Execution Msg        Idle              685175

PX Deq: Join ACK             Idle               26312

PX Deq: Msg Fragment         Idle                  67

PX Deq: Parse Reply          Idle               20891

PX Deq: Signal ACK           Other              25729

PX Deq: Table Q Get Keys     Other               3141

PX Deq: Table Q Normal       Idle            25120970

PX Deq: Table Q Sample       Idle               11124

PX Deq: Table Q qref         Other            1705216

PX Idle Wait                 Idle              241116

PX qref latch                Other            1208472
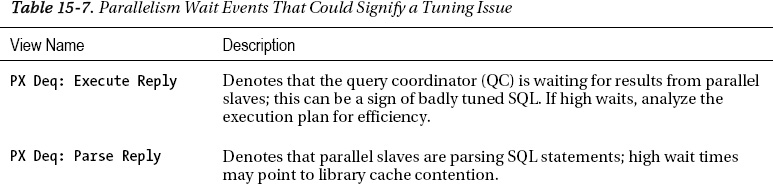
How It Works
Table 15-7 describes some of the key parallelism-related wait events. If you are having significant performance issues, it may be worthwhile to browse these wait events to see if you have excessive waits or wait times. If so, it may indicate an issue with the processing occurring with the parallel slaves. Again, events that are “idle” generally do not indicate a problem.

15-14. Getting Detailed Information on Parallel Sessions
Problem
You have some underperforming parallel processes, and need more detailed information on the sessions.
Solution
By turning on session tracing, you can get detailed trace information on your parallel sessions. This is essentially a four-step process:
- Set the event in your session.
- Execute your SQL statement.
- Turn off your session tracing.
- Analyze your trace file output.
For example, you are again executing a parallel query against our EMP table. In order to gather trace information, you would do the following:
alter session set events '10391 trace name context forever, level 128';


select /*+ parallel(emp,4) */ * from emp;


alter session set events '10391 trace name context off';
Then, within the trace file, you can analyze the parallel-related information, such as the following:
kxfrDmpUpdSys

        allocated slave set: nsset:1 nbslv:4

          Slave set 0: #nodes:1

          Min # slaves 4: Max # slaves:4

            List of Slaves:

              slv 0 nid:0

              slv 1 nid:0

              slv 2 nid:0

              slv 3 nid:0

            List of Nodes:

              node 0
How It Works
As with other session tracing, the trace file can be found in the destination specified under the user_dump_dest parameter. The trace file shows granular information for the parallel processes. If you are experiencing significant performance issues with parallelism, and you wish to delve further into investigating the results of the trace files generated by this event, it may be beneficial to simply create a service request with Oracle in order to get the most detailed information. Reading and understanding these trace files can be difficult and cumbersome, and it may be more expedient to simply send the files to Oracle support for analysis. Yet another way to validate the DOP used for a parallel operation is to use the _px_trace facility, which also generates a trace file:
alter session set "_px_trace"="compilation","execution","messaging";


select /*+ parallel(emp,4) */ * from emp;
Then, within the trace file, you can evaluate the DOP requested and used:
kkscscid_pdm_eval

        pdml_allowed=0, cursorPdmlMode=0,                sessPdmlMode=0

        select /*+ parallel(emp,4) */ * from emp


kxfrDefaultDOP

        DOP Trace -- compute default DOP

            # CPU       = 2

            Threads/CPU = 2 ("parallel_threads_per_cpu")

            default DOP = 4 (# CPU * Threads/CPU)


kxfpAdaptDOP

        Requested=4 Granted=4 Target=8 Load=2 Default=4 users=0 sets=1

        load adapt num servers requested to = 4 (from kxfpAdaptDOP())