
C H A P T E R 11
Automated SQL Tuning
Prior to Oracle Database 11g, accurately identifying poorly performing SQL queries and recommending solutions was mainly the purview of veteran SQL tuners. Typically one had to know how to identify high-resource SQL statements and bottlenecks, generate and interpret execution plans, extract data from the dynamic performance views, understand wait events and statistics, and then collate this knowledge to produce good SQL queries. As you'll see in this chapter, the Oracle SQL tuning paradigm has shifted a bit.
With the advent of automated SQL tuning features, anybody from novice to expert can generate and recommend solutions for SQL performance problems. This opens the door for new ways to address problematic SQL. For example, imagine your boss coming to you each morning with tuning recommendations and asking what the plan is to implement enhancements. This is different.
The automated SQL tuning feature is not a panacea for SQL performance angst. If you are an expert SQL tuner, there's no need to fear your skills are obsolete or your job is lost. There will always be a need to verify recommendations and successfully implement solutions. A human is still required to review the automated SQL tuning output and confirm the worthiness of fixes.
Still, there's been a change in the way SQL performance problems can be identified and solutions can be recommended. Some old-school folks may disagree and argue that you can't allow just anybody to generate SQL tuning advice. Regardless, Oracle has made these automated tools accessible and usable by the general population (for a fee). Therefore you need to understand the underpinnings of these features and how to use them.
This chapter focuses on the following automated SQL tuning tools:
- Automatic SQL Tuning
- SQL tuning sets (STS)
- SQL Tuning Advisor
- Automatic Database Diagnostic Monitor (ADDM)
Starting with Oracle Database 11g, Automatic SQL Tuning is a preset background database job that by default runs every day. This task examines high resource-consuming statements in the Automatic Workload Repository (AWR). It then invokes the SQL Tuning Advisor and generates tuning advice (if any) for each statement analyzed. As part of automated SQL tuning, you can configure characteristics such as the automatic acceptance of some recommendations such as SQL profiles (see Chapter 12 for details on SQL profiles).
A SQL tuning set (STS) is a database object that contains one or more SQL statements and the associated execution statistics. You can populate a SQL tuning set from multiple sources, such as SQL recorded in the AWR and SQL in memory, or you can provide specific SQL statements. It's critical that you be familiar with SQL tuning sets. This feature is used as an input to several of Oracle's performance tuning and management tools, such as the SQL Tuning Advisor, SQL Plan Management, SQL Access Advisor, and SQL Performance Advisor.
The SQL Tuning Advisor is central to Oracle's Automatic SQL Tuning feature. This tool runs automatically on a periodic basis and generates tuning advice for high resource-consuming SQL statements found in the AWR. You can also run the SQL Tuning Advisor manually and provide as input specific snapshot periods in the AWR, high resource-consuming SQL in memory, or user-provided SQL statements. This tool can be invoked via the DBMS_SQLTUNE package, SQL Developer, or Enterprise Manager.
The Automatic Database Diagnostic Monitor (ADDM) analyzes information in the AWR and provides recommendations on database performance issues including high resource-consuming SQL statements. The main goal of ADDM is to help you reduce the overall time (the DB time metric) spent by the database processing user requests. This tool can be invoked from an Oracle-provided SQL script, the DBMS_ADDM package, or Enterprise Manager.
All of the prior listed tools require an extra license from Oracle. You may not have a license to run these tools. Even if you don't have one, we still recommend that you know how these tools function. For example, you might have a manager asking if these automated tools are worth the cost, or you might be working with a developer who is investigating the use of these tools in a test environment. As a SQL tuning guru, you need to be familiar with these tools, as you will sooner or later encounter these automated features.
Before investigating the recipes in this chapter, please take a long look at Figure 11-1. This diagram demonstrates how the various automated tools interact and in what scenarios you would use a particular feature. Refer back to this diagram as you work through the recipes in this chapter. Particularly notice that you can easily use SQL statements found in the AWR or SQL currently in memory as input for various Oracle tuning tools. This allows you to systematically identify and use high-resource SQL statements as the target for various performance tuning activities.
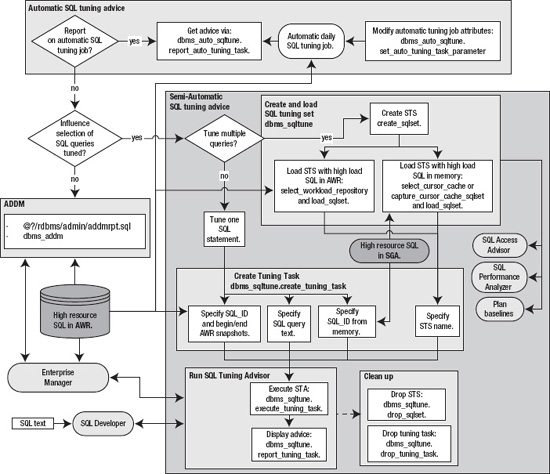
Figure 11-1. Oracle's automatic SQL tuning tools
The first several recipes in this chapter deal with the Automatic SQL Tuning feature. You'll be shown how to determine if and when the automated job is running and how to modify its characteristics. The middle section of this chapter focuses on how to create and manage SQL tuning sets. SQL tuning sets are used widely as input to various Oracle performance tuning tools. Lastly, the chapter shows you how to manually run the SQL Tuning Advisor and ADDM to generate performance recommendations for SQL statements.
![]() Note In the examples in this chapter, we focus on showing you how to use features via SQL and built-in PL/SQL packages. While we do show some screenshots from Enterprise Manager, we don't focus on the graphical tool usage. You should be able to use the SQL and PL/SQL regardless of whether Enterprise Manager is installed. Furthermore, the manual approach allows you to understand each piece of the process and will help you to diagnose issues when problems arise.
Note In the examples in this chapter, we focus on showing you how to use features via SQL and built-in PL/SQL packages. While we do show some screenshots from Enterprise Manager, we don't focus on the graphical tool usage. You should be able to use the SQL and PL/SQL regardless of whether Enterprise Manager is installed. Furthermore, the manual approach allows you to understand each piece of the process and will help you to diagnose issues when problems arise.
11-1. Displaying Automatic SQL Tuning Job Details
Problem
You have an Oracle Database 11g environment and want to determine if the Automatic SQL Tuning job is enabled and regularly running. If the job is enabled, you want to display other aspects, such as when it starts and how long it executes.
Solution
Use the following query to determine if any Automatic SQL Tuning jobs are enabled:
SELECT client_name, status, consumer_group, window_group

FROM dba_autotask_client

ORDER BY client_name;
The following output shows that there are three enabled automatic jobs running, one of which is the SQL Tuning Advisor:
CLIENT_NAME                     STATUS   CONSUMER_GROUP            WINDOW_GROUP

------------------------------- -------- ------------------------- --------------------

sql tuning advisor              ENABLED  ORA$AUTOTASK_SQL_GROUP    ORA$AT_WGRP_SQ

auto space advisor              ENABLED  ORA$AUTOTASK_SPACE_GROUP  ORA$AT_WGRP_SA

auto optimizer stats collection ENABLED  ORA$AUTOTASK_STATS_GROUP  ORA$AT_WGRP_OS
Run the following query to view the last several times the Automatic SQL Tuning Advisor job has run:
SELECT task_name, status, TO_CHAR(execution_end,'DD-MON-YY HH24:MI')

FROM dba_advisor_executions

WHERE task_name='SYS_AUTO_SQL_TUNING_TASK'

ORDER BY execution_end;
Here is some sample output:
TASK_NAME                      STATUS     TO_CHAR(EXECUTION_END

------------------------------ ---------- ---------------------

SYS_AUTO_SQL_TUNING_TASK       COMPLETED   30-APR-11 06:00

SYS_AUTO_SQL_TUNING_TASK       COMPLETED   01-MAY-11 06:02
How It Works
When you create a database in Oracle Database 11g or higher, Oracle automatically implements three automatic maintenance jobs:
- Automatic SQL Tuning Advisor
- Automatic Segment Advisor
- Automatic Optimizer Statistics Collection
These tasks are automatically configured to run in maintenance windows. A maintenance window is a specified time and duration for the task to run. You can view the maintenance window details with this query:
SELECT window_name,TO_CHAR(window_next_time,'DD-MON-YY HH24:MI:SS')

,sql_tune_advisor, optimizer_stats, segment_advisor

FROM dba_autotask_window_clients;
Here's a snippet of the output for this example:
WINDOW_NAME      TO_CHAR(WINDOW_NEXT_TIME SQL_TUNE OPTIMIZE SEGMENT_

---------------- ------------------------ -------- -------- --------

THURSDAY_WINDOW  28-APR-11 22:00:00       ENABLED  ENABLED  ENABLED

FRIDAY_WINDOW    29-APR-11 22:00:00       ENABLED  ENABLED  ENABLED

SATURDAY_WINDOW  30-APR-11 06:00:00       ENABLED  ENABLED  ENABLED

SUNDAY_WINDOW    01-MAY-11 06:00:00       ENABLED  ENABLED  ENABLED
There are several data dictionary views related to the automatically scheduled jobs. See Table 11-1 for descriptions of these views.

11-2. Displaying Automatic SQL Tuning Advice
Problem
You're aware that Oracle automatically runs a daily job that generates SQL tuning advice. You want to view the advice.
Solution
If you're using Oracle Database 11g Release 2 or higher, here's the quickest way to display automatically generated SQL tuning advice:
SQL> SET LINESIZE 80 PAGESIZE 0 LONG 100000

SQL> SELECT DBMS_AUTO_SQLTUNE.REPORT_AUTO_TUNING_TASK FROM DUAL;
![]() Note Starting with Oracle Database 11g Release 2, the
Note Starting with Oracle Database 11g Release 2, the DBMS_AUTO_SQLTUNE package should be used (instead of DBMS_SQLTUNE) for administrating automatic SQL tuning features. If you are using an older release of Oracle, use DBMS_SQLTUNE.REPORT_AUTO_TUNING_TASK to view automated SQL tuning advice.
Depending on the activity in your database, there may be a great deal of output. Here's a small sample of output from a very active database:
GENERAL INFORMATION SECTION

-------------------------------------------------------------------------------

Tuning Task Name                        : SYS_AUTO_SQL_TUNING_TASK

Tuning Task Owner                       : SYS

Workload Type                           : Automatic High-Load SQL Workload

Execution Count                         : 30

Current Execution                       : EXEC_3483

Execution Type                          : TUNE SQL

Scope                                   : COMPREHENSIVE

.....

Completion Status                       : COMPLETED

Started at                              : 04/10/2011 06:00:01

Completed at                            : 04/10/2011 06:02:41

Number of Candidate SQLs                : 103

Cumulative Elapsed Time of SQL (s)      : 49124

-------------------------------------------------------------------------------
SUMMARY SECTION

-------------------------------------------------------------------------------

                      Global SQL Tuning Result Statistics

-------------------------------------------------------------------------------

Number of SQLs Analyzed                      : 103

Number of SQLs in the Report                 : 8

Number of SQLs with Findings                 : 8

Number of SQLs with Alternative Plan Findings: 1

Number of SQLs with SQL profiles recommended : 1

-------------------------------------------------------------------------------

    SQLs with Findings Ordered by Maximum (Profile/Index) Benefit, Object ID

-------------------------------------------------------------------------------

object ID  SQL ID        statistics profile(benefit) index(benefit) restructure

---------- ------------- ---------- ---------------- -------------- -----------

      9130 crx9h7tmwwv67                      51.44%
AUTOMATICALLY E-MAILING SQL OUTPUT
How It Works
The “Solution” section describes a simple method to display in-depth tuning advice for high-load queries in your database. Depending on the activity and load on your database, the report may contain no suggestions or may provide a great deal of advice. The Automatic SQL Tuning job uses the high-workload SQL statements identified in the AWR as the target SQL statements to report on. The advice report consists of one or more of the following general subsections:
- General information
- Summary
- Details
- Findings
- Explain plans
- Alternate plans
- Errors
The general information section contains high-level information regarding the start and end time, number of SQL statements considered, cumulative elapsed time of the SQL statements, and so on.
The summary section contains information regarding the SQL statements analyzed—for example:
                      Global SQL Tuning Result Statistics

-------------------------------------------------------------------------------

Number of SQLs Analyzed                      : 26

Number of SQLs in the Report                 : 5

Number of SQLs with Findings                 : 5

Number of SQLs with Alternative Plan Findings: 1

Number of SQLs with SQL profiles recommended : 5

Number of SQLs with Index Findings           : 2

-------------------------------------------------------------------------------

    SQLs with Findings Ordered by Maximum (Profile/Index) Benefit, Object ID

-------------------------------------------------------------------------------

object ID  SQL ID        statistics profile(benefit) index(benefit) restructure

---------- ------------- ---------- ---------------- -------------- -----------

      1160 31q9w59vpt86t                      98.27%         99.90%

      1167 3u8xd0vf2pnhr                      98.64%
The detail section contains information describing specific SQL statements, such as the owner and SQL text. Here is a small sample:
DETAILS SECTION

-------------------------------------------------------------------------------

Statements with Results Ordered by Maximum (Profile/Index) Benefit, Object ID

-------------------------------------------------------------------------------

Object ID  : 1160

Schema Name: CHN_READ

SQL ID     : 31q9w59vpt86t

SQL Text   : SELECT "A2"."UMID","A2"."ORACLE_UNIQUE_ID","A2"."PUBLIC_KEY","A2"

             ."SERIAL_NUMBER",:1||"A1"."USER_NAME","A1"."USER_NAME",NVL("A2"."

             CREATE_TIME_DTT",:2),NVL("A2"."UPDATE_TIME_DTT",:3) FROM

             "COMPUTER_SYSTEM" "A2","USERS" "A1" WHERE
The findings section contains recommendations such as accepting a SQL profile or creating an index—for example:
FINDINGS SECTION

-------------------------------------------------------------------------------

1- SQL Profile Finding (see explain plans section below)

--------------------------------------------------------

  A potentially better execution plan was found for this statement.

  Recommendation (estimated benefit: 98.27%)

  ------------------------------------------

  - Consider accepting the recommended SQL profile to use

parallel execution for this statement.

    execute dbms_sqltune.accept_sql_profile(task_name =>

            'SYS_AUTO_SQL_TUNING_TASK', object_id => 1160, task_owner =>

            'SYS', replace => TRUE, profile_type => DBMS_SQLTUNE.PX_PROFILE);

.................

2- Index Finding (see explain plans section below)

-------------------------------------------------

The execution plan of this statement can be improved by creating

one or more indices.

  Recommendation (estimated benefit: 99.9%)

  -----------------------------------------

  - Consider running the Access Advisor to improve the physical schema design

    or creating the recommended index.

    create index CHAINSAW.IDX$$_90890002 on

    CHAINSAW.COMPUTER_SYSTEM("UPDATE_TIME_DTT");
Where appropriate, the original execution plan for a query is displayed along with a suggested fix and new execution plan. This allows you to see the before and after plan differences. This is very useful when determining if the findings (such as adding an index) would improve performance.
Lastly, there is an error section of the report. For most scenarios, there typically will not be an error section in the report.
The “Solution” section showed how to execute the REPORT_AUTO_TUNING_TASK function from a SQL statement. This function can also be called from an anonymous block of PL/SQL. Here's an example:
VARIABLE tune_report CLOB;

BEGIN

  :tune_report := DBMS_AUTO_SQLTUNE.report_auto_tuning_task(

    begin_exec   => NULL

   ,end_exec     => NULL

   ,type         => DBMS_AUTO_SQLTUNE.type_text
   ,level        => DBMS_AUTO_SQLTUNE.level_typical

   ,section      => DBMS_AUTO_SQLTUNE.section_all

   ,object_id    => NULL

   ,result_limit => NULL);

END;

/

--

SET LONG 1000000

PRINT :tune_report
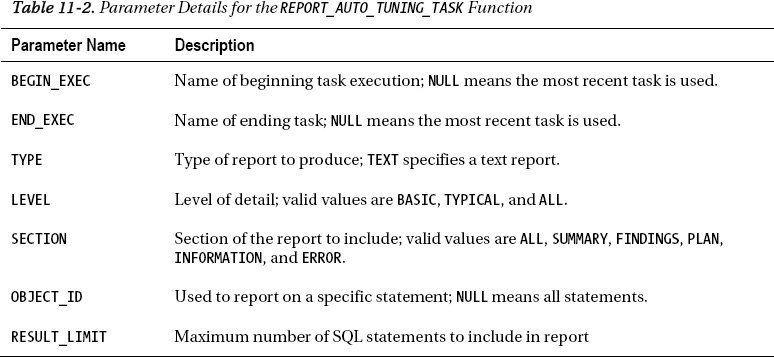
The parameters for the REPORT_AUTO_TUNING_TASK function are described in detail in Table 11-2. These parameters allow you a great deal of flexibility to customize the advice output.
11-3. Generating a SQL Script to Implement Automatic Tuning Advice
Problem
You've reported on the automatic tuning advice. Now you want to generate a SQL script that can be used to implement tuning advice.
Solution
Use the DBMS_SQLTUNE.SCRIPT_TUNING_TASK function to generate the SQL statements to implement the advice of a tuning task. You need to provide as input the name of the automatic tuning task. In this example, the name of the task is SYS_AUTO_SQL_TUNING_TASK:
SET LINES 132 PAGESIZE 0 LONG 10000

SELECT DBMS_SQLTUNE.SCRIPT_TUNING_TASK('SYS_AUTO_SQL_TUNING_TASK') FROM dual;
Here is a small snippet of the output for this example:
execute dbms_stats.gather_index_stats(ownname => 'STAR2', indname => 'F_CONFIG_P

ROD_INST_FK1', estimate_percent => DBMS_STATS.AUTO_SAMPLE_SIZE);

create index NSESTAR.IDX$$_17F5F0004 on NSESTAR.D_DATES("FISCAL_YEAR","FISCAL_WE

EK_NUMBER_IN_YEAR","DATE_DTT");
How It Works
The SCRIPT_TUNING_TASK function generates the SQL to implement the advice recommended by the Automatic SQL Tuning job. If the tuning task doesn't have any advice to give, then there won't be any SQL statements generated in the output. SYS_AUTO_SQL_TUNING_TASK is the default name of the Automatic SQL Tuning task. If you're unsure of the details regarding this task, then query the DBA_ADVISOR_LOG view:
select task_name, execution_start from dba_advisor_log

where task_name='SYS_AUTO_SQL_TUNING_TASK'

order by 2;
Here's some sample output for this example:
TASK_NAME                      EXECUTION

------------------------------ ---------

SYS_AUTO_SQL_TUNING_TASK       19-APR-11
11-4. Modifying Automatic SQL Tuning Features
Problem
You've noticed that sometimes the Automatic SQL Tuning advice job recommends that a SQL profile be applied to a SQL statement (see Chapter 12 for details on SQL profiles). The default behavior of the tuning advice job is to not automatically accept SQL profile recommendations. You want to modify this behavior and have the Automatic SQL Tuning job automatically place any SQL profiles that it recommends into an accepted state.
Solution
Use the DBMS_AUTO_SQLTUNE.SET_AUTO_TUNING_TASK_PARAMETER procedure to modify the default behavior of Automatic SQL Tuning. For example, if you want SQL profiles to be automatically accepted, you can do so as follows:
BEGIN

  DBMS_AUTO_SQLTUNE.SET_AUTO_TUNING_TASK_PARAMETER(

    parameter => 'ACCEPT_SQL_PROFILES', value => 'TRUE'),

END;

/
You can verify that auto SQL profile accepting is enabled via this query:
SELECT parameter_name, parameter_value

FROM dba_advisor_parameters

WHERE task_name = 'SYS_AUTO_SQL_TUNING_TASK'

AND  parameter_name ='ACCEPT_SQL_PROFILES';
Here is some sample output:
PARAMETER_NAME                 PARAMETER_VALUE

------------------------------ ------------------------------

ACCEPT_SQL_PROFILES            TRUE
To disable automatic acceptance of SQL profiles, pass a FALSE value to the procedure:
BEGIN

  DBMS_AUTO_SQLTUNE.SET_AUTO_TUNING_TASK_PARAMETER(

    parameter => 'ACCEPT_SQL_PROFILES', value => 'FALSE'),

END;

/
![]() Note Starting with Oracle Database 11g Release 2, the
Note Starting with Oracle Database 11g Release 2, the DBMS_AUTO_SQLTUNE package should be used (instead of DBMS_SQLTUNE) for administrating Automatic SQL Tuning features.
How It Works
The DBMS_AUTO_SQLTUNE.SET_AUTO_TUNING_TASK_PARAMETER procedure allows you to modify the default behavior of the Automatic SQL Tuning job. You can view all of the current settings for Automatic SQL Tuning via this query:
SELECT parameter_name ,parameter_value

FROM dba_advisor_parameters

WHERE task_name = 'SYS_AUTO_SQL_TUNING_TASK'

AND  parameter_name IN ('ACCEPT_SQL_PROFILES',

                        'MAX_SQL_PROFILES_PER_EXEC',

                        'MAX_AUTO_SQL_PROFILES',

                        'EXECUTION_DAYS_TO_EXPIRE'),
Here's some sample output:
PARAMETER_NAME                 PARAMETER_VALUE

------------------------------ ------------------------------

ACCEPT_SQL_PROFILES            FALSE

EXECUTION_DAYS_TO_EXPIRE       30
MAX_SQL_PROFILES_PER_EXEC      20

MAX_AUTO_SQL_PROFILES          10000
The prior parameters are described in Table 11-3.

You can also use Enterprise Manager to manage the features regarding Automatic SQL Tuning. From the main database page, navigate to the Advisor Central page. Next, click the SQL Advisors link. Now click the Automatic SQL Tuning Results page. You should be presented with a screen similar to Figure 11-2.
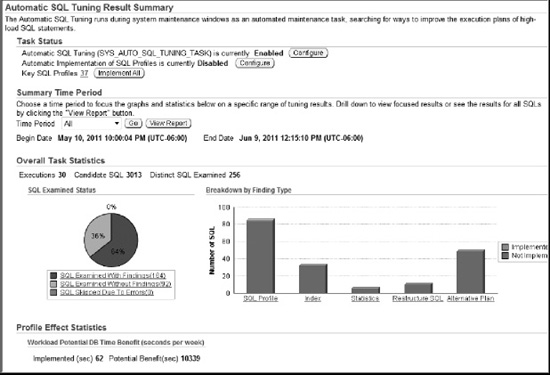
Figure 11-2. Managing Automatic SQL Tuning with Enterprise Manager
From this screen, you can configure, view results, disable, and enable various aspects of Automatic SQL Tuning.
11-5. Disabling and Enabling Automatic SQL Tuning
Problem
You want to completely disable and later re-enable the Automatic SQL Tuning job.
Solution
Use the DBMS_AUTO_TASK_ADMIN.DISABLE procedure to disable the Automatic SQL Tuning job. This example disables the Automatic SQL Tuning Advisor job.
BEGIN

  DBMS_AUTO_TASK_ADMIN.DISABLE(

  client_name => 'sql tuning advisor',

  operation => NULL,

  window_name => NULL);

END;

/
To re-enable the job, use the ENABLE procedure as shown:
BEGIN

  DBMS_AUTO_TASK_ADMIN.ENABLE(

  client_name => 'sql tuning advisor',

  operation => NULL,

  window_name => NULL);

END;

/
You can report on the status of the automatic tuning job via this query:
SELECT client_name ,status ,consumer_group

FROM dba_autotask_client

ORDER BY client_name;
Here's some sample output:
CLIENT_NAME                      STATUS          CONSUMER_GROUP

-------------------------------- --------------- ------------------------------

auto optimizer stats collection  ENABLED         ORA$AUTOTASK_STATS_GROUP

auto space advisor               ENABLED         ORA$AUTOTASK_SPACE_GROUP

sql tuning advisor               ENABLED         ORA$AUTOTASK_SQL_GROUP
How It Works
You might want to disable the Automatic SQL Tuning job because you have a very active database and want to ensure that this job doesn't impact the overall performance of the database. The DBMS_AUTO_
TASK_ADMIN.ENABLE/DISABLE procedures allow you to turn on and off the Automatic SQL Tuning job. These procedures take three parameters (see Table 11-4 for details). The behavior of the procedures varies depending on which parameters you pass in:
- If
CLIENT_NAMEis provided and bothOPERATIONandWINDOW_NAMEareNULL, then the client is disabled. - If
OPERATIONis provided, then the operation is disabled. - If
WINDOW_NAMEis provided, andOPERATIONisNULL, then the client is disabled in the provided window name.
The prior parameters allow you to control at a granular detail the schedule of the automatic task. Given the prior rules, you would disable the Automatic SQL Tuning job during the Tuesday maintenance window as follows:
BEGIN

  dbms_auto_task_admin.disable(

  client_name => 'sql tuning advisor',

  operation => NULL,

  window_name => 'TUESDAY_WINDOW'),

END;

/
You can verify that the window has been disabled via this query:
SELECT window_name,TO_CHAR(window_next_time,'DD-MON-YY HH24:MI:SS')

,sql_tune_advisor

FROM dba_autotask_window_clients;
Here is a snippet of the output:
WINDOW_NAME      TO_CHAR(WINDOW_NEXT_TIME SQL_TUNE

---------------- ------------------------ --------

TUESDAY_WINDOW   03-MAY-11 22:00:00       DISABLED

11-6. Modifying Maintenance Window Attributes
Problem
You realize that the automatic tasks (such as the Automatic SQL Tuning job) run during regularly scheduled maintenance windows. You want to modify the length of time associated with a maintenance window.
Solution
Here's an example that changes the duration of the Sunday maintenance window to two hours:
BEGIN

  dbms_scheduler.set_attribute(

  name => 'SUNDAY_WINDOW',

  attribute => 'DURATION',

  value => numtodsinterval(2, 'hour'));

END;

/
You can confirm the changes to the maintenance window with this query:
SELECT window_name, next_start_date, duration

FROM dba_scheduler_windows;
Here is a snippet of the output:
WINDOW_NAME      NEXT_START_DATE                          DURATION

---------------- ---------------------------------------- --------------------

SATURDAY_WINDOW  07-MAY-11 06.00.00.000000 AM US/MOUNTAIN +000 20:00:00

SUNDAY_WINDOW    08-MAY-11 06.00.00.000000 AM US/MOUNTAIN +000 02:00:00
How It Works
The key to understanding how to modify a maintenance window is that it is an attribute of the database job scheduler and therefore must be maintained via the DBMS_SCHEDULER package. When you install Oracle Database 11g, by default three automatic maintenance jobs are configured:
- Automatic SQL Tuning
- Statistics gathering
- Segment advice
These jobs automatically execute in preconfigured daily maintenance windows. A maintenance window consists of a day of the week and the length of time the job runs.
You can view the future one month's worth of scheduled jobs via this query:
SELECT window_name, to_char(start_time,'dd-mon-yy hh24:mi'), duration

FROM dba_autotask_schedule

ORDER BY start_time;
Here is a small sample of the output:
WINDOW_NAME          TO_CHAR(START_TIME,'D DURATION

-------------------- --------------------- --------------------

SATURDAY_WINDOW      14-may-11 06:00       +000 20:00:00

SUNDAY_WINDOW        15-may-11 06:00       +000 02:00:00
![]() Tip See Oracle's Database Administrator's Guide (available on the Oracle Technology Network web site) for further details on managing scheduled jobs.
Tip See Oracle's Database Administrator's Guide (available on the Oracle Technology Network web site) for further details on managing scheduled jobs.
11-7. Creating a SQL Tuning Set Object
Problem
You're working on a performance issue that requires that you analyze a group of SQL statements. Before you process the SQL statements as a set, you need to create a SQL tuning set object.
Solution
Use the DBMS_SQLTUNE.CREATE_SQLSET procedure to create a SQL tuning set object—for example:
BEGIN

  DBMS_SQLTUNE.CREATE_SQLSET(

  sqlset_name => 'HIGH_IO',

  description => 'High disk read tuning set'),

END;

/
The prior code creates a tuning set with the name of HIGH_IO. At this point, you have created a named tuning set object. The tuning set does not contain any SQL statements.
How It Works
A SQL tuning set object must be created before populating a tuning set with SQL statements (see Recipes 11-9 through 11-11 for details on adding SQL statements to an STS). You can view any defined SQL tuning sets in the database by querying the DBA_SQLSET view:
SQL> select id, name, created, statement_count from dba_sqlset;
Here is some sample output:
        ID NAME                           CREATED   STATEMENT_COUNT

---------- ------------------------------ --------- ---------------

         5 HIGH_IO                        26-APR-11               0
If you need to drop a SQL tuning set object, then use the DBMS_SQLTUNE.DROP_SQLSET procedure to drop a tuning set. The following example drops a tuning set named MY_TUNING_SET:
SQL> EXEC DBMS_SQLTUNE.DROP_SQLSET(sqlset_name => 'MY_TUNING_SET' );
11-8. Viewing Resource-Intensive SQL in the AWR
Problem
Before populating a SQL tuning set, you want to view high-load SQL statements in the AWR. You want to eventually use SQL contained in the AWR as input for populating a SQL tuning set.
Solution
The DBMS_SQLTUNE.SELECT_WORKLOAD_REPOSITORY function can be used to extract SQL stored in the AWR. This particular query selects queries in the AWR between snapshots 8200 and 8201 ordered by the top 10 in the disk reads usage category:
SELECT

sql_id

,substr(sql_text,1,20)

,disk_reads

,cpu_time

,elapsed_time

FROM table(DBMS_SQLTUNE.SELECT_WORKLOAD_REPOSITORY(8200,8201,

            null, null, 'disk_reads',null, null, null, 10))

ORDER BY disk_reads DESC;
Here is a small snippet of the output:
SQL_ID         SUBSTR(SQL_TEXT,1,20 DISK_READS      CPU_TIME  ELAPSED_TIME

-------------- -------------------- ---------- ------------- -------------

achffburdff9j   delete from "MVS"."     101145     814310000     991574249

5vku5ap6g6zh8  INSERT /*+ BYPASS_RE      98172      75350000      91527239
How It Works
Before you work with SQL tuning sets, it's critical to understand you can use the DBMS_SQLTUNE.SELECT_WORKLOAD_REPOSITORY function to retrieve high resource-usage SQL from the AWR. The result sets retrieved by this PL/SQL function can be used as input for populating SQL tuning sets. See Table 11-5 for a description of the SELECT_WORKLOAD_REPOSITORY function parameters.
You have a great deal of flexibility in how you use this function. A few examples will help illustrate this. Say you want to retrieve SQL from the AWR that was not parsed by the SYS user. Here is the SQL to do that:
SELECT sql_id, substr(sql_text,1,20)

,disk_reads, cpu_time, elapsed_time, parsing_schema_name

FROM table(
DBMS_SQLTUNE.SELECT_WORKLOAD_REPOSITORY(8200,8201,

'parsing_schema_name <> ''SYS''',

NULL, NULL,NULL,NULL, 1, NULL, 'ALL'));
The following example retrieves the top ten queries ranked by buffer gets for non-SYS users:
SELECT

 sql_id

,substr(sql_text,1,20)

,disk_reads

,cpu_time

,elapsed_time

,buffer_gets

,parsing_schema_name

FROM table(

DBMS_SQLTUNE.SELECT_WORKLOAD_REPOSITORY(

 begin_snap => 21730

,end_snap => 22900

,basic_filter => 'parsing_schema_name <> ''SYS'''

,ranking_measure1 => 'buffer_gets'

,result_limit => 10

));
In the prior queries, the SYS keyword is enclosed by two single quotes (in other words, those aren't double quotes around SYS).


11-9. Viewing Resource-Intensive SQL in Memory
Problem
Before populating a SQL tuning set, you want to view high-load SQL statements in the cursor cache in memory. You want to eventually use SQL contained in memory as input for populating a SQL tuning set.
Solution
Use the DBMS_SQLTUNE.SELECT_CURSOR_CACHE function to view current high resource-consuming SQL statements in memory. This query selects SQL statements in memory that have required more than a million disk reads:
SELECT

 sql_id

,substr(sql_text,1,20)

,disk_reads

,cpu_time

,elapsed_time

FROM table(DBMS_SQLTUNE.SELECT_CURSOR_CACHE('disk_reads > 1000000'))

ORDER BY sql_id;
Here is some sample output:
SQL_ID        SUBSTR(SQL_TEXT,1,20 DISK_READS   CPU_TIME ELAPSED_TIME

------------- -------------------- ---------- ---------- ------------

0s6gq1c890p4s  delete from "MVS"."    3325320 8756130000   1.0416E+10

b63h4skwvpshj BEGIN dbms_mview.ref    9496353 1.4864E+10   3.3006E+10
How It Works
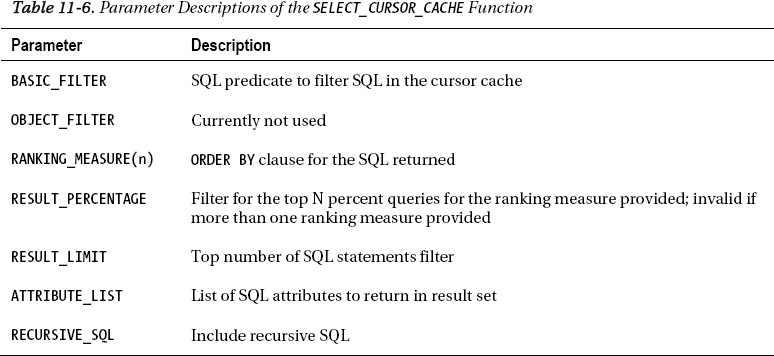
Before you work with SQL tuning sets, it's critical to understand you can use the DBMS_SQLTUNE.SELECT_CURSOR_CACHE function to retrieve high resource-usage SQL from memory. The result set retrieved by this PL/SQL function can be used as input for populating SQL tuning sets. See Table 11-6 for a description of the SELECT_CURSOR_CACHE function parameters.
You have a great deal of flexibility in how you use this function. Here's an example that selects SQL in memory, but excludes statements parsed by the SYS user and also returns statements with an elapsed time greater than 100,000:
SELECT sql_id, substr(sql_text,1,20)

,disk_reads, cpu_time, elapsed_time

FROM table(DBMS_SQLTUNE.SELECT_CURSOR_CACHE('parsing_schema_name <> ''SYS''

                                             AND elapsed_time > 100000'))

ORDER BY sql_id;
In the prior query, the SYS keyword is enclosed by two single quotes (in other words, those aren't double quotes around SYS). The SQL_TEXT column is truncated to 20 characters so that the output can be displayed on the page more easily. Here is some sample output:
SQL_ID        SUBSTR(SQL_TEXT,1,20 DISK_READS   CPU_TIME ELAPSED_TIME

------------- -------------------- ---------- ---------- ------------

byzwu34haqmh4 SELECT /* DS_SVC */           0     140000       159828
Once you have identified a SQL_ID for a resource-intensive SQL statement, you can view all of its execution details via this query:
SELECT *

FROM table(DBMS_SQLTUNE.SELECT_CURSOR_CACHE('sql_id = ''byzwu34haqmh4'''));
Note that the SQL_ID in the prior statement is enclosed by two single quotes (not double quotes).
This next example selects the top ten queries in memory in terms of CPU time for non-SYS users:
SELECT

 sql_id

,substr(sql_text,1,20)

,disk_reads

,cpu_time

,elapsed_time

,buffer_gets

,parsing_schema_name

FROM table(

DBMS_SQLTUNE.SELECT_CURSOR_CACHE(

 basic_filter => 'parsing_schema_name <> ''SYS'''

,ranking_measure1 => 'cpu_time'

,result_limit => 10

));
11-10. Populating SQL Tuning Set from High-Resource SQL in AWR
Problem
You want to create a SQL tuning set and populate it with the top I/O-consuming SQL statements found in the AWR.
Solution
Use the following steps to populate a SQL tuning set from high resource-consuming statements in the AWR:
- Create a SQL tuning set object.
- Determine begin and end AWR snapshot IDs.
- Populate the SQL tuning set with high-resource SQL found in AWR.
The prior steps are detailed in the following subsections.
Step 1: Create a SQL Tuning Set Object
Create a SQL tuning set. This next bit of code creates a tuning set named IO_STS:
Step 2: Determine Begin and End AWR Snapshot IDs
If you're unsure of the available snapshots in your database, you can run an AWR report or select the SNAP_ID from DBA_HIST_SNAPSHOTS:
select snap_id, begin_interval_time

from dba_hist_snapshot order by 1;
Step 3: Populate the SQL Tuning Set with High-Resource SQL Found in AWR
Now the SQL tuning set is populated with the top 15 SQL statements ordered by disk reads. The begin and end AWR snapshot IDs are 26800 and 26900 respectively:
DECLARE

  base_cur dbms_sqltune.sqlset_cursor;

BEGIN

  OPEN base_cur FOR

    SELECT value(x)

    FROM table(dbms_sqltune.select_workload_repository(

      26800,26900, null, null,'disk_reads',

      null, null, null, 15)) x;

  --

  dbms_sqltune.load_sqlset(

    sqlset_name => 'IO_STS',

    populate_cursor => base_cur);

END;

/
The prior code populates the top 15 SQL statements contained in the AWR ordered by disk reads. The DBMS_SQLTUNE.SELECT_WORKLOAD_REPOSITORY function is used to populate a PL/SQL cursor with AWR information based on a ranking criterion. Next the DBMS_SQLTUNE.LOAD_SQLSET procedure is used to populate the SQL tuning set using the cursor as input.
How It Works
The DBMS_SQLTUNE.SELECT_WORKLOAD_REPOSITORY function can be used in a variety of ways to populate a SQL tuning set using queries in the AWR. You can instruct it to load SQL statements by criteria such as disk reads, elapsed time, CPU time, buffer gets, and so on. See Table 11-5 for descriptions for parameters to this function. When designating the AWR as input, you can use either of the following:
- Begin and end AWR snapshot IDs
- An AWR baseline that you've previously created
You can view the details of the SQL tuning set (created in the “Solution” section) via this query:
SELECT

 sqlset_name

,elapsed_time

,cpu_time

,buffer_gets

,disk_reads

,sql_text

FROM dba_sqlset_statements

WHERE sqlset_name = 'IO_STS';
11-11. Populating a SQL Tuning Set from Resource-Consuming SQL in Memory
Problem
You want to populate a tuning set from high resource-consuming SQL statements that are currently in the memory.
Solution
Use the DBMS_SQLTUNE.SELECT_CURSOR_CACHE function to populate a SQL tuning set with statements currently in memory. This example creates a tuning set and populates it with high-load resource-consuming statements not belonging to the SYS schema and having disk reads greater than 1,000,000:
-- Create the tuning set

EXEC DBMS_SQLTUNE.CREATE_SQLSET('HIGH_DISK_READS'),

-- populate the tuning set from the cursor cache

DECLARE

  cur DBMS_SQLTUNE.SQLSET_CURSOR;

BEGIN

  OPEN cur FOR

  SELECT VALUE(x)

  FROM table(

  DBMS_SQLTUNE.SELECT_CURSOR_CACHE(

  'parsing_schema_name <> ''SYS'' AND disk_reads > 1000000',

  NULL, NULL, NULL, NULL, 1, NULL,'ALL')) x;

--

  DBMS_SQLTUNE.LOAD_SQLSET(sqlset_name => 'HIGH_DISK_READS',

    populate_cursor => cur);

END;

/
In the prior code, notice that the SYS user is bookended by sets of two single quotes (not double quotes). The SELECT_CURSOR_CACHE function loads the SQL statements into a PL/SQL cursor, and the LOAD_SQLSET procedure populates the SQL tuning set with the SQL statements.
How It Works
The DBMS_SQLTUNE.SELECT_CURSOR_CACHE function (see Table 11-6 for function parameter descriptions) allows you to extract from memory SQL statements and associated statistics into a SQL tuning set. The procedure allows you to filter SQL statements by various resource-consuming criteria, such as the following:
ELAPSED_TIMECPU_TIMEBUFFER_GETSDISK_READSDIRECT_WRITESROWS_PROCESSED
This allows you a great deal of flexibility on how to filter and populate the SQL tuning set.
11-12. Populating SQL Tuning Set with All SQL in Memory
Problem
You want to create a SQL tuning set and populate it with all SQL statements currently in memory.
Solution
Use the DBMS_SQLTUNE.CAPTURE_CURSOR_CACHE_SQLSET procedure to efficiently capture all of the SQL currently stored in the cursor cache (in memory). This example creates a SQL tuning set named PROD_WORKLOAD and then populates by sampling memory for 3,600 seconds (waiting 20 seconds between each polling event):
BEGIN

  -- Create the tuning set

  DBMS_SQLTUNE.CREATE_SQLSET(

    sqlset_name => 'PROD_WORKLOAD'

   ,description => 'Prod workload sample'),

  --

  DBMS_SQLTUNE.CAPTURE_CURSOR_CACHE_SQLSET(

    sqlset_name     => 'PROD_WORKLOAD'

   ,time_limit      => 3600

   ,repeat_interval => 20);

END;

/
How It Works
The DBMS_SQLTUNE.CAPTURE_CURSOR_CACHE_SQLSET procedure allows you to poll for queries and memory and use any queries found to populate a SQL tuning set. This is a powerful technique that you can use when it's required to capture a sample set of all SQL statements executing.
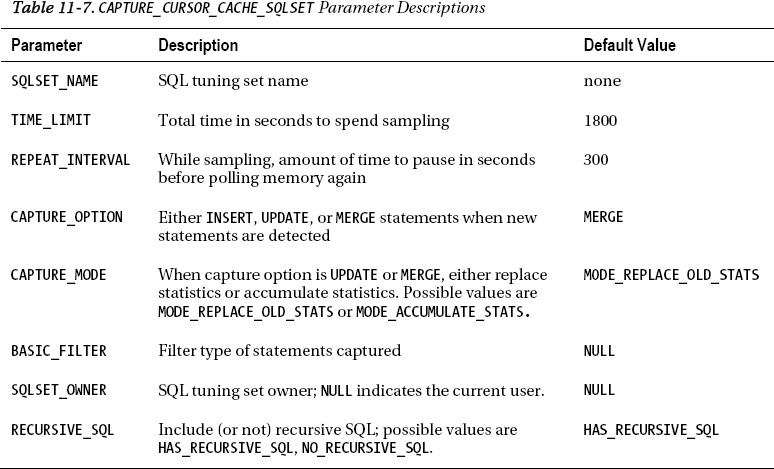
You have a great deal of flexibility on instructing DBMS_SQLTUNE.CAPTURE_CURSOR_CACHE_SQLSET to capture SQL statements in memory (see Table 11-7 for details on all parameters). For example, you can instruct the procedure to capture a cumulative set of statistics for each SQL statement by specifying a CAPTURE_MODE of DBMS_SQLTUNE.MODE_ACCUMULATE_STATS.
BEGIN

  DBMS_SQLTUNE.CAPTURE_CURSOR_CACHE_SQLSET(

    sqlset_name     => 'PROD_WORKLOAD'

   ,time_limit      => 60

   ,repeat_interval => 10

   ,capture_mode    => DBMS_SQLTUNE.MODE_ACCUMULATE_STATS);

END;

/
This is more resource-intensive than the default settings, but produces more accurate statistics for each SQL statement.
11-13. Displaying the Contents of a SQL Tuning Set
Problem
You have populated a SQL tuning set and want to verify its characteristics such as the SQL statements and corresponding statistics.
Solution
You can determine the name and number of SQL statements for SQL tuning sets in your database via this query:
SELECT name, created, statement_count

FROM dba_sqlset;
Here is some sample output:
NAME                           CREATED   STATEMENT_COUNT

------------------------------ --------- ---------------

test1                          19-APR-11              29
Use the following query to display the SQL text and associated statistical information for each query within the SQL tuning set:
SELECT sqlset_name, elapsed_time, cpu_time, buffer_gets, disk_reads, sql_text

FROM dba_sqlset_statements;
Here is a small snippet of the output. The SQL_TEXT column has been truncated in order to fit the output on the page:
SQLSET_NAME     ELAPSED_TIME   CPU_TIME BUFFER_GETS DISK_READS SQL_TEXT

--------------- ------------ ---------- ----------- ---------- ----------------------------

test1              235285363   45310000      112777       3050 INSERT ......

test1               52220149   22700000      328035      18826  delete from.....
How It Works
Recall that a SQL tuning set consists of one or more SQL statements and the corresponding execution statistics. This information is viewable from the DBA_SQLSET_* views. Table 11-8 describes the type of SQL tuning set information contained within each of these views.

You can also use the DBMS_SQLTUNE.SELECT_SQLSET function to retrieve information about SQL tuning sets—for example:
SELECT

 sql_id

,elapsed_time

,cpu_time

,buffer_gets

,disk_reads

,sql_text

FROM TABLE(DBMS_SQLTUNE.SELECT_SQLSET('&&sqlset_name'));
Whether you use the DBMS_SQLTUNE.SELECT_SQLSET function or directly query the data dictionary views depends entirely on your personal preference or business requirement.
11-14. Selectively Deleting Statements from a SQL Tuning Set
Problem
You want to prune SQL statements from an STS that don't meet a performance measure, such as queries that have less than 2,000,000 disk reads.
Solution
First view the existing SQL information associated with an STS:
select sqlset_name, disk_reads, cpu_time, elapsed_time, buffer_gets

from dba_sqlset_statements;
SQLSET_NAME                    DISK_READS   CPU_TIME ELAPSED_TIME BUFFER_GETS

------------------------------ ---------- ---------- ------------ -----------

IO_STS                            3112941 3264960000   7805935285     2202432

IO_STS                            2943527 3356460000   8930436466     1913415

IO_STS                            2539642 2310610000   5869237421     1658465

IO_STS                            1999373 2291230000   6143543429     1278601

IO_STS                            1993973 2243180000   5461607976     1272271

IO_STS                            1759096 1930320000   4855618689     1654252
Now use the DBMS_SQLTUNE.DELETE_SQLSET procedure to remove SQL statements from the STS based on the specified criterion. This example removes SQL statements that have less than 2,000,000 disk reads from the SQL tuning set named IO_STS:
BEGIN

  DBMS_SQLTUNE.DELETE_SQLSET(

    sqlset_name  => 'IO_STS'

   ,basic_filter => 'disk_reads < 2000000'),

END;

/
How It Works
The key to understanding is that a SQL tuning set consists of the following:
- One or more SQL statements
- Associated metrics/statistics for each SQL statement
Because the metrics/statistics are part of the STS, you can remove SQL statements from a SQL tuning set based on characteristics of the associated metrics/statistics. You can use the DBMS_SQLTUNE.DELETE_SQLSET procedure to remove statements from the STS based on statistics such as the following:
ELAPSED_TIMECPU_TIMEBUFFER_GETSDISK_READSDIRECT_WRITESROWS_PROCESSED
If you want to delete all SQL statements from a SQL tuning set, then don't specify a filter—for example:
SQL> exec DBMS_SQLTUNE.DELETE_SQLSET(sqlset_name => 'IO_STS'),
11-15. Transporting a SQL Tuning Set
Problem
You've identified some resource-intensive SQL statements in a production environment. You want to transport these statements and associated statistics to a test environment, where you can tune the statements without impacting production.
Solution
The following steps are used to copy a SQL tuning set from one database to another:
- Create a staging table in source database.
- Populate the staging table with STS data.
- Copy the staging table to the destination database.
- Unpack the staging table in the destination database.
The prior steps are elaborated on in the following subsections.
Step 1: Create a Staging Table in the Source Database
Use the DBMS_SQLTUNE.CREATE_STGTAB_SQLSET procedure to create a table that will be used to contain the SQL tuning set metadata. This example creates a table named STS_TABLE:
BEGIN

  dbms_sqltune.create_stgtab_sqlset(

  table_name => 'STS_TABLE'

,schema_name => 'MV_MAINT'),

END;

/
Step 2: Populate Staging Table with STS Data
Now populate the staging table with STS metadata using DBMS_SQLTUNE.PACK_STGTAB_SQLSET:
BEGIN

  dbms_sqltune.pack_stgtab_sqlset(

  sqlset_name          => 'IO_STS'

 ,sqlset_owner         => 'SYS'

 ,staging_table_name   => 'STS_TABLE'

 ,staging_schema_owner => 'MV_MAINT'),

END;

/
If you're unsure of the names of the STS you want to transport, run the following query to get the details:
SELECT name, owner, created, statement_count

FROM dba_sqlset;
Step 3: Copy the Staging Table to the Destination Database
You can copy the table from one database to the other via Data Pump, the old exp/imp utilities, or by using a database link. This example creates a database link in the destination database and then copies the table from the source database:
create database link source_db

connect to mv_maint

identified by foo

using 'source_db';
In the destination database, the table can be copied directly from the source with the CREATE TABLE AS SELECT statement:
SQL> create table STS_TABLE as select * from STS_TABLE@source_db;
Step 4: Unpack the Staging Table in the Destination Database
Use the DBMS_SQLTUNE.UNPACK_STGTAB_SQLSET procedure to take the contents of the staging table and populate the data dictionary with the SQL tuning set metadata. This example unpacks all SQL tuning sets contained within the staging table:
BEGIN

DBMS_SQLTUNE.UNPACK_STGTAB_SQLSET(

  sqlset_name        => '%'

 ,replace            => TRUE

 ,staging_table_name => 'STS_TABLE'),

END;

/
How It Works
A SQL tuning set consists of one or more queries and corresponding execution statistics. You will occasionally have a need to copy a SQL tuning set from one database to another. For example, you might be having performance problems with a production database but want to capture and move the top resource-consuming statements to a test database where you can diagnose the SQL (within the STS) without impacting production.
Keep in mind that an STS can be used as input for any of the following tools:
The prior tools are used extensively to troubleshoot and test SQL performance. Transporting a SQL tuning set from one environment to another allows you to use these tools in a testing or development environment.
![]() Note SQL tuning sets can be transported to Oracle Database 10g R2 or higher versions of the database only.
Note SQL tuning sets can be transported to Oracle Database 10g R2 or higher versions of the database only.
11-16. Creating a Tuning Task
Problem
You realize that as part of manually running the SQL Tuning Advisor, you need to first create a tuning task.
![]() Tip Refer to Figure 11-1 for the details on the flow of processes required when manually running the SQL Tuning Advisor.
Tip Refer to Figure 11-1 for the details on the flow of processes required when manually running the SQL Tuning Advisor.
Solution
Use the DBMS_SQLTUNE.CREATE_TUNING_TASK procedure to create a SQL tuning task. You can use the following as inputs when creating a SQL tuning task:
- Text for a specific SQL statement
- SQL identifier for a specific SQL statement from the cursor cache in memory
- Single SQL statement from the AWR given a range of snapshot IDs
- SQL tuning set name (see Recipes 11-7 through 11-11 for details on how to create a SQL tuning set)
Examples of the prior techniques for creating a SQL tuning task are described in the following subsections.
![]() Note The user creating the tuning task needs the
Note The user creating the tuning task needs the ADMINISTER SQL MANAGEMENT OBJECT system privilege.
Text for a Specific SQL Statement
This example provides the text of a SQL statement when creating the tuning task:
DECLARE

  tune_task VARCHAR2(30);

  tune_sql  CLOB;

BEGIN

  tune_sql := 'select count(*) from mgmt_db_feature_usage_ecm';

  tune_task := DBMS_SQLTUNE.CREATE_TUNING_TASK(

    sql_text    => tune_sql

   ,user_name   => 'MV_MAINT'

   ,scope       => 'COMPREHENSIVE'

   ,time_limit  => 60

   ,task_name   => 'tune_test'

   ,description => 'Provide SQL text'

);

END;

/
SQL ID for a Specific SQL Statement from the Cursor Cache
First identify the SQL_ID by querying V$SQL:
SELECT sql_id, sql_text

FROM v$sql where sql_text like '%&&mytext%';
Once you have the SQL_ID, you can provide it as input to DBMS_SQLTUNE.CREATE_TUNING_TASK:
DECLARE

  tune_task VARCHAR2(30);

  tune_sql  CLOB;

BEGIN

  tune_task := DBMS_SQLTUNE.CREATE_TUNING_TASK(

    sql_id      => '98u3gf0xzq03f'

   ,task_name   => 'tune_test2'

   ,description => 'Provide SQL ID'

);

END;

/
Single SQL Statement from the AWR Given a Range of Snapshot IDs
Here's an example of creating a SQL tuning task by providing a SQL_ID and range of AWR snapshot IDs:
DECLARE

  tune_task VARCHAR2(30);

  tune_sql  CLOB;
BEGIN

  tune_task := DBMS_SQLTUNE.CREATE_TUNING_TASK(

    sql_id      => '1tbu2jp7kv0pm'

   ,begin_snap  => 21690

   ,end_snap    => 21864

   ,task_name   => 'tune_test3'

);

END;

/
If you're not sure which SQL_ID (and associated query) to use, then run this query:
SQL> select sql_id, sql_text from dba_hist_sqltext;
If you're unaware of the available snapshot IDs, then run this query:
SQL> select snap_id from dba_hist_snapshot order by 1;
![]() Tip By default, the AWR contains only high resource-consuming queries. You can modify this behavior and ensure that a specific SQL statement is included in every snapshot (regardless of its resource consumption) by adding it to the AWR via the following:
Tip By default, the AWR contains only high resource-consuming queries. You can modify this behavior and ensure that a specific SQL statement is included in every snapshot (regardless of its resource consumption) by adding it to the AWR via the following:
SQL> exec dbms_workload_repository.add_colored_sql('98u3gf0xzq03f'),
SQL Tuning Set Name
If you have the requirement of running the SQL Tuning Advisor against multiple SQL queries, then a SQL tuning set is required. To create a tuning task using a SQL tuning set as input, do so as follows:
SQL> variable mytt varchar2(30);

SQL> exec :mytt := DBMS_SQLTUNE.CREATE_TUNING_TASK(sqlset_name => 'IO_STS'),

SQL> print :mytt
How It Works
Before manually executing the SQL Tuning Advisor, you first need to define what SQL statements will be used as input. You do this by creating a SQL tuning task. Oracle provides a great deal of flexibility on how you add SQL statements to a tuning task. As shown in the “Solution” section, you can do the following:
- Hard-code the text for a specific SQL query
- Use a SQL query in memory
- Use a SQL query in the AWR
- Define a SQL tuning set when tuning multiple queries
The prior techniques provide a variety of ways to identify SQL statements to be analyzed by the SQL Tuning Advisor. Once you've created a tuning task, you can view its details via this query:
select owner, task_name, advisor_name, created

from dba_advisor_tasks

order by created;
Once you have created a tuning task, you can now manually execute the SQL Tuning Advisor (Recipe 11-17). If you need to drop the tuning task, you can do so as follows:
SQL> exec dbms_sqltune.drop_tuning_task(task_name => '&&task_name'),
11-17. Manually Running SQL Tuning Advisor
Problem
You want to manually execute SQL Tuning Advisor and get tuning advice for a SQL statement.
Solution
Use the following steps to manually run the SQL Tuning Advisor:
- Create a tuning task (see Recipe 11-16 for complete details); this defines which SQL statements will be tuned. This can be a single SQL statement or several SQL statements within a SQL tuning set.
- Execute the tuning task.
- Display the results of the tuning task.
This example runs the SQL Tuning Advisor for a single SQL statement. First a tuning task is created.
DECLARE

  tune_task VARCHAR2(30);

  tune_sql  CLOB;

BEGIN

  tune_sql := 'select a.emp_id, b.dept_name ' ||

              'from emp a, dept b ' ||

              'where a.dept_id = b.dept_id';

  --

  tune_task := DBMS_SQLTUNE.CREATE_TUNING_TASK(

    sql_text    => tune_sql

   ,user_name   => 'MV_MAINT'

   ,scope       => 'COMPREHENSIVE'

   ,time_limit  => 60

   ,task_name   => 'tune_test'

   ,description => 'Tune a SQL statement.'

);

END;

/
Next the tuning task is executed:
SQL> exec dbms_sqltune.execute_tuning_task(task_name => 'tune_test'),
Lastly, a report is generated that displays the tuning advice:
SQL> set long 10000 longchunksize 10000

SQL> set linesize 132 pagesize 200

SQL> select dbms_sqltune.report_tuning_task('tune_test') from dual;
Here is some sample output:
1- Statistics Finding

---------------------

  Table "MV_MAINT"."DEPT" was not analyzed.

  Recommendation

  --------------

  - Consider collecting optimizer statistics for this table.

....

2- Index Finding (see explain plans section below)

--------------------------------------------------

  The execution plan of this statement can be improved by creating one or more

  indices.

  Recommendation (estimated benefit: 97.98%)

  ------------------------------------------

  - Consider running the Access Advisor to improve the physical schema design

    or creating the recommended index.

    create index MV_MAINT.IDX$$_21E10001 on MV_MAINT.EMP("DEPT_ID");
The prior output has specific recommendations on generating statistics for a table in the query and adding an index. You'll need to test the recommendations to ensure that performance does improve before implementing them in a production environment.
OPTIMIZER TUNING MODES
How It Works
The SQL Tuning Advisor helps automate the task of tuning poorly performing queries. The tool is fairly easy to use, and it provides suggestions on how to tune a query, such as the following:
- Rewriting the SQL
- Adding indexes
- Implementing a SQL profile or plan baselines
- Generating statistics
You can also manually run the SQL Tuning Advisor from either SQL Developer or Enterprise Manager. Running the SQL Tuning Advisor from these tools is briefly described in the next two subsections.
Running SQL Tuning Advisor from SQL Developer
If you have access to SQL Developer 3.0 or higher, then it's very easy to run the SQL Tuning Advisor for a query. Follow these simple steps:
- Open a SQL worksheet.
- Type in the query.
- Click the button associated with the SQL Tuning Advisor.
You will be presented with any findings and recommendations. If you have access to SQL Developer (it's a free download), this is the easiest way to run the SQL Tuning Advisor.
![]() Note Before running SQL Tuning Advisor, ensure the user that you're connected to has the
Note Before running SQL Tuning Advisor, ensure the user that you're connected to has the ADVISOR system privilege granted to it.
Running SQL Tuning Advisor from Enterprise Manager
You can also run the advisor from within Enterprise Manager. Log into Enterprise Manager and follow these steps:
- From the main database page, click the Advisor Central link (near the bottom).
- Under the Advisors section, click the SQL Advisors link.
- Click the SQL Tuning Advisor link.
You should be presented with a page similar to the one shown in Figure 11-3.

Figure 11-3. Scheduling SQL Tuning Advisor jobs from Enterprise Manager
From here you can run a SQL Tuning Advisor tuning task on the top SQL statements or SQL in the AWR, or provide a SQL tuning set as input.
11-18. Getting SQL Tuning Advice from the Automatic Database Diagnostic Monitor
Problem
You want to get advice on problem SQL statements from the Automatic Database Diagnostic Monitor (ADDM).
Solution
You can view an ADDM report from the following tools:
- SQL*Plus script
DBMS_ADDMpackage- Enterprise Manager
These techniques are elaborated on in the following subsections.
SQL Approach
You can run the ADDM report manually as shown:
SQL> @?/rdbms/admin/addmrpt.sql
You'll be prompted to specify a beginning and ending snapshot. Here's some sample output:
Instance     DB Name        Snap Id    Snap Started    Level

------------ ------------ --------- ------------------ -----

DWREP        DWREP            26482 09 Apr 2011 08:00      1

                              26483 09 Apr 2011 09:00      1

                              26484 09 Apr 2011 10:00      1

                              26485 09 Apr 2011 11:00      1

                              26486 09 Apr 2011 12:00      1


Specify the Begin and End Snapshot Ids

~~~~~~~~~~~~~~~~~~~~~~~~~~~~~~~~~~~~~~

Enter value for begin_snap:
You'll then be prompted for a report name:
The default report file name is addmrpt_1_26468_26486.txt. To use this name,

press <return> to continue, otherwise enter an alternative.

Enter value for report_name:
After the report executes, you can inspect the output. There's a Top SQL Statements section that reports on tuning recommendations for the top resource-consuming SQL statement. Here's some sample output:
Finding 1: Top SQL Statements

Impact is .79 active sessions, 72.17% of total activity.

--------------------------------------------------------

SQL statements consuming significant database time were found. These

statements offer a good opportunity for performance improvement.

   Recommendation 1: SQL Tuning

   Estimated benefit is .58 active sessions, 53.07% of total activity.

   -------------------------------------------------------------------

   Action

      Investigate the INSERT statement with SQL_ID "2nw0mmysuma43" for

      possible performance improvements. You can supplement the information

      given here with an ASH report for this SQL_ID.

      Related Object

         SQL statement with SQL_ID 2nw0mmysuma43.

         INSERT INTO bling

         ( registration_id,company

         ,soa_id,product_name
DBMS_ADDM Package
The DBMS_ADDM package is available with Oracle Database 11g R2 or higher. When using the DBMS_ADDM package, you must pass in a valid range of begin and end AWR snapshot IDs—for example:
var task_name varchar2(30);

exec DBMS_ADDM.ANALYZE_DB(:task_name, 8020, 8050);

print :task_name
Here is some sample output displaying the task name:
TASK_NAME

-------------------------------

TASK_8676
Query the DBA_HIST_SNAPSHOT view if you're not sure of what snapshots are available. Next the ADDM report is displayed:
SET LONG 1000000 PAGESIZE 0;

SELECT DBMS_ADDM.GET_REPORT('TASK_8676') FROM DUAL;
The output can be quite lengthy. Here is a small snippet recommending that you run the SQL Tuning Advisor for a specific SQL statement:
   Action

      Run SQL Tuning Advisor on the DELETE statement with SQL_ID

      "0s6gq1c890p4s".

      Related Object

         SQL statement with SQL_ID 0s6gq1c890p4s.

         delete from "MVS"."MGMT_DB_FEAT_USE_ECM_LATEST"

   Rationale

      The SQL spent 98% of its database time on CPU, I/O and Cluster waits.

      This part of database time may be improved by the SQL Tuning Advisor.
Enterprise Manager
First, log into Enterprise Manager. From the main login page, you can access the ADDM reports in Enterprise Manager as follows:
- From the main database page, click the Advisor Central link (near the bottom).
- Under the Advisors section, click the ADDM link.
You should be presented with a page similar to the one shown in Figure 11-4.

Figure 11-4. Running ADDM from Enterprise Manager
From this page, you can run ADDM to analyze current performance or investigate past performance issues.
How It Works
The ADDM analyzes AWR snapshots every hour (by default) and produces performance recommendations. The suggestions are ranked by the expected benefit of implementing a recommendation. Listed next are the types of recommendations you can expect from ADDM:
- Expensive SQL statements
- Expensive PL/SQL
- RAC issues
- CPU bottlenecks
- Memory sizing recommendations
- Database configuration recommendations
- I/O bottlenecks
If you are having database performance issues, the ADDM report is an excellent place to first look for bottlenecks and problem areas of the database. The ADDM also details top resource-consuming SQL statements and makes recommendations on how to tune these queries.