Chapter 8
Introducing Project Quality Management
CERTIFICATION OBJECTIVES
8.01 Preparing for Quality
8.02 Planning for Quality Management
8.03 Managing Quality
8.04 Implementing Control Quality
![]() Two-Minute Drill
Two-Minute Drill
Q&A Self Test
What is quality? Quality, in project management, is about fulfilling requirements. Quality is about satisfying stated and implied needs. Quality is a conformance to project requirements. Every project has an anticipated level of quality for the project deliverables. Project quality management is the process of ensuring that the project fulfills its obligations to satisfy the project needs. As projects vary, so, too, will the anticipated level of quality.
Picture this: It’s late on a hot summer night and you’re hungry. You pull onto a gravel road and see a diner with a neon “Open” sign. The sign, you notice, really says “Ope” since the “n” is burned out. Inside the diner, stale smoke drifts around like fog. Grease, onions, and garlic seep into your clothes. You opt for a booth, only to find the table smeared with catsup, a little gravy, and, guessing by the stickiness, a glob of maple syrup.
Now picture this: You step off the elevator on the 43rd floor. A maître d’ welcomes you and guides you to a table next to a window offering a sweeping view of the city. A piano player massages a song into the evening. The waiter snaps open a napkin and drapes it across your lap. Another waiter pours you a glass of cold, crisp water and presents the menu. By the soft candlelight, everything looks, and feels, grand.
With these two contrasting scenarios, which one do you think will have the better quality? Or can they both have an acceptable level of quality? For the first scenario—the diner—you expect a certain level of quality when it comes to service, food, and atmosphere. With the second scenario—the fancy restaurant—you also have an expected level of quality regarding service, food, and atmosphere. Both experiences are measured by that expected level of quality.
In the diner, you might get one of the best bacon cheeseburger and milkshake combos you can find late at night in the middle of nowhere. Just what you’d expect from this kind of place. And the fancy downtown restaurant? A fancy meal cooked to perfection—also what you’d expect. The difference between the two restaurants is in their grade. Quality and grade are not the same thing. The expected level of service, food, and atmosphere is the quality of the experience.
Looking at the Big Quality Picture
Before we hop into the three different facets of project quality management, let’s establish a few “PMI-isms” on quality. Because quality means so many different things to so many different people, it’s important to confirm that we’re working with a common understanding of what quality is and what quality management hopes to accomplish from the PMI’s point of view.
Accepting the Quality Management Approach
The details and specifications set out by the customer determine the expected level of quality. Project quality management, as far as your exam goes, is compatible with ISO 9000 and ISO 10000 quality standards and guidelines.
Project quality management also is concerned with both the management of the project and the product of the project. It’s easy to focus on the product (the thing or service the project creates), but project managers must also provide quality for the project management activities. Aspects of the downside of focusing too much on the product include the following:
![]() Overworking the project team to complete the project This may result in unacceptable work, a decline in team morale, and the slow, steady destruction of the project team’s willingness to work.
Overworking the project team to complete the project This may result in unacceptable work, a decline in team morale, and the slow, steady destruction of the project team’s willingness to work.
![]() Hurrying to complete the project work by speeding through quality inspections This can result in unacceptable deliverables.
Hurrying to complete the project work by speeding through quality inspections This can result in unacceptable deliverables.

ISO 9000 is an international standard that helps organizations follow their own quality procedures. It is not a quality system, but a method of following procedures created internally in an organization. And for the curious, ISO means “uniform” in Greek and it’s from the International Organization for Standardization.

See the video “Quality Facts.”
Quality vs. Grade
Quality and grade are not the same.
Quality is the sum of the characteristics of a product that allow it to meet the demands or expectations of the project. Quality is all about fulfilling requirements. Grade, according to the PMBOK Guide, “is a category or rank given to entities having the same functional use but different technical characteristics.” For example, there are different grades of paint, different grades of metal, and even different grades of travel.
Know that low quality is always a problem, but low grade may not be. Depending on the requirements of the customer, low grade may be completely acceptable, but low quality never is.
Implementing Quality Project Management
Quality management and project management have similar characteristics:
![]() Customer satisfaction The project must satisfy the customer requirements by delivering what it promised to satisfy the needs of the customer. The PMBOK Guide states it as “conformance to requirements” and “fitness for use.”
Customer satisfaction The project must satisfy the customer requirements by delivering what it promised to satisfy the needs of the customer. The PMBOK Guide states it as “conformance to requirements” and “fitness for use.”
![]() Prevention Quality is planned into a project, not inspected in. It is always more cost-effective to prevent mistakes than to correct them.
Prevention Quality is planned into a project, not inspected in. It is always more cost-effective to prevent mistakes than to correct them.
![]() Attribute sampling When you measure the results of a work, the results either will conform to quality or will not. In addition, variable sampling will measure the degree of conformity for the result of project work.
Attribute sampling When you measure the results of a work, the results either will conform to quality or will not. In addition, variable sampling will measure the degree of conformity for the result of project work.
![]() Tolerances There’s usually a window of tolerance when it comes to measurements of work results (for example, five defects per 100 units). Control limits define the boundaries of tolerance and acceptability for work results.
Tolerances There’s usually a window of tolerance when it comes to measurements of work results (for example, five defects per 100 units). Control limits define the boundaries of tolerance and acceptability for work results.
![]() Management responsibility The project team must work toward the quality goal, but management must provide the needed resources to deliver on the quality promises.
Management responsibility The project team must work toward the quality goal, but management must provide the needed resources to deliver on the quality promises.
![]() Plan-do-check-act Dr. W. Edwards Deming, arguably the world’s leader in quality management theory thanks to his management methods implemented in Japan after World War II, set the bar with his “plan-do-check-act” approach to quality management. This approach is similar to the project management processes that every project passes through.
Plan-do-check-act Dr. W. Edwards Deming, arguably the world’s leader in quality management theory thanks to his management methods implemented in Japan after World War II, set the bar with his “plan-do-check-act” approach to quality management. This approach is similar to the project management processes that every project passes through.
![]() Kaizen technology Kaizen is a quality management philosophy of applying continuous small improvements to reduce costs and to ensure consistency of project performance.
Kaizen technology Kaizen is a quality management philosophy of applying continuous small improvements to reduce costs and to ensure consistency of project performance.
![]() Quality improvement programs One of the goals of any organization is to improve quality, reduce errors, and effectively become more efficient and more productive. Two quality improvements the PMBOK Guide mentions directly are Total Quality Management and Lean Six Sigma. Both programs aim to reduce waste, eliminate non-value-added efforts, and help the organization become more efficient and achieve quality goals.
Quality improvement programs One of the goals of any organization is to improve quality, reduce errors, and effectively become more efficient and more productive. Two quality improvements the PMBOK Guide mentions directly are Total Quality Management and Lean Six Sigma. Both programs aim to reduce waste, eliminate non-value-added efforts, and help the organization become more efficient and achieve quality goals.
There are five levels of quality management:
![]() Let the customer find the defects This is the most expensive, and often the most embarrassing, approach to quality management. Warranty claims, rework, loss of income, and damage to reputation are all attributes of letting the customer find the defects.
Let the customer find the defects This is the most expensive, and often the most embarrassing, approach to quality management. Warranty claims, rework, loss of income, and damage to reputation are all attributes of letting the customer find the defects.
![]() Quality control inspections Inspect the work and correct the defects before the customer finds the defects. This approach can still be expensive and time-consuming, as rework must be done to correct the defects before the customer sees the work results.
Quality control inspections Inspect the work and correct the defects before the customer finds the defects. This approach can still be expensive and time-consuming, as rework must be done to correct the defects before the customer sees the work results.
![]() Quality assurance programs Aim to perfect the processes, not just the errors that are a result of a poor work process.
Quality assurance programs Aim to perfect the processes, not just the errors that are a result of a poor work process.
![]() Build quality into work Do the work correctly the first time by implementing quality planning and designing quality into the project.
Build quality into work Do the work correctly the first time by implementing quality planning and designing quality into the project.
![]() Quality culture Build a culture of quality in the organization, where everyone aims to achieve quality in all processes and work results
Quality culture Build a culture of quality in the organization, where everyone aims to achieve quality in all processes and work results
Tailoring Quality in Project Management
The first step in achieving quality is to define what constitutes quality in your project. To define quality, there must be agreement on what the scope requirements are, what the tolerances for quality are, and what expectations the project stakeholders have for quality. In other words, there must be quantifiable goals for quality to achieve quality in the project. To tailor quality in project management means that you’ll build a quality approach, or adapt a quality approach, for your organization that supports the vision of quality.
Considerations for tailoring quality in any organization include the following:
![]() Policy compliance and auditing Your industry may have regulation and compliance concerns to which you must adhere. Your organization may have a quality assurance department or group that sets internal policies for quality, and they may audit the project and project results to confirm adherence.
Policy compliance and auditing Your industry may have regulation and compliance concerns to which you must adhere. Your organization may have a quality assurance department or group that sets internal policies for quality, and they may audit the project and project results to confirm adherence.
![]() Continuous improvements You’ll need to define up front what the quality aspirations are and how you’ll achieve those aspirations. You’ll also define quality improvement for the project work, the processes, and the project management approach to be implemented throughout the project.
Continuous improvements You’ll need to define up front what the quality aspirations are and how you’ll achieve those aspirations. You’ll also define quality improvement for the project work, the processes, and the project management approach to be implemented throughout the project.
![]() Stakeholder engagement You want stakeholders to be engaged with the project work and to feel a sense of ownership in the project. The stakeholder management plan, which I’ll discuss in Chapter 13, is key for improving stakeholder engagement.
Stakeholder engagement You want stakeholders to be engaged with the project work and to feel a sense of ownership in the project. The stakeholder management plan, which I’ll discuss in Chapter 13, is key for improving stakeholder engagement.
Considering Quality in Agile Environments
Quality in agile projects is still about meeting the project requirements. Of course, the project requirements are defined in the iteration planning sessions and directly before the project team takes on the work for the current iteration. As the product owner and the development team review the number of user stories that can be completed within the current iteration, the team, product owner, and project manager seek clarification on what exactly is required to deliver on the selected user stories.
In agile and adaptive environments, quality reviews are built into the process, rather than waiting until the end of the project or iteration to check for quality. At the end of each iteration, the project manager and the project team attend a special meeting, called a retrospective, to look back on what’s worked (or didn’t work) in the last iteration. This enables the project manager and team to make changes to processes and make adjustments to improve upon the project processes and the execution of the work to create the user stories.
CERTIFICATION OBJECTIVE 8.01
Preparing for Quality
Before a project manager can plan for quality, he must know what the quality expectations are. Specifically, what are the quality standards of the performing organization, and which quality standards are applicable to the project? As part of the planning processes, the project manager and the project team must identify the requirements of planning, determine how the requirements may be met, and identify the costs and schedule demands to meet the identified requirements.
One of the key principles of project quality management is that quality is planned in, not inspected in. Planning for quality is more cost-effective than inspecting work results and doing the work over or correcting problems to adhere to quality demands.
The project manager must consider the costs of achieving the expected level of quality in contrast to the costs of nonconformance. The costs of quality include training, safety measures, and action to prevent poor quality. The costs of nonconformance can far outweigh the costs of quality with possible loss of customers, rework needed, lost time, lost materials, and danger to workers.
As part of planning, the project manager must be wary of gold plating. Gold plating happens when the project manager sees that money remains in the budget, so she adds features and extras to the project scope to consume the entire budget. The customer does not need or want more than what was requested. Gold plating can be considered unethical.
Determining the Quality Policy
Top management should define the quality policy; this is part of the organizational process assets. The quality policy of the organization may follow a formal approach, such as ISO 9000, Six Sigma, or Total Quality Management, or it may have its own direction and approach to satisfying the demand for quality. There are loads of proprietary quality management methodologies, and you won’t need to know much about any of them for your PMP exam. Out in the real world, however, you’ll need to be familiar with the rules, policies, and procedures of whatever quality management methodology your organization subscribes to. Lucky you.
The project team should adapt the quality policy of the organization to guide the project implementation. This ensures that the management of the project and the deliverables of the project are in alignment with the performing organization’s quality policy. In addition, the project manager should document how the project will fulfill the quality policy both in management and in the project deliverable.
What if the performing organization doesn’t have a quality policy? Or what if two different entities are working together on a project and they use differing quality policies? In these circumstances, the project management team should create the quality policy for the project. The quality policy, in these instances, will accomplish the same goals as a company’s quality policy: define quality requirements and determine how to adhere to them.
Regardless of where the quality policy comes from—management or the project team—the project stakeholders must be aware of the policy. This is important because the quality policy and associated quality methodology may require actions that could lengthen the project schedule—for example, quality audits, peer reviews, and other quality-centric activities. In addition to the required time to fulfill the quality requirements, other costs may be incurred.
Reviewing the Scope Baseline
Just as project quality management is focused on fulfilling the needs of the project, the project scope baseline is a key input to the quality planning process. I know you know that the scope baseline comprises the project scope statement, the WBS, and the WBS dictionary. Recall that the scope statement defines what will and will not be delivered as part of the project, as well as objectives regarding cost, schedule, and scope. The deliverables, and the expectations of the customers, will help guide the quality planning session to ensure that the customer requirements are met with regard to quality.
While the project scope will define the initial product description, the product description may have supporting detail that the project manager and project team will need to review. Consider a project to create an apartment building. The requirements, specifications, and details of the building will need to be evaluated and reviewed since this information will, no doubt, affect the quality planning.
The WBS and WBS dictionary are needed during quality planning because they define the specific things that will satisfy the project requirements for deliverables. The WBS is like a catalog of customer expectations. When you and your project team fulfill the elements of the WBS, you’re meeting customer satisfaction, which maps to quality. The WBS dictionary tags along because it has the specific details of what each element of the WBS requires.

So, what is quality in project management? Quality is the accurate completion of the project scope and the satisfaction of the stated and implied project needs. In your quest for your PMP certification, do you have quality? What is the scope of your certification goal and how will you reach it? Focus on quality as you’re studying, in your preparation, and in your mental mindset, and you’ll find quality in the execution of your PMP test-taking.
Consider Schedule and Costs
From the project management plan you will also need to consider the schedule and costs baselines. Recall that quality is affected by the balance of the schedule, costs, and scope, so it stands to reason that you’ll need the baselines of these components of the project management plan as part of quality planning. The balance of time, cost, and scope are the Iron Triangle of project management. If your organization has high demands for quality, but the project is rushed or insufficient funds are available to achieve the quality demanded in the project scope, then there is a risk that the project will not be successful because quality could not be achieved.
The schedule of the project does affect quality. Consider a schedule that is perfect only for the project activities and doesn’t consider time for the quality inspections. If the quality inspections are rushed—or, worse, skipped entirely—there will probably be errors in the project work. The project schedule should include time for the project management work, including the quality control activities discussed in this chapter, for the quality expectations to be met.
Costs can also influence the ability of the project to meet quality expectations. If the costs are not adequate to meet the demands of the project scope—such as purchasing the correct materials, tools, and equipment—then quality is likely to suffer as well. Costs affect the elements of the project quality, because to achieve the expected quality, you’ll have to pay for the correct tools, equipment, material, and resources. If there are errors and mistakes in the project execution, quality again can be adversely affected by costs. Consider a project that wastes materials due to an error. If the organization can’t afford to replace the materials, the quality of the project suffers because of the error and ultimately because of the cost of the wasted materials.
Reviewing the Standards and Regulations
The standards and regulations of each industry should be reviewed to determine that both the project plan and the plan for quality are acceptable. For example, a project to wire a building for electricity will have certain regulations to which it must adhere. The relevance of the regulations must be understood and planned into the project to ensure conformance with regulatory requirements. Standards and regulations are considered part of the enterprise environmental factors that affect the project planning and execution.
CERTIFICATION OBJECTIVE 8.02
Planning for Quality Management
Once the project manager has assembled the needed inputs and evaluated the product description and project scope, she can get to work creating a plan on how to satisfy the quality demands. She’ll need to rely on the documentation created to date, her project team, and the project’s key stakeholders for much of the input. In addition, the project manager will use several different techniques to plan on meeting quality. But first, she must consider five inputs to planning quality management in a project:
![]() Project charter A high-level project description of what the project will create. The charter also defines what constitutes success and the measurable project objectives.
Project charter A high-level project description of what the project will create. The charter also defines what constitutes success and the measurable project objectives.
![]() Project management plan The project management plan is needed because of the integration of quality management. Specifically, the requirements management plan, risk management plan, stakeholder engagement plan, and the scope baseline are referenced in quality management planning.
Project management plan The project management plan is needed because of the integration of quality management. Specifically, the requirements management plan, risk management plan, stakeholder engagement plan, and the scope baseline are referenced in quality management planning.
![]() Project documents The project documents that are needed in quality management planning are the assumption log, requirements documentation, requirements traceability matrix, the risk register, and the stakeholder register.
Project documents The project documents that are needed in quality management planning are the assumption log, requirements documentation, requirements traceability matrix, the risk register, and the stakeholder register.
![]() Enterprise environmental factors The project manager will need to review any regulations, rules, and standards for the organization; the geographic makeup of the project; the organizational structure; marketplace conditions; working conditions of the project; and any cultural perceptions that could affect achieving quality.
Enterprise environmental factors The project manager will need to review any regulations, rules, and standards for the organization; the geographic makeup of the project; the organizational structure; marketplace conditions; working conditions of the project; and any cultural perceptions that could affect achieving quality.
![]() Organizational process assets The project manager will also need to abide by the organization’s quality management system, policies, procedures, and guidelines. Organizational process assets leveraged here may also include templates, check sheets, and historical information.
Organizational process assets The project manager will also need to abide by the organization’s quality management system, policies, procedures, and guidelines. Organizational process assets leveraged here may also include templates, check sheets, and historical information.
As planning is an iterative process, so, too, is quality planning. As events happen within the project, the project manager should evaluate the events and then apply corrective actions. This is a common PMI theme: plan, implement, measure, react—and document! Throughout the project implementation, things will go awry, team members may complete less-than-acceptable work, stakeholders will demand changes, and so on; these variables must be evaluated for their impacts on project quality. What good is a project if it’s “completed” on time, but the quality of the deliverable is unacceptable? Technically, if the product is unacceptable, the project is not finished, because it failed to meet the project scope. Let’s look at some tools and techniques the project manager will use to plan for quality.
Applying Benchmarking Practices
Benchmarking, when it comes to quality project management, is all about comparing one project to another. This technique considers what the project manager has planned or experienced regarding quality and compares it to another project to see how things measure up. The current project can be measured against any other project—not just projects within the performing organization or within the same industry.
The goal of benchmarking is to evaluate the differences between the two projects and then to take corrective actions for the current project if necessary. For example, Project A may have better quality performance than Project B. When the project manager compares the two projects, she’ll want to determine the differences between them. She’ll look for what’s missing in Project B or what activities the folks in Project A are doing that she’s not.
If used improperly, benchmarking can create some false goals and internal competition. If the projects that are being compared are active, truth in reporting is mandatory; otherwise, the results of the benchmarking will be skewed. Just imagine what could happen if you compared your cost variances to another project that was hiding cost variances. By comparison, your project would seem to be performing worse, although that might not actually be the case. Ideally, benchmarking compares similar, completed projects early in the quality planning, rather than late in the process.
Benchmarking allows the project manager and the project team to see what’s possible and then strive toward that goal. Benchmarking can also be used as a measurement against industry standards, competitors’ pricing, or competitors’ level of performance.
Brainstorming and Interviews
Brainstorming and interviews are two data-gathering techniques that a project team can use in planning for quality. Brainstorming, as discussed earlier in this book, enables the team to generate as many ideas as possible, so that the ideas can be discussed to be adapted into the project. Interviews can query stakeholders, subject matter experts, and management on quality needs and expectations for the project.
Using a Benefit/Cost Analysis
Benefits should outweigh costs.
A benefit/cost analysis is a process of determining the pros and cons of any process, product, or activity. The straightforward approach when it comes to project management is concerned with the benefits versus the costs of the quality management activities. There are two major considerations with the benefit/cost analysis in quality management:
![]() Benefit Completing quality work increases productivity because shoddy work does not have to be redone. When work is completed correctly the first time as expected, the project does not have to spend additional funds to redo the work.
Benefit Completing quality work increases productivity because shoddy work does not have to be redone. When work is completed correctly the first time as expected, the project does not have to spend additional funds to redo the work.
![]() Costs Completing quality work may cost more than the work is worth. To deliver a level of quality beyond what is demanded costs the project additional funds. The types of quality management activities that guarantee quality may not be needed for every project.
Costs Completing quality work may cost more than the work is worth. To deliver a level of quality beyond what is demanded costs the project additional funds. The types of quality management activities that guarantee quality may not be needed for every project.

Although quality is required on every project, not every project has the same quality expenses based on the demands. For example, consider a project to create a temporary drainage ditch for a field. Specifications are set for the ditch, but the project may not require the expense of a landscape architect to evaluate the slant and descent of the temporary ditch.
Another project, to create and secure an information technology department, may require the expense of a security consulting firm to evaluate, test, and certify the security of the software code, the network servers, and the physical security of the department. The cost of the quality requirements is in alignment with the demands of the project.
Considering the Cost of Quality
The cost of quality considers the expense of all the activities within a project that are undertaken to ensure its quality. The cost of quality is divided into three major categories:
![]() Prevention costs Defines the costs of preventing poor quality in the project. This approach is the cost of completing the project work to satisfy the project scope and the expected level of quality. Examples of this cost include training, safety measures, and acquiring the right tools and equipment to do the project work.
Prevention costs Defines the costs of preventing poor quality in the project. This approach is the cost of completing the project work to satisfy the project scope and the expected level of quality. Examples of this cost include training, safety measures, and acquiring the right tools and equipment to do the project work.
![]() Appraisal costs The cost of measuring, testing, auditing, and evaluating the project’s product to confirm that quality has been achieved in the work results.
Appraisal costs The cost of measuring, testing, auditing, and evaluating the project’s product to confirm that quality has been achieved in the work results.
![]() Failure costs This approach is the cost of completing the project work without quality. The biggest issue here is the money lost by having to redo the project work; it’s always more cost-effective to do the work right the first time. Internal failure costs are the rework and scrap caused by poor quality. External failure costs include loss of sales, loss of customers, downtime, and damage to the organization’s reputation.
Failure costs This approach is the cost of completing the project work without quality. The biggest issue here is the money lost by having to redo the project work; it’s always more cost-effective to do the work right the first time. Internal failure costs are the rework and scrap caused by poor quality. External failure costs include loss of sales, loss of customers, downtime, and damage to the organization’s reputation.
The optimal cost quality is about balancing the prevention and appraisal costs against the failure costs. For example, a manufacturer could slow down a piece of equipment to ensure that every widget created is perfect, but the cost of doing so is greater than running the equipment at a faster pace and losing a few widgets due to poor quality.
You might use some additional quality management planning tools, such as the affinity diagram, brainstorming, nominal group techniques, or—here’s a new one—force-field analysis. It sounds like something out of Star Wars, but it’s a diagram that captures the forces that are for or against a change. The forces could be people, policies, or other constraints in the organization. When you think about “may the force be with you,” it could mean you want the people, policies, and other factors on your side as you move toward project execution.
Utilizing Multicriteria Decision Analysis Tools
Multicriteria decision analysis tools, also called multiple-criteria decision-making tools, help the project manager evaluate multiple facets of decisions when it comes to quality. The tool can help determine tradeoffs for achieving quality expectations, but it can also help keep the project’s costs, schedule, and workflow all in balance. The project manager can examine the competing objectives of a predetermined budget against the requirements for quality, risks in the project, schedule, and the business value the project will bring. There are software packages to help you make the best choice, if not the best solution, for the decision.
Representing Data in Quality Management Planning
You can use several tools for data representation in quality management planning (and in other processes):
![]() Flowcharts Also called process maps, they show the flow of process, possibilities for branching, loops, and possible outcomes for a process. (I’ll cover flowcharting in more detail later in this chapter.)
Flowcharts Also called process maps, they show the flow of process, possibilities for branching, loops, and possible outcomes for a process. (I’ll cover flowcharting in more detail later in this chapter.)
![]() Logical data model Visualizes the data and helps to uncover where quality issues may be lurking.
Logical data model Visualizes the data and helps to uncover where quality issues may be lurking.
![]() Matrix diagrams Compares and contrasts objectives, metrics, and other factors that may affect quality in the project.
Matrix diagrams Compares and contrasts objectives, metrics, and other factors that may affect quality in the project.
![]() Mind mapping Helps to visualize thoughts and information.
Mind mapping Helps to visualize thoughts and information.
Planning for Testing and Inspection
Quality control is inspection-driven, but you’ll need a plan for how you’ll inspect the work. As part of quality management planning, the project manager and the project team will define how the work will be tested and inspected to ensure that quality has been met. This is an example of an appraisal cost, because the inspection activities will take time, may require materials or tools to test, and may have other cost factors depending on the industry in which the project is being undertaken. For example, consider the testing costs in manufacturing versus construction or IT projects.
Creating the Quality Management Plan
The result of quality planning is to identify a method for implementing the quality policy. Because planning is iterative, the quality planning sessions often require several revisits to the quality planning processes. Longer projects may include scheduled quality planning sessions to compare the performance of the project in relation to the quality that was planned.
One of the major outputs of quality planning is the quality management plan. This document describes how the project manager and the project team will fulfill the quality policy. In an ISO 9000 environment, the quality management plan is referred to as the “project quality system.” The quality management plan addresses the following three things about the project and the project work:
![]() Quality control Work results are monitored to see if they meet relevant quality standards. If the results do not meet the quality standards, the project manager applies root-cause analysis to determine the cause of the poor performance and then eliminates the cause. Quality control is inspection-oriented.
Quality control Work results are monitored to see if they meet relevant quality standards. If the results do not meet the quality standards, the project manager applies root-cause analysis to determine the cause of the poor performance and then eliminates the cause. Quality control is inspection-oriented.
![]() Quality assurance The overall performance is evaluated to ensure that the project meets the relevant quality standards. Quality assurance maps to an organization’s quality policy and is typically a managerial process. Quality assurance is generally considered the work of applying the quality plan.
Quality assurance The overall performance is evaluated to ensure that the project meets the relevant quality standards. Quality assurance maps to an organization’s quality policy and is typically a managerial process. Quality assurance is generally considered the work of applying the quality plan.
![]() Quality improvement The project performance is measured and evaluated, and corrective actions are applied to improve the product and the project. The improvements can be large or small, depending on the condition and the quality philosophy of the performing organization.
Quality improvement The project performance is measured and evaluated, and corrective actions are applied to improve the product and the project. The improvements can be large or small, depending on the condition and the quality philosophy of the performing organization.
Identifying the Quality Metrics
Quality metrics are the quantifiable terms and values used to measure a process, activity, or work result. An example of an operational definition could be an expected value for the required torque to tighten a bolt on a piece of equipment. Testing and measuring the torque could determine the operational definition to prove or disprove the quality of the product. Other examples can include hours of labor to complete a work package, required safety measures, cost per unit, and so on.
Quality metrics are clear, concise measurements. Designating that 95 percent of all customer service calls should be answered by a live person within 30 seconds is a metric; a statement that all calls should be answered in a timely manner is not. The project can also have a quality metric, such as the cost performance index or the number of user stories completed per iteration.
CERTIFICATION OBJECTIVE 8.0
Managing Quality
Managing quality is an executing process. It is the sum of the planning and the implementations of the plans the project manager, the project team, and management apply to ensure that the project meets the demands of quality. Managing quality is sometimes referred to as quality assurance (QA). QA is not done only at the end of the project, but it should occur before and during the project as well. Because QA is an executing process, you should link it to continuous process improvement, because its aim is to make the project better. In project management, managing quality includes not only managing the quality of the processes, but also managing the quality of the product design. Managing quality is everyone’s responsibility: the project manager, project team, project sponsor, management, and even the project customer.
In some organizations, the QA department or another entity will complete the QA activities. QA is interested in finding the defects and then fixing the problems. There are many different approaches to QA, depending on the quality system the organization or project team has adopted.
Preparing to Manage Quality
The project manager and the project team will need to prepare several inputs for managing quality:
![]() Lessons learned register Lessons from the current project can help improve quality for the remainder of the current project.
Lessons learned register Lessons from the current project can help improve quality for the remainder of the current project.
![]() Results of quality control The measurements taken by the project manager and the project team to inspect the project deliverables’ quality are fed back into the quality management process.
Results of quality control The measurements taken by the project manager and the project team to inspect the project deliverables’ quality are fed back into the quality management process.
![]() Quality metrics Quality control tests will provide these measurements. The values must be quantifiable so results may be measured, compared, and analyzed. In other words, “pretty close to on track” is not adequate; “95 percent pass rate” is more acceptable.
Quality metrics Quality control tests will provide these measurements. The values must be quantifiable so results may be measured, compared, and analyzed. In other words, “pretty close to on track” is not adequate; “95 percent pass rate” is more acceptable.
![]() Risk report Risks can affect the quality of the project, so a review of the risk report is needed to ensure that quality is not adversely affected.
Risk report Risks can affect the quality of the project, so a review of the risk report is needed to ensure that quality is not adversely affected.
![]() The quality management plan This plan defines how the project team will implement and fulfill the quality policy of the performing organization.
The quality management plan This plan defines how the project team will implement and fulfill the quality policy of the performing organization.
![]() Organizational process assets Considerations include the organization quality management system, quality templates, previous quality audit results, and lessons learned from similar projects.
Organizational process assets Considerations include the organization quality management system, quality templates, previous quality audit results, and lessons learned from similar projects.
Managing Quality for a Project
You can use several tools and techniques to manage quality within a project. You don’t have to use all of these tools—just the ones that are most appropriate for your organization. One of the most common tools is a data-gathering tool: the checklist. The checklist ensures that all the required steps were correctly taken to create a quality result. For example, you could use a checklist in a project to install light fixtures. The checklist would ensure that all installations, regardless of the team member, were done in the same way to get the same results.
Here are other tools and techniques to consider:
![]() Alternatives analysis Determines quality options and chooses the best option for the project
Alternatives analysis Determines quality options and chooses the best option for the project
![]() Document analysis Reviews project documentation, such as performance and risk reports, to see if quality may be threatened by what’s occurring in the project
Document analysis Reviews project documentation, such as performance and risk reports, to see if quality may be threatened by what’s occurring in the project
![]() Process analysis Reviews processes in the project and organization to identify improvement opportunities
Process analysis Reviews processes in the project and organization to identify improvement opportunities
![]() Root cause analysis Finds the root cause of project variances, defects, or risk (if root causes of poor quality are corrected or eliminated the poor quality won’t happen again)
Root cause analysis Finds the root cause of project variances, defects, or risk (if root causes of poor quality are corrected or eliminated the poor quality won’t happen again)
![]() Multicriteria decision analysis Reviews, compares, and contracts project and product characteristics that may affect quality
Multicriteria decision analysis Reviews, compares, and contracts project and product characteristics that may affect quality
![]() Affinity diagrams Group similar ideas, deliverables, or concepts together; the WBS could be considered an example of an affinity diagram
Affinity diagrams Group similar ideas, deliverables, or concepts together; the WBS could be considered an example of an affinity diagram
![]() Cause-and-effect diagrams Also known as fishbone diagrams, Ishikawa diagrams, and why-why diagrams, they help to identify causal factors and root cause of quality problems
Cause-and-effect diagrams Also known as fishbone diagrams, Ishikawa diagrams, and why-why diagrams, they help to identify causal factors and root cause of quality problems
![]() Flowcharts Demonstrate the flow of information or activities in a process, project, or organization
Flowcharts Demonstrate the flow of information or activities in a process, project, or organization
![]() Histograms Bar charts that can help show distribution of errors, issues, metrics accomplished, and other data
Histograms Bar charts that can help show distribution of errors, issues, metrics accomplished, and other data
![]() Matrix diagrams Compare and contrast objectives, metrics, and other factors that may affect quality in the project
Matrix diagrams Compare and contrast objectives, metrics, and other factors that may affect quality in the project
![]() Scatter diagrams Track the relationship between two variables, which are considered related the closer they track against a diagonal line
Scatter diagrams Track the relationship between two variables, which are considered related the closer they track against a diagonal line
Completing a Quality Audit
Quality audits are about learning. A quality audit identifies compliance with organizational policies, processes, and procedures to make things better for this project and other projects within the organization. The idea, for example, is that project manager Susan can learn from the implementations of project manager Bob, and vice versa.
Quality audits are formal reviews of what’s been completed within a project, what worked, and what didn’t work. The result of the audit is to improve performance for the current project, other projects, or the entire organization. Quality audits aim to do the following:
![]() Document the best practices the project is using.
Document the best practices the project is using.
![]() Document any variances in the project quality approach.
Document any variances in the project quality approach.
![]() Recommend best practices that should be implemented in the current project.
Recommend best practices that should be implemented in the current project.
![]() Assist the project manager and project team in implementing recommendations for quality improvement.
Assist the project manager and project team in implementing recommendations for quality improvement.
![]() Document the outcomes of the quality audit in the project’s lessons learned documentation.
Document the outcomes of the quality audit in the project’s lessons learned documentation.
Quality audits can be scheduled at key intervals within a project, or—surprise!—they can occur without warning. The audit process can vary, depending on who is completing the audit: internal auditors or hired, third-party experts. The goal of a quality audit is to ensure that the project is adhering to the requirements of managing quality, and the goal of managing quality is to reduce the overall cost of quality. As you probably know from your experience, it’s usually more cost-effective to do something right the first time than to do it right the second time. That’s managing quality—do the work according to plan, and you’ll save time and money.
Utilizing the Design for X Approach
Design for X is a philosophy in product design, where the X can mean excellence, or, more often, a specific characteristic of a solution. Design for X is also known as DfX. X is usually a variable that the project is trying to address, such as cost, uptime, return on investment, or some other facet the organization is pursuing. Design for X considers all components of the design and how the component affects the X variable for better or for worse. Common project goals for Design for X include lowered costs and improved service, reliability, safety, and overall quality.
Implementing Problem-Solving Techniques
When there’s a problem in the project, it’s the responsibility of the project manager and the project team to attempt to resolve the problem and to ensure that the project can continue and overcome the setback or challenge. In the quality management process, problem solving will address quality issues and concerns by following a six-step problem-solving approach:
1. Define the problem.
2. Define the problem’s root cause.
3. Generate solutions to the problem.
4. Select the best solution for the problem.
5. Implement the selected solution.
6. Test and verify the effectiveness of the selected solution.
Reviewing the Results of Managing Quality
The primary output of managing quality? Quality improvement. But it’s not just about the quality of the project’s deliverables; it’s also about the process to complete the project work. This is process analysis, and it follows the guidelines of the process improvement plan. There are five outputs of the process:
![]() Quality reports
Quality reports
![]() Test and evaluation documentation
Test and evaluation documentation
![]() Project management plan updates (which can include quality management plan, scope baseline, schedule baseline, and cost baseline)
Project management plan updates (which can include quality management plan, scope baseline, schedule baseline, and cost baseline)
![]() Project document updates (which include issue log, lessons learned register, and risk register)
Project document updates (which include issue log, lessons learned register, and risk register)
Quality improvement requires action to improve the project’s effectiveness. The actions to improve the effectiveness may have to be routed through the change control system, which means change requests, analysis of the costs and risks, and involvement of the change control board.
CERTIFICATION OBJECTIVE 8.04
Implementing Control Quality
Quality control (QC) requires the project manager, or another qualified party, to monitor and measure project results to determine whether the results are up to the demands of the quality standards. If the results are unsatisfactory, root-cause analysis follows the quality control processes. Root-cause analysis enables the project manager to determine the cause and apply corrective actions. QC occurs throughout the life of a project, not just at its end.
QC is also not concerned only with the product the project is creating, but with the project management processes. QC measures performance, scheduling, and cost variances. The management of the project should be of quality—not just the product the project creates. Consider a project manager who demands the project team work extreme hours to meet an unrealistic deadline; team morale suffers and likely so does the project work the team is completing.
The project team should do the following to ensure competency in quality control:
![]() Conduct statistical quality control, such as sampling and probability.
Conduct statistical quality control, such as sampling and probability.
![]() Inspect the product to keep errors away from the customer.
Inspect the product to keep errors away from the customer.
![]() Perform attribute sampling to measure conformance to quality on a per-unit basis.
Perform attribute sampling to measure conformance to quality on a per-unit basis.
![]() Conduct variable sampling to measure the degree of conformance.
Conduct variable sampling to measure the degree of conformance.
![]() Study special causes to determine anomalies to quality.
Study special causes to determine anomalies to quality.
![]() Research random causes to determine expected variances of quality.
Research random causes to determine expected variances of quality.
![]() Check the tolerance range to determine whether the results are within or without an acceptable level of quality.
Check the tolerance range to determine whether the results are within or without an acceptable level of quality.
![]() Observe control limits to determine whether the results are in or out of quality control.
Observe control limits to determine whether the results are in or out of quality control.
Preparing for Quality Control
Quality control relies on several inputs, such as the following:
![]() The quality management plan The quality management plan defines how QA will be applied to the project, the expectations of QC, and the organization’s approach for continuous process improvement.
The quality management plan The quality management plan defines how QA will be applied to the project, the expectations of QC, and the organization’s approach for continuous process improvement.
![]() Lessons learned register Lessons learned from the current project can help the remainder of the project improve upon its quality outcome.
Lessons learned register Lessons learned from the current project can help the remainder of the project improve upon its quality outcome.
![]() Quality metrics The operational definitions that define the metrics for the project are needed so QC can measure and react to the results of project performance.
Quality metrics The operational definitions that define the metrics for the project are needed so QC can measure and react to the results of project performance.
![]() Test and evaluation documents Documentation on the outcomes of the testing and review of project deliverables are used to determine how well they achieved the project objectives.
Test and evaluation documents Documentation on the outcomes of the testing and review of project deliverables are used to determine how well they achieved the project objectives.
![]() Approved change requests Approved change requests have an effect on how the project work is scheduled and performed, which may affect the project’s overall quality.
Approved change requests Approved change requests have an effect on how the project work is scheduled and performed, which may affect the project’s overall quality.
![]() Deliverables Execution brings about deliverables. The results of both the project processes and the product results are needed to measure the results of the project team’s work and compare it to the quality standards. The expected results of the product and the project can be measured from the project plan.
Deliverables Execution brings about deliverables. The results of both the project processes and the product results are needed to measure the results of the project team’s work and compare it to the quality standards. The expected results of the product and the project can be measured from the project plan.
![]() Work performance data The key performance metrics about the work the project team has performed are needed. The project manager will need to inspect the variances between what was planned and what was implemented for schedule, costs, and scope.
Work performance data The key performance metrics about the work the project team has performed are needed. The project manager will need to inspect the variances between what was planned and what was implemented for schedule, costs, and scope.
![]() Enterprise environmental factors The project management information system, plus any quality management software, regulations, rules, and standards that the project must adhere to are considered inputs for quality control.
Enterprise environmental factors The project management information system, plus any quality management software, regulations, rules, and standards that the project must adhere to are considered inputs for quality control.
![]() Organizational process assets The organization’s quality policy, standards for quality control techniques, and communication requirements based on the outcomes of quality control inspections are all needed for the quality control process.
Organizational process assets The organization’s quality policy, standards for quality control techniques, and communication requirements based on the outcomes of quality control inspections are all needed for the quality control process.
Inspecting Results
Although quality is planned into a project, not inspected in, inspections are needed to prove conformance to requirements. An inspection can be done on the project as a whole, on a portion of the project work, on the project deliverable, or even on an individual activity. Inspections are also known as the following:
![]() Reviews
Reviews
![]() Product reviews
Product reviews
![]() Audits
Audits
![]() Walkthroughs
Walkthroughs
Data gathering is also utilized in the QC process. You should be familiar with two data-gathering tools:
![]() Checklists Ensure that the work is done the same way each time to reach the same quality result.
Checklists Ensure that the work is done the same way each time to reach the same quality result.
![]() Checksheets Help organize data about a quality issue. Checksheets, also known as tally sheets, are not the same thing as checklists. Checksheets can be used to “tally” up the type of defects in a project to organize a plan of defect repair or corrective actions.
Checksheets Help organize data about a quality issue. Checksheets, also known as tally sheets, are not the same thing as checklists. Checksheets can be used to “tally” up the type of defects in a project to organize a plan of defect repair or corrective actions.
Another type of inspection is testing, which tests the product against the quality standards to see if the deliverable meets the quality objectives. Testing is unique to the discipline in which the project takes place. For example, testing in software development aims to find bugs and errors, while testing in construction may occur to confirm electrical, plumbing, and HVAC systems. Testing is typically done throughout the project, not just at the end, to ensure that work isn’t built on faulty results.
Statistical sampling is an inspection tool and technique in which you randomly select a few items from the pool of deliverables to measure quality on these items as a representative of the whole population. For example, if you were installing 1000 doors in a project, you might select 200 doors to inspect randomly to see how quality is being implemented across the task of installing doors.
Finally, you can use questionnaires and surveys to collect information on customer satisfaction after the project, or after a portion of the project, is completed. The surveys can be a fast way to see how happy the customers are with the project results and give you some insight to how well the project team ascertained the needed quality in the project.
Data Representation Tools
Data representation tools are charts that can illustrate the results of your quality control efforts. You’ll need to be concerned with several types of charts for the exam—these first two are pretty easy:
![]() Cause-and-effect diagrams These diagrams show the relationships between the variables within a process and how those relationships may contribute to inadequate quality. They can help organize both the process and team opinions, as well as generate discussion on finding a solution to ensure quality. Figure 8-1 shows an example of a cause-and-effect diagram. To create a diagram, start with the effect—the problem you want to solve—and then fill out the diagram with possible causes that contribute to the effect. These diagrams are also known as Ishikawa diagrams and fishbone diagrams.
Cause-and-effect diagrams These diagrams show the relationships between the variables within a process and how those relationships may contribute to inadequate quality. They can help organize both the process and team opinions, as well as generate discussion on finding a solution to ensure quality. Figure 8-1 shows an example of a cause-and-effect diagram. To create a diagram, start with the effect—the problem you want to solve—and then fill out the diagram with possible causes that contribute to the effect. These diagrams are also known as Ishikawa diagrams and fishbone diagrams.

FIGURE 8-1 Cause-and-effect diagrams show the relationship of variables to a problem.
A cause-and-effect diagram is also called an Ishikawa diagram, why-why chart, and a fishbone diagram—these terms refer to the same thing.
![]() System or process flowcharts These flowcharts illustrate the flow of a process through a system, such as a project change request through the change control system or work authorization through a quality control process. A process flowchart does not have to be limited to the project management activities. It could instead demonstrate how a manufacturer creates, packages, and ships the product to the customer, as shown in Figure 8-2.
System or process flowcharts These flowcharts illustrate the flow of a process through a system, such as a project change request through the change control system or work authorization through a quality control process. A process flowchart does not have to be limited to the project management activities. It could instead demonstrate how a manufacturer creates, packages, and ships the product to the customer, as shown in Figure 8-2.

FIGURE 8-2 Flowcharts demonstrate how processes within a system are related.
Creating a Control Chart
Ever feel like your project is out of control? A control chart can prove it. Control charts illustrate the performance of an aspect of a project over time. They map the results of inspections against a chart, as shown in Figure 8-3. Control charts are typically used in projects or operations that involve repetitive activities—such as projects for manufacturing, a testing series, or help desks.

FIGURE 8-3 Control charts demonstrate the results of inspections.
The outer limits of a control chart are established by customer requirements. Within the customer requirements are the upper control limits (UCLs) and the lower control limits (LCLs). The UCL is typically set at +3 or +6 sigma, while the LCL is set at –3 or –6 sigma. Sigma results show the degree of correctness. Table 8-1 outlines the four sigma values representing normal distribution. You’ll need to know these for the PMP exam.
TABLE 8-1 The Four Sigma Values Representing Normal Distribution

So, what happened to sigma 4 and sigma 5? Nothing. They’re still there; it’s just that the difference between 3 sigma at 99.73 and 6 sigma at 99.99 is so small that statisticians just jump to 6 sigma. The mean in a control chart represents the expected result, while the sigma values represent the expected spread of results based on the inspection. A true 6 sigma allows only two defects per million opportunities, and the percentage to represent that value is 99.99985 percent. For the exam, you can go with 99.99 percent.

For example, if a manufacturer creates 1000 units per hour and expects an average of 50 units each hour to be defective, the mean would be 950 units. Of course, a better approach would be to create a mean based on a history of what’s been produced, but for now let’s assume that the expectation is 50 units defective per hour out of 1000 units created. If the control limits were set at +/–3 sigma, the results of testing would actually expect up to 953 correct units and down to 947 correct units. The upper and lower specifications, identified as the solid lines in Figure 8-3, are the boundaries for acceptable performance.

Over time, the results of testing are plotted in the control chart. Whenever a result of testing is plotted beyond the UCL or LCL values, it is considered to be “out of control.” When a value is out of control, there is a reason why—it’s called an assignable cause. Something caused the results to change for better or for worse, and the result must be investigated to understand the why behind the occurrence.
Another reason to look for an assignable cause is The Rule of Seven, which states that whenever seven consecutive results are all on one side of the mean or there are seven consecutive measures trending up or down, this is an assignable cause. Thus, some change has caused the results to shift to one side of the expected mean. Again, the cause must be investigated to determine why the change happened.
Although control charts are easily associated with recurring activities, such as manufacturing, they can also be applied to project management. Consider the number of expected change requests, delays within a project, and other recurring activities. A control chart can plot out these activities to measure performance, evaluate positive and negative results, and track corrective actions based on previous similar projects or from historical information within the current project.

Some project managers may believe that there should be no variance at all in the results of testing—they expect it to be 100 percent correct all the time. In some instances, this is valid; consider hospitals, military scenarios, and other situations dealing with life and death. When a project manager demands 100 percent perfection, the cost of quality issues needs to be revisited. What is the cost of obtaining perfection versus the cost of obtaining 98 percent correctness?
Creating Pareto Diagrams
A Pareto diagram is somewhat related to Pareto’s Law: 80 percent of the problems come from 20 percent of the issues. This is also known as the 80/20 rule. A Pareto diagram illustrates the problems by assigned cause from smallest to largest, as Figure 8-4 shows. The project team should first work on the largest problems and then move on to the smaller problems.

FIGURE 8-4 A Pareto diagram is a histogram that ranks issues from largest to smallest.
Creating a Histogram
A histogram is a bar chart showing the frequency of variables within a project. For example, a histogram could show which states have the most customers for a retailer. Within project management, a common histogram is a resource histogram, which shows the frequency of resources used on project work. It’s nothing more than a bar chart.
Creating a Run Chart
A run chart, as Figure 8-5 shows, is a line graph that shows the results of inspections in the order in which they’ve occurred. The goals of a run chart are first to demonstrate the results of a process over time and then to use trend analysis to predict when certain trends may reemerge. It is similar to a control chart, but it tracks the outcomes of measurements against when the outcome happened and the time between the measurements. This gives insight into the measurements that differs from what the control chart offers. Based on this information, an organization can work to prevent the negative trend or work to capitalize on an identified opportunity.

FIGURE 8-5 A run charts track the results of inspections over time.
Creating a Scatter Diagram
A scatter diagram is like a run chart, but it instead tracks the relationship between two variables. The two variables are considered related the closer they track against a diagonal line. For example, a project manager could track the performance of two team members, the time and cost, or even changes between functional managers and the project’s schedule.
The seven basic quality management tools are scatter diagrams, control charts, histograms, Pareto diagrams, checksheets, flowcharts, and cause-and-effect diagrams.
Completing a Statistical Sampling
Statistical sampling is the process of choosing a percentage of results at random. For example, a project creating a medical device may have 20 percent of all units randomly selected to check quality. This process must be completed on a consistent basis throughout the project, rather than on a sporadic schedule.
Statistical sampling can reduce the costs of quality control, but results can be mixed if an adequate testing plan and schedule are not followed. The science of statistical sampling (and its requirements to be effective) is an involved process. Many books, seminars, and professionals are devoted to the process. For the PMP exam, know that statistical sampling uses a percentage of the results to test for quality. This process can reduce quality control cost.
Revisiting Flowcharting
Flowcharts are used to illustrate how the different parts of a system operate. Flowcharting is valuable in quality control because the process can be evaluated and tested to determine where in the process quality begins to break down. Corrective actions can then be applied to the system to ensure that quality continues as planned—and as expected.
Applying Trend Analysis
Trend analysis is the science of analyzing past results to predict future performance. Sports announcers use trend analysis all the time: “The Cubs have never won in St. Louis, on a Tuesday night, in the month of July, when the temperature at the top of the third inning was above 80 degrees.”
The results of trend analysis enable the project manager to apply corrective actions to intervene and prevent unacceptable outcomes. Trend analysis on a project requires adequate records to predict results and set current expectations. Trend analysis can monitor the following:
![]() Technical performance Trend analysis can ask, “How many errors have been experienced up to this point in the project schedule, and how many additional errors were encountered since the last testing of the technical performance?”
Technical performance Trend analysis can ask, “How many errors have been experienced up to this point in the project schedule, and how many additional errors were encountered since the last testing of the technical performance?”
![]() Cost and schedule performance Trend analysis can ask, “How many activities were completed incorrectly, came in late, or had significant cost variances?”
Cost and schedule performance Trend analysis can ask, “How many activities were completed incorrectly, came in late, or had significant cost variances?”
The Results of Quality Control
Quality control should, first and foremost, result in quality improvement. Based on the results of the tools and techniques used to implement quality control, the project manager and project team apply corrective actions to prevent unacceptable quality and improve the overall quality of the project management processes.
INSIDE THE EXAM
Quality, in project management, has many different meanings. For the PMP exam, you should know the following four key facts:
![]() Customer satisfaction is the conformance of the requirements and fitness for use.
Customer satisfaction is the conformance of the requirements and fitness for use.
![]() Quality is distinct from grade.
Quality is distinct from grade.
![]() Quality is obtained by the project team doing what was promised at the start of the project.
Quality is obtained by the project team doing what was promised at the start of the project.
![]() Quality is concerned with prevention over inspection.
Quality is concerned with prevention over inspection.
The quality management plan spans all areas of project quality—not just the product the project is creating—and considers quality after the project is complete. The experience of the project as led by the project manager should be of quality as well. There is a direct relationship between the project deliverables and the quality of project management.
Another area of quality is scheduling. A project manager must examine resources and how they are allocated, and pay attention to the cost of quality for the assigned resources. One scheduling technique, just-in-time (JIT) scheduling, demands higher quality. JIT scheduling means, for example, that you do not order inventory, such as supplies and materials, until it is needed. This improves cash flow and reduces the cost of inventory not in use. However, a lack of quality in the project may cause defects. Because of the defects, the material in use is thus wasted and downtime occurs. This downtime results because no additional materials are on hand and the project is waiting for new materials to arrive.
Finally, spend some time learning the values for the four sigmas shown in Table 8-1. You’ll need to know them.
The corrective actions and the defect repairs that the project manager and the project team want to incorporate into the project may require change requests and management approval. The value and importance of the change should be evident so the improvement to quality is approved and folded into the project. In addition to quality improvement, there are other results of quality control:
![]() Verified deliverables and changes The work results are either accepted or rejected. Rejected items typically mean rework. When changes are approved and executed, these changes also need to be validated, as they’re now part of the project scope baseline. Verified deliverables mean that the work is of quality and may now be an input to validate scope process.
Verified deliverables and changes The work results are either accepted or rejected. Rejected items typically mean rework. When changes are approved and executed, these changes also need to be validated, as they’re now part of the project scope baseline. Verified deliverables mean that the work is of quality and may now be an input to validate scope process.
![]() Rework Nonconformance to quality results in change requests for corrective action. Rework costs time and money, and it contributes to projects being late, over budget, or both. It is always more cost-effective to do the work right the first time than to do it correctly the second time.
Rework Nonconformance to quality results in change requests for corrective action. Rework costs time and money, and it contributes to projects being late, over budget, or both. It is always more cost-effective to do the work right the first time than to do it correctly the second time.
![]() Project management plan updates When results of inspections indicate quality is out of control, process adjustments may be needed to make immediate corrective actions or planned preventative actions to ensure that quality improves. Process adjustments that affect the project management plan will qualify for a change request and will be funneled through the change control system as part of integration management.
Project management plan updates When results of inspections indicate quality is out of control, process adjustments may be needed to make immediate corrective actions or planned preventative actions to ensure that quality improves. Process adjustments that affect the project management plan will qualify for a change request and will be funneled through the change control system as part of integration management.
![]() Project document updates Quality control can result in updates to the issue log, lessons learned register, risk register, and test and evaluation documents.
Project document updates Quality control can result in updates to the issue log, lessons learned register, risk register, and test and evaluation documents.
CERTIFICATION SUMMARY
What good is a project deliverable if it doesn’t work, is unacceptable, or is faulty? Project quality management ensures that the deliverables that project teams create meet the expectations of the stakeholders. For your PMP examination, quality means delivering the project at the exact level of the design specifications and the project scope. No more, no less.
Quality and grade are two different things. Grade is the ranking assigned to different components that have the same functional purpose. For example, sheet metal may come in different grades based on how it will be used. The grade of paper is based on its thickness, ability to retain ink, and so on. Low quality is always a problem; low grade may not be.
Quality planning happens before project work begins, but also as work is completed. Quality planning can confirm the preexistence of quality or the need for quality improvements. Quality is planned into a project, not inspected in. However, quality control uses inspections to prove the existence of quality within a project deliverable. Quality management is based upon the quality management plan and addresses the quality of the project, but also the design of the product and the processes.
There is a distinct difference between quality management and quality control. Quality management is a prevention-driven process. The organization’s management wants the project manager and the project team to do the work right the first time. Quality control, however, is an inspection-driven process—the project team, the project manager, and sometimes third-party inspectors examine the work to confirm that it is correct and of quality. Quality assurance is usually a program for the entire organization, or at least a line of business or department. In project management, quality management is specific to the actual project work.
The prevention costs are concerned with the monies invested in the project to ascertain the expected level of quality. Examples of this cost include training, safety measures, and the acquisition of appropriate tools and equipment to do the project work. The failure costs centers on the monies lost by not completing the project work correctly the first time. In addition, this cost includes external failure costs the loss of sales, loss of customers, and damage to the organization’s reputation.
KEY TERMS
If you’re serious about passing the PMP exam, memorize these terms and their definitions. For maximum value, create your own flashcards based on these definitions and review daily.
affinity diagram A tool that groups similar ideas, deliverables, or concepts together. The WBS could be considered an example of an affinity diagram.
appraisal costs The cost of measuring, testing, auditing, and evaluating the project’s product to confirm that quality has been achieved in the work results.
benchmarking The process of using prior projects internal or external to the performing organization to compare and set quality standards for processes and results.
benefit/cost analysis The process of determining the pros and cons of any project, process, product, or activity.
checklist A listing of activities that workers check to ensure the work has been completed consistently; used in quality control.
checksheet Also called a tally sheet. Used to count errors and defects in different categories of failure in the project.
control chart Illustrates the performance of a project over time. It maps the results of inspections against a chart. Control charts are typically used in projects or operations that have repetitive activities, such as manufacturing, testing series, or help desk functions. Upper and lower control limits indicate whether values are in control or out of control.
Design for X A philosophy in product design in which the X can mean excellence or, more often, a specific characteristic of a solution. In Design for X, or DfX, the X is usually a variable that the project is trying to address, such as cost, uptime, return on investment, or another facet the organization is pursuing.
failure costs The cost of not completing the project with quality, including wasted time for corrective actions and rework, and wasted materials. Failure costs include internal failure costs, which include the cost of corrective actions and defect repair incurred by doing the work twice. External failure costs describe the loss of sales, loss of opportunities, and damage to the organization’s reputation due to poor quality.
flowchart A chart that illustrates how the parts of a system occur in sequence.
histogram A bar chart, such as a Pareto diagram.
ISO 9000 An international standard that helps organizations follow their own quality procedures. ISO 9000 is not a quality system, but a method of following procedures created by an organization.
Multicriteria Decision Analysis Tools Also called multiple-criteria decision-making tools, these help the project manager evaluate multiple facets of decisions with regard to quality. They can also help determine tradeoffs for achieving quality expectations, but they also keep the project’s costs, schedule, and flow of work in balance.
Pareto diagram A diagram related to Pareto’s Law, which states that 80 percent of the problems come from 20 percent of the issues (also known as the 80/20 rule). A Pareto diagram illustrates problems by assigned cause, from smallest to largest.
prevention costs The cost of completing the project work to satisfy the project scope and the expected level of quality. Examples include training, safety measures, and acquiring the appropriate tools to do the project work.
process adjustments When quality is lacking, process adjustments are needed for immediate corrective actions or for future preventive actions to ensure that quality improves. Process adjustments may qualify for a change request and may be funneled through the change control system as part of integration management.
quality assurance (QA) An executing process to ensure that the project is adhering to the quality expectations of the project customer and organization. QA is a prevention-driven process that seeks to perform the project work with quality to avoid errors, waste, and delays.
quality audit A process to confirm that the quality processes are being performing correctly on the current project. The quality audit determines how to make things better for the project and other projects within the organization and measures the project’s ability to maintain the expected level of quality.
quality control (QC) A process in which the work results are monitored to see if they meet relevant quality standards.
quality management plan A document that describes how the project manager and the project team will fulfill the quality policy. In an ISO 9000 environment, the quality management plan is referred to as the project quality system.
quality policy The formal policy an organization follows to achieve a preset standard of quality. The project team should either adapt the quality policy of the organization to guide the project implementation or create its own policy if one does not exist within the performing organization.
run chart Similar to a control chart, a run chart tracks trends over time and displays those trends in a graph with the plotted data mapped to a specific date.
scatter diagram Tracks the relationship between two or more variables to determine whether one variable affects the other. It enables the project team, quality control team, or project manager to make adjustments to improve the overall results of the project.
statistical sampling A process of choosing a percentage of results at random for inspection. Statistical sampling can reduce the costs of quality control.
trend analysis Analyzes past results to predict future performance.
 TWO-MINUTE DRILL
Looking at the Big Quality Picture
![]() The project manager is responsible for the overall quality management of the project and must set quality expectations based on the requirements of the customers and stakeholders.
The project manager is responsible for the overall quality management of the project and must set quality expectations based on the requirements of the customers and stakeholders.
![]() The project manager must integrate the quality control of the project with the quality assurance program of the performing organization.
The project manager must integrate the quality control of the project with the quality assurance program of the performing organization.
![]() Quality is planned into a project, not inspected in.
Quality is planned into a project, not inspected in.
Preparing for Quality
![]() Quality doesn’t happen by accident. Quality is satisfying the expectations of the project scope baseline.
Quality doesn’t happen by accident. Quality is satisfying the expectations of the project scope baseline.
![]() The project team members (the people completing the project work) are responsible for the quality of the deliverables.
The project team members (the people completing the project work) are responsible for the quality of the deliverables.
![]() The project team, as guided by the project manager and the quality management plan, should be empowered to stop the project work when preset quality thresholds are exceeded.
The project team, as guided by the project manager and the quality management plan, should be empowered to stop the project work when preset quality thresholds are exceeded.
Planning for Quality Management
![]() Quality planning is an iterative process. As quality concerns enter into the project, the planning processes are revisited to ensure that actions—both preventive and corrective—are taken to ensure quality.
Quality planning is an iterative process. As quality concerns enter into the project, the planning processes are revisited to ensure that actions—both preventive and corrective—are taken to ensure quality.
![]() The quality management plan is a subsidiary plan of the overall project management plan. It defines how the project will accomplish the quality expectations of the organization and how the project will adhere to the quality policy of the organization.
The quality management plan is a subsidiary plan of the overall project management plan. It defines how the project will accomplish the quality expectations of the organization and how the project will adhere to the quality policy of the organization.
![]() The quality management plan is a subsidiary plan of the overall project management plan. It defines how project processes will be analyzed and improved upon. The goal of this plan is to improve the value of the project by removing non-value-added activities.
The quality management plan is a subsidiary plan of the overall project management plan. It defines how project processes will be analyzed and improved upon. The goal of this plan is to improve the value of the project by removing non-value-added activities.
![]() The cost of quality is the amount of monies the performing organization must spend to satisfy the quality standards. This can include prevention costs, appraisal costs, and failure costs.
The cost of quality is the amount of monies the performing organization must spend to satisfy the quality standards. This can include prevention costs, appraisal costs, and failure costs.
![]() The cost of nonconformance to quality is the monies or events attributed to not satisfying the quality demands. These can include loss of business, downtime, wasted materials, rework, and cost and schedule variances.
The cost of nonconformance to quality is the monies or events attributed to not satisfying the quality demands. These can include loss of business, downtime, wasted materials, rework, and cost and schedule variances.
Managing Quality
![]() Managing quality aims to do the work properly and correctly the first time, according to plan.
Managing quality aims to do the work properly and correctly the first time, according to plan.
![]() Managing quality may use a QA program to set quality standards.
Managing quality may use a QA program to set quality standards.
![]() Managing quality represents the implementation of the quality plan.
Managing quality represents the implementation of the quality plan.
![]() Managing quality is the process to ensure the project is completed with no deviations from the requirements.
Managing quality is the process to ensure the project is completed with no deviations from the requirements.
![]() The Kaizen philosophy is used in an organization to apply small changes to products and processes to improve consistency, reduce costs, and provide overall quality improvements.
The Kaizen philosophy is used in an organization to apply small changes to products and processes to improve consistency, reduce costs, and provide overall quality improvements.
Implementing Quality Control
![]() Quality control monitors specific results within a project.
Quality control monitors specific results within a project.
![]() A fishbone diagram is a cause-and-effect diagram that illustrates the factors that may be contributing to quality issues or problems. It is also known as an Ishikawa diagram or a why-why chart.
A fishbone diagram is a cause-and-effect diagram that illustrates the factors that may be contributing to quality issues or problems. It is also known as an Ishikawa diagram or a why-why chart.
![]() Pareto diagrams are histograms that are related to Pareto’s 80/20 rule: 80 percent of the problems come from 20 percent of the issues. The diagram charts the problems, categories, and frequency. The project team should first solve the larger problems and then move on to smaller issues.
Pareto diagrams are histograms that are related to Pareto’s 80/20 rule: 80 percent of the problems come from 20 percent of the issues. The diagram charts the problems, categories, and frequency. The project team should first solve the larger problems and then move on to smaller issues.
![]() A run chart is a line graph that shows the results of inspection in the order in which each inspection occurred. The goal of a run chart is first to demonstrate the results of a process over time and then use trend analysis to predict when certain trends may reemerge.
A run chart is a line graph that shows the results of inspection in the order in which each inspection occurred. The goal of a run chart is first to demonstrate the results of a process over time and then use trend analysis to predict when certain trends may reemerge.
![]() Control charts plot out the results of inspections against a mean and specification limits to examine performance against expected results. Upper and lower control limits are typically set to ±3 or 6 sigma. Results that are beyond the control limit value are considered out of control.
Control charts plot out the results of inspections against a mean and specification limits to examine performance against expected results. Upper and lower control limits are typically set to ±3 or 6 sigma. Results that are beyond the control limit value are considered out of control.
 SELF TEST
1. Gary is the project manager of the HBB Project for his organization. He’s working with project customers to define the specifics of the project requirements, the project scope, and the defined product scope to help define the quality of the project. The customer asks Gary who is responsible for the quality of the project deliverables. Which of the following is responsible for managing quality?
A. The project champion
B. The project team
C. Stakeholders
D. Everyone
2. As a PMP candidate, you’ll need to recognize all the quality control charts and their usage. What type of chart is the following?

A. Control
B. Pareto
C. Scatter
D. Flow
3. You are the project manager for the BBB Project. Stacy, a project team member, is confused about what QA is. You need all the project team members and the project stakeholders to be clear on the quality management processes. To help Stacy, which of the following best describes QA?
A. QA is quality assurance for the overall project performance.
B. QA is quality acceptance according to scope verification.
C. QA is quality assurance for the project deliverable.
D. QA is quality assurance for the project stakeholders.
4. You are the project manager for the Photo Scanning Project. This project is similar to another project you have completed. Your project is to store thousands of historical photos electronically for your city’s historical society. Quality is paramount on this project. Management approaches you and asks why you have devoted so much of the project time for planning. Your response is which of the following?
A. This is a first-time, first-use project, so more time is needed for planning.
B. Planning for a project of this size, with this amount of quality, is mandatory.
C. Quality is planned into a project, not inspected in.
D. Quality audits are part of the planning time.
5. You are the project manager for the Floor Installation Project. Today you will meet with your project team to ensure that the project is completed with no deviations from the project requirements. This process is which of the following?
A. Quality planning
B. Quality management
C. Quality control
D. Quality assurance
6. You are the project manager for the ASE Project, which must map to industry standards in order to be accepted by the customer. You and your team have studied the requirements and have created a plan to implement the deliverables with the appropriate level of quality. What is this process called?
A. Quality planning
B. Quality management
C. Quality control
D. Quality assurance
7. You are the project manager of the NHQ Project, which is part of the HQQ Program to construct a condominium building. Samuel, the program manager, has required that you document any variances to costs, schedule, scope, and quality expectations as part of the program governance. You believe that your project team now has an internal failure cost that needs to be documented for Samuel. Which of the following is an example of internal failure cost?
A. Rework
B. Quality audits
C. Random quality audits
D. Project team training
8. Quality assurance is an organization-wide initiative and is part of your enterprise environmental factors. All projects must adhere to the quality assurance initiatives in your company. Within your project, however, you also have quality assurance efforts and you have quality control efforts. Quality control is typically a(n) _______________ process.
A. Management
B. Project manager
C. Audit
D. Inspection
9. Quality assurance is an organization-wide initiative and is part of your enterprise environmental factors. All projects must adhere to the quality assurance initiatives in your company. Within your project, however, you also have quality assurance efforts and you have quality control efforts. Managing quality is typically a(n) _______________ process.
A. Executing
B. Project manager
C. Audit
D. Inspection
10. You are the project manager for a large manufacturer of wood furniture. Your new project is the Shop Table Project, which will involve the creation and manufacture of a new table for woodworkers to use in their wood shops. For this project, you have elected to use JIT for scheduling. Which of the following is an advantage to using JIT?
A. It requires materials to be readily available.
B. It enables the project team to have control over the materials.
C. It decreases the inventory investment.
D. It allows for a broad range of deviation compared to other inventory solutions.
11. You are the project manager of the HHQ Project for your company. Your company is a manufacturer of paper products. Your company has elected to use ISO 9000 standards. What is an attribute of ISO 9000?
A. It ensures that your company follows its own quality procedures.
B. It ensures that your company follows the set phases in each project from initiation to closure.
C. It ensures that your company maps its processes to a proven process within the program.
D. It ensures that QA and QC are integrated into the product or service your organization offers.
12. You are the project manager of the Halogen Installation Project. As this project gets underway, you receive notice from the program manager that the organization will be moving to a Kaizen methodology as part of its quality management program. What is a Kaizen methodology?
A. Small improvements for small results
B. Small improvements for all projects
C. Small process and product improvements that are carried out on a continuous basis
D. Small process improvements that are made to shorten the project duration
13. Holly Ann is a project manager for her organization. She is working with Jeff, the manufacturing rep, to analyze the errors in the deliverables as part of their quality control approach. Jeff recommends that they create a fishbone diagram to help analyze the problem. A fishbone diagram is the same as a(n) _______________ diagram.
A. Ishikawa
B. Pareto
C. Flow
D. Control
14. Management has asked you to define the correlation between quality and the project scope. Which of the following is the best answer?
A. The project scope will include metrics for quality.
B. Quality metrics will be applied to the project scope.
C. Quality is the process of completing the scope to meet stated or implied needs.
D. Quality is the process of evaluating the project scope to ensure quality exists.
15. Quality is about conforming to requirement and the deliverables’ fitness for use. Quality also has some attributes that must be considered as part of the project planning, project costs, and the project schedule. Considering these factors, which of the following is most true about quality?
A. It will cost more money to build quality into the project.
B. It will cost less money to build quality into the project process.
C. Quality is inspection-driven.
D. Quality is prevention-driven.
16. Which of the following can be described as a business philosophy to find methods that will continuously improve products, services, and business practices?
A. TQM
B. ASQ
C. QA
D. QC
17. Yolanda is the project manager for her company and she’s working with the project team to identify errors in the project deliverables. As part of the process, Yolanda and the team must calculate the cost of the error, the materials, the time, and the cost to redo the work. In this instance, in regard to quality management, which of the following is not an attribute of failure costs that Yolanda will need to consider?
A. Loss of customers
B. Downtime
C. Safety measures
D. Rework
18. You are the project manager for the KOY Project, which requires quality that maps to federal guidelines. To ensure that you can meet these standards, you have elected to put the project team through training specific to the federal guidelines to which your project must adhere. The costs of these classes can be assigned to which of the following?
A. Cost of doing business
B. Cost of quality
C. Cost of adherence
D. Cost of nonconformance
19. You are the project manager for the KOY Project, which requires quality that maps to federal guidelines. During a quality audit, you discover that a portion of the project work is faulty and must be redone. The requirement to correct the work is an example of which of the following?
A. Prevention cost
B. Appraisal cost
C. Failure cost
D. Cost of doing business
20. You are the project manager of the GHQ Project. Your organization has a requirement that you use only the seven basic quality tools. Which one of the following is not one of the seven basic quality tools?
A. Cause-and-effect diagram
B. Histogram
C. Control chart
D. Network diagrams
21. You are the project manager of the JKL Project, which currently has some production flaws. Which analysis tool will enable you to determine the cause and effect of the production faults?
A. A flowchart
B. A Pareto diagram
C. An Ishikawa diagram
D. A control chart
22. Linda is the project manager of a manufacturing project. She and her project team are using root-cause analysis. How will Linda know they have found the root cause?
A. She will never know because root-cause analysis creates a hypothesis of causes.
B. When she has asked why seven times she will find the root cause.
C. When the root causes are removed and the problem doesn’t recur.
D. When she has found three root causes that are linked by process design.
23. You are the project manager of the Global Upgrade Project. Your project team consists of 75 project team members around the world. Each project team will be upgrading a piece of equipment in many different facilities. Which of the following could you implement to ensure that the project team members are completing all the steps in the install procedure with quality?
A. Checklists
B. WBS
C. PND
D. The WBS dictionary
24. Mark is the project manager of the PMH Project. Quality audits of the deliverables show several problems. Management has asked Mark to create a chart showing the distribution of problems and their frequencies. Given this, management wants which of the following?
A. A control chart
B. An Ishikawa diagram
C. A Pareto diagram
D. A flowchart
25. You are the project manager of the NHH Project for your company and you’re reviewing the results of quality control. In your analysis, you’ve created a quality control chart. In the following graphic, what does the highlighted area represent?
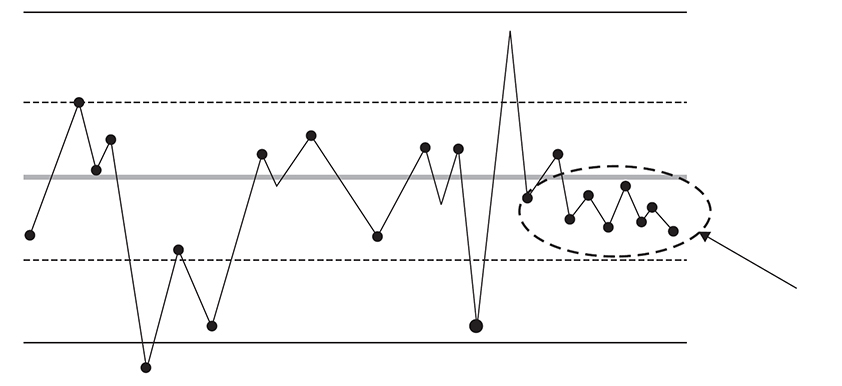
A. Out-of-control data points
B. In-control data points
C. The Rule of Seven
D. Standard deviation
 SELF TEST ANSWERS
1. Gary is the project manager of the HBB Project for his organization. He’s working with project customers to define the specifics of the project requirements, the project scope, and the defined product scope to help define the quality of the project. The customer asks Gary who is responsible for the quality of the project deliverables. Which of the following is responsible for managing quality?
A. The project champion
B. The project team
C. Stakeholders
D. Everyone
![]() B. The project team (the individuals completing the project work) is responsible for the quality of the project deliverables.
B. The project team (the individuals completing the project work) is responsible for the quality of the project deliverables.
![]() A, C, and D are incorrect. A is incorrect because the project champion may review the work, but the responsibility of quality does not lie only with this individual. C and D are also incorrect choices; the stakeholders are not solely responsible for the quality of the project, and everyone can’t be solely responsible.
A, C, and D are incorrect. A is incorrect because the project champion may review the work, but the responsibility of quality does not lie only with this individual. C and D are also incorrect choices; the stakeholders are not solely responsible for the quality of the project, and everyone can’t be solely responsible.
2. As a PMP candidate, you’ll need to recognize all the quality control charts and their usage. What type of chart is the following?

A. Control
B. Pareto
C. Scatter
D. Flow
![]() A. The chart shown is a control chart.
A. The chart shown is a control chart.
![]() B, C, and D are incorrect. B is incorrect because a Pareto diagram maps categories of issues and their frequency. C is incorrect because a scatter chart compares common values across multiple categories. D, a flowchart, is also incorrect. Flowcharts illustrate how a process moves through a system and how the components are interrelated.
B, C, and D are incorrect. B is incorrect because a Pareto diagram maps categories of issues and their frequency. C is incorrect because a scatter chart compares common values across multiple categories. D, a flowchart, is also incorrect. Flowcharts illustrate how a process moves through a system and how the components are interrelated.
3. You are the project manager for the BBB Project. Stacy, a project team member, is confused about what QA is. You need all the project team members and the project stakeholders to be clear on the quality management processes. To help Stacy, which of the following best describes QA?
A. QA is quality assurance for the overall project performance.
B. QA is quality acceptance according to scope verification.
C. QA is quality assurance for the project deliverable.
D. QA is quality assurance for the project stakeholders.
![]() A. QA is concerned with overall project quality performance.
A. QA is concerned with overall project quality performance.
![]() B, C, and D are incorrect. They do not correctly explain quality assurance.
B, C, and D are incorrect. They do not correctly explain quality assurance.
4. You are the project manager for the Photo Scanning Project. This project is similar to another project you have completed. Your project is to store thousands of historical photos electronically for your city’s historical society. Quality is paramount on this project. Management approaches you and asks why you have devoted so much of the project time for planning. Your response is which of the following?
A. This is a first-time, first-use project, so more time is needed for planning.
B. Planning for a project of this size, with this amount of quality, is mandatory.
C. Quality is planned into a project, not inspected in.
D. Quality audits are part of the planning time.
![]() C. Of all the choices presented, this is the best answer. Quality is planned into the project, and the planning requires time.
C. Of all the choices presented, this is the best answer. Quality is planned into the project, and the planning requires time.
![]() A, B, and D are incorrect. A is incorrect because a project of this nature has been completed before. B is incorrect because there isn’t enough information provided to determine the quality demands of the project. D is incorrect because quality audits are not part of the planning processes.
A, B, and D are incorrect. A is incorrect because a project of this nature has been completed before. B is incorrect because there isn’t enough information provided to determine the quality demands of the project. D is incorrect because quality audits are not part of the planning processes.
5. You are the project manager for the Floor Installation Project. Today you will meet with your project team to ensure that the project is completed with no deviations from the project requirements. This process is which of the following?
A. Quality planning
B. Quality management
C. Quality control
D. Quality assurance
![]() A. Quality planning should be completed prior to the work beginning—and should thereafter be revisited as needed.
A. Quality planning should be completed prior to the work beginning—and should thereafter be revisited as needed.
![]() B, C, and D are incorrect. B is incorrect because quality management is not an applicable answer to the scenario. C and D are incorrect because QC and QA are part of quality management.
B, C, and D are incorrect. B is incorrect because quality management is not an applicable answer to the scenario. C and D are incorrect because QC and QA are part of quality management.
6. You are the project manager for the ASE Project, which must map to industry standards in order to be accepted by the customer. You and your team have studied the requirements and have created a plan to implement the deliverables with the appropriate level of quality. What is this process called?
A. Quality planning
B. Quality management
C. Quality control
D. Quality assurance
![]() A. Quality planning is the process of creating a plan to meet the requirements of quality.
A. Quality planning is the process of creating a plan to meet the requirements of quality.
![]() B, C, and D are incorrect. They do not explain the process in the question’s scenario.
B, C, and D are incorrect. They do not explain the process in the question’s scenario.
7. You are the project manager of the NHQ Project, which is part of the HQQ Program to construct a condominium building. Samuel, the program manager, has required that you document any variances to costs, schedule, scope, and quality expectations as part of the program governance. You believe that your project team now has an internal failure cost that needs to be documented for Samuel. Which of the following is an example of internal failure cost?
A. Rework
B. Quality audits
C. Random quality audits
D. Project team training
![]() A. Internal failure cost is attributed to failure that results in rework. It is an example of the cost of nonconformance to quality.
A. Internal failure cost is attributed to failure that results in rework. It is an example of the cost of nonconformance to quality.
![]() B, C, and D are incorrect. B and C are incorrect because quality audits are not a cost associated with nonconformance. D is incorrect because project team training is an example of the cost of conformance to quality.
B, C, and D are incorrect. B and C are incorrect because quality audits are not a cost associated with nonconformance. D is incorrect because project team training is an example of the cost of conformance to quality.
8. Quality assurance is an organization-wide initiative and is part of your enterprise environmental factors. All projects must adhere to the quality assurance initiatives in your company. Within your project, however, you also have quality assurance efforts and you have quality control efforts. Quality control is typically a(n) _______________ process.
A. Management
B. Project manager
C. Audit
D. Inspection
![]() D. QC requires an inspection of the work results. Although quality is planned into a project, inspections ensure it exists.
D. QC requires an inspection of the work results. Although quality is planned into a project, inspections ensure it exists.
![]() A, B, and C are incorrect. A is incorrect because QA is a managerial function, not QC. B is incorrect because another department, team member, or SME can complete QC. C is incorrect; an audit is too broad an answer for this question. Audits can be financially driven, schedule-driven, or quality-driven.
A, B, and C are incorrect. A is incorrect because QA is a managerial function, not QC. B is incorrect because another department, team member, or SME can complete QC. C is incorrect; an audit is too broad an answer for this question. Audits can be financially driven, schedule-driven, or quality-driven.
9. Quality assurance is an organization-wide initiative and is part of your enterprise environmental factors. All projects must adhere to the quality assurance initiatives in your company. Within your project, however, you also have quality assurance efforts and you have quality control efforts. Managing quality is typically a(n) _______________ process.
A. Executing
B. Project manager
C. Audit
D. Inspection
![]() A. Managing quality is typically an executing process.
A. Managing quality is typically an executing process.
![]() B, C, and D are incorrect. B is incorrect because another department, team member, or SME can complete QC. C is incorrect because an audit is too broad of an answer for this question. Audits can be financially driven, schedule-driven, or quality-driven. D is incorrect because QA is typically not an inspection process.
B, C, and D are incorrect. B is incorrect because another department, team member, or SME can complete QC. C is incorrect because an audit is too broad of an answer for this question. Audits can be financially driven, schedule-driven, or quality-driven. D is incorrect because QA is typically not an inspection process.
10. You are the project manager for a large manufacturer of wood furniture. Your new project is the Shop Table Project, which will involve the creation and manufacture of a new table for woodworkers to use in their wood shops. For this project, you have elected to use JIT for scheduling. Which of the following is an advantage to using JIT?
A. It requires materials to be readily available.
B. It enables the project team to have control over the materials.
C. It decreases the inventory investment.
D. It allows for a broad range of deviation compared to other inventory solutions.
![]() C. JIT (just-in-time) scheduling decreases the investment in inventory. However, mistakes with the materials can cause downtime if no additional materials are on hand.
C. JIT (just-in-time) scheduling decreases the investment in inventory. However, mistakes with the materials can cause downtime if no additional materials are on hand.
![]() A, B, and D are incorrect. A is incorrect because materials are available only when they’re needed. B is incorrect; the project team must use caution not to waste the materials. D is incorrect because JIT does not allow for a broad range of deviation.
A, B, and D are incorrect. A is incorrect because materials are available only when they’re needed. B is incorrect; the project team must use caution not to waste the materials. D is incorrect because JIT does not allow for a broad range of deviation.
11. You are the project manager of the HHQ Project for your company. Your company is a manufacturer of paper products. Your company has elected to use ISO 9000 standards. What is an attribute of ISO 9000?
A. It ensures that your company follows its own quality procedures.
B. It ensures that your company follows the set phases in each project from initiation to closure.
C. It ensures that your company maps its processes to a proven process within the program.
D. It ensures that QA and QC are integrated into the product or service your organization offers.
![]() A. ISO 9000 is not a quality management system, but a system to ensure that an organization follows its own quality procedures.
A. ISO 9000 is not a quality management system, but a system to ensure that an organization follows its own quality procedures.
![]() B, C, and D are incorrect. These choices do not correctly describe ISO 9000.
B, C, and D are incorrect. These choices do not correctly describe ISO 9000.
12. You are the project manager of the Halogen Installation Project. As this project gets underway, you receive notice from the program manager that the organization will be moving to a Kaizen methodology as part of its quality management program. What is a Kaizen methodology?
A. Small improvements for small results
B. Small improvements for all projects
C. Small process and product improvements that are carried out on a continuous basis
D. Small process improvements that are made to shorten the project duration
![]() C. Kaizen technologies are small changes to processes and products on a steady, continuous basis to save costs and improve quality.
C. Kaizen technologies are small changes to processes and products on a steady, continuous basis to save costs and improve quality.
![]() A, B, and D are incorrect. A is incorrect. Although Kaizen does implement small process changes, it does not aim for small results. B and D are also incorrect. Kaizen does not have to be implemented in all projects, although it often is. Kaizen is also not interested in necessarily reducing the project duration.
A, B, and D are incorrect. A is incorrect. Although Kaizen does implement small process changes, it does not aim for small results. B and D are also incorrect. Kaizen does not have to be implemented in all projects, although it often is. Kaizen is also not interested in necessarily reducing the project duration.
13. Holly Ann is a project manager for her organization. She is working with Jeff, the manufacturing rep, to analyze the errors in the deliverables as part of their quality control approach. Jeff recommends that they create a fishbone diagram to help analyze the problem. A fishbone diagram is the same as a(n) _______________ diagram.
A. Ishikawa
B. Pareto
C. Flow
D. Control
![]() A. A fishbone diagram is the same as an Ishikawa diagram, also called a why-why chart.
A. A fishbone diagram is the same as an Ishikawa diagram, also called a why-why chart.
![]() B, C, and D are incorrect. These charts and diagrams accomplish goals other than the cause-and-effect of the Ishikawa.
B, C, and D are incorrect. These charts and diagrams accomplish goals other than the cause-and-effect of the Ishikawa.
14. Management has asked you to define the correlation between quality and the project scope. Which of the following is the best answer?
A. The project scope will include metrics for quality.
B. Quality metrics will be applied to the project scope.
C. Quality is the process of completing the scope to meet stated or implied needs.
D. Quality is the process of evaluating the project scope to ensure quality exists.
![]() C. Quality, with regard to the project scope, is about completing the work as promised and defined in the project scope. It is what the customer is expecting as part of the project deliverables.
C. Quality, with regard to the project scope, is about completing the work as promised and defined in the project scope. It is what the customer is expecting as part of the project deliverables.
![]() A, B, and D are incorrect. A and B are incorrect because although the project scope will have requirements for acceptance, it may not have metrics for quality defined. D is also incorrect, because this statement defines quality control, as you and the project team will inspect the results of the work that creates the project scope to determine if quality exists within the project.
A, B, and D are incorrect. A and B are incorrect because although the project scope will have requirements for acceptance, it may not have metrics for quality defined. D is also incorrect, because this statement defines quality control, as you and the project team will inspect the results of the work that creates the project scope to determine if quality exists within the project.
15. Quality is about conforming to requirement and the deliverables’ fitness for use. Quality also has some attributes that must be considered as part of the project planning, project costs, and the project schedule. Considering these factors, which of the following is most true about quality?
A. It will cost more money to build quality into the project.
B. It will cost less money to build quality into the project process.
C. Quality is inspection-driven.
D. Quality is prevention-driven.
![]() D. Quality is prevention-driven. Quality wants to complete the work correctly the first time to prevent poor results, a loss of time, and a loss of funds.
D. Quality is prevention-driven. Quality wants to complete the work correctly the first time to prevent poor results, a loss of time, and a loss of funds.
![]() A, B, and C are incorrect. A and B are incorrect because there is no guarantee that a project will cost more or less, depending on the amount of expected quality. Incidentally, lack of quality will likely cost more than quality planning because of the cost of nonconformance. C is incorrect because quality is planned into a project, not inspected in.
A, B, and C are incorrect. A and B are incorrect because there is no guarantee that a project will cost more or less, depending on the amount of expected quality. Incidentally, lack of quality will likely cost more than quality planning because of the cost of nonconformance. C is incorrect because quality is planned into a project, not inspected in.
16. Which of the following can be described as a business philosophy to find methods that will continuously improve products, services, and business practices?
A. TQM
B. ASQ
C. QA
D. QC
![]() A. TQM, total quality management, is a business philosophy to find methods that will continuously improve products, services, and business practices.
A. TQM, total quality management, is a business philosophy to find methods that will continuously improve products, services, and business practices.
![]() B, C, and D are incorrect. B, ASQ (American Society of Quality), is not a business philosophy. C and D are attributes of TQM but are incorrect answers for this question.
B, C, and D are incorrect. B, ASQ (American Society of Quality), is not a business philosophy. C and D are attributes of TQM but are incorrect answers for this question.
17. Yolanda is the project manager for her company and she’s working with the project team to identify errors in the project deliverables. As part of the process, Yolanda and the team must calculate the cost of the error, the materials, the time, and the cost to redo the work. In this instance, in regard to quality management, which of the following is not an attribute of failure costs that Yolanda will need to consider?
A. Loss of customers
B. Downtime
C. Safety measures
D. Rework
![]() C. A safety measure is not an attribute of the cost of nonconformance, but rather a prevention cost.
C. A safety measure is not an attribute of the cost of nonconformance, but rather a prevention cost.
![]() A, B, and D are incorrect. These are all attributes of the cost of nonconformance.
A, B, and D are incorrect. These are all attributes of the cost of nonconformance.
18. You are the project manager for the KOY Project, which requires quality that maps to federal guidelines. To ensure that you can meet these standards, you have elected to put the project team through training specific to the federal guidelines to which your project must adhere. The costs of these classes can be assigned to which of the following?
A. Cost of doing business
B. Cost of quality
C. Cost of adherence
D. Cost of nonconformance
![]() B. Training to meet the quality expectations is attributed to the cost of quality.
B. Training to meet the quality expectations is attributed to the cost of quality.
![]() A, C, and D are incorrect. These choices do not describe training as a cost of quality.
A, C, and D are incorrect. These choices do not describe training as a cost of quality.
19. You are the project manager for the KOY Project, which requires quality that maps to federal guidelines. During a quality audit, you discover that a portion of the project work is faulty and must be redone. The requirement to correct the work is an example of which of the following?
A. Prevention cost
B. Appraisal cost
C. Failure cost
D. Cost of doing business
![]() C. When project work results are faulty and must be redone, it is attributed to the cost of nonconformance to quality, which is a failure cost.
C. When project work results are faulty and must be redone, it is attributed to the cost of nonconformance to quality, which is a failure cost.
![]() A, B, and D are incorrect. These values do not describe faulty work or the cost of nonconformance.
A, B, and D are incorrect. These values do not describe faulty work or the cost of nonconformance.
20. You are the project manager of the GHQ Project. Your organization has a requirement that you use only the seven basic quality tools. Which one of the following is not one of the seven basic quality tools?
A. Cause-and-effect diagram
B. Histogram
C. Control chart
D. Network diagrams
![]() D. Network diagrams are not part of the seven basic quality tools. The tools are cause-and-effect diagrams, flowcharts, checksheets, Pareto diagrams, histograms, control charts, and scatter diagrams.
D. Network diagrams are not part of the seven basic quality tools. The tools are cause-and-effect diagrams, flowcharts, checksheets, Pareto diagrams, histograms, control charts, and scatter diagrams.
![]() A, B, and C are incorrect. These answers are three of the seven basic quality tools.
A, B, and C are incorrect. These answers are three of the seven basic quality tools.
21. You are the project manager of the JKL Project, which currently has some production flaws. Which analysis tool will enable you to determine the cause and effect of the production faults?
A. A flowchart
B. A Pareto diagram
C. An Ishikawa diagram
D. A control chart
![]() C. The key words “cause and effect” equate to the Ishikawa diagram.
C. The key words “cause and effect” equate to the Ishikawa diagram.
![]() A, B, and D are incorrect. A, a flowchart, will show how a process moves through the system, but it won’t show the cause and effect of the problems involved. B is incorrect because a Pareto chart maps out the causes and frequency of problems. D, a control chart, plots out the results of sampling but doesn’t show the cause and effect of problems.
A, B, and D are incorrect. A, a flowchart, will show how a process moves through the system, but it won’t show the cause and effect of the problems involved. B is incorrect because a Pareto chart maps out the causes and frequency of problems. D, a control chart, plots out the results of sampling but doesn’t show the cause and effect of problems.
22. Linda is the project manager of a manufacturing project. She and her project team are using root-cause analysis. How will Linda know they have found the root cause?
A. She will never know because root-cause analysis creates a hypothesis of causes.
B. When she has asked why seven times she will find the root cause.
C. When the root causes are removed and the problem doesn’t recur.
D. When she has found three root causes that are linked by process design.
![]() C. Of all the choices presented, C is the best choice. When Linda removes the root causes, the problem will not recur and she will know that she has found the root causes to the problem.
C. Of all the choices presented, C is the best choice. When Linda removes the root causes, the problem will not recur and she will know that she has found the root causes to the problem.
![]() A, B, and D are incorrect. A is incorrect because she will know when the root causes are found by the problem not recurring. B and D are also incorrect because these are not valid statements about root cause analysis.
A, B, and D are incorrect. A is incorrect because she will know when the root causes are found by the problem not recurring. B and D are also incorrect because these are not valid statements about root cause analysis.
23. You are the project manager of the Global Upgrade Project. Your project team consists of 75 project team members around the world. Each project team will be upgrading a piece of equipment in many different facilities. Which of the following could you implement to ensure that the project team members are completing all the steps in the install procedure with quality?
A. Checklists
B. WBS
C. PND
D. The WBS dictionary
![]() A. Checklists are simple but effective quality management tools that the project manager can use to ensure that the project team is completing the required work.
A. Checklists are simple but effective quality management tools that the project manager can use to ensure that the project team is completing the required work.
![]() B, C, and D are incorrect. The WBS, PND, and WBS dictionary are not tools the project team can necessarily use to prove they’ve completed required work. Checklists are the best approach for this scenario.
B, C, and D are incorrect. The WBS, PND, and WBS dictionary are not tools the project team can necessarily use to prove they’ve completed required work. Checklists are the best approach for this scenario.
24. Mark is the project manager of the PMH Project. Quality audits of the deliverables show several problems. Management has asked Mark to create a chart showing the distribution of problems and their frequencies. Given this, management wants which of the following?
A. A control chart
B. An Ishikawa diagram
C. A Pareto diagram
D. A flowchart
![]() C. Management wants Mark to create a Pareto diagram. Recall that a Pareto diagram maps out the causes of defects and illustrates their frequency.
C. Management wants Mark to create a Pareto diagram. Recall that a Pareto diagram maps out the causes of defects and illustrates their frequency.
![]() A, B, and D are incorrect. A is incorrect because a control chart does not identify the problems, only the relationship of the results to the expected mean. B is incorrect because an Ishikawa diagram does not map out the frequency of problems. D is also incorrect. Flowcharts show how a process moves through a system and how the components are related.
A, B, and D are incorrect. A is incorrect because a control chart does not identify the problems, only the relationship of the results to the expected mean. B is incorrect because an Ishikawa diagram does not map out the frequency of problems. D is also incorrect. Flowcharts show how a process moves through a system and how the components are related.
25. You are the project manager of the NHH Project for your company and you’re reviewing the results of quality control. In your analysis you’ve created a quality control chart. In the following graphic, what does the highlighted area represent?

A. Out-of-control data points
B. In-control data points
C. The Rule of Seven
D. Standard deviation
![]() C. The highlighted area shows seven consecutive sampling results all on one side of the mean. This is known as the Rule of Seven and is an assignable cause.
C. The highlighted area shows seven consecutive sampling results all on one side of the mean. This is known as the Rule of Seven and is an assignable cause.
![]() A, B, and D are incorrect. A is incorrect because these values are in control. B is correct, but it does not fully answer the question as well as choice C. D is incorrect because standard deviation is a predicted measure of the variance from the expected mean of a sampling.
A, B, and D are incorrect. A is incorrect because these values are in control. B is correct, but it does not fully answer the question as well as choice C. D is incorrect because standard deviation is a predicted measure of the variance from the expected mean of a sampling.