
Exploring the Architecture Explorer
Using the Architecture Explorer to understand existing code
Visualizing existing code using dependency graphs
Every software developer has been in the following situation at some point and time. You have just started a new job with a new company, expecting to come in and write some brand new, fancy application. You are up to speed on some of the latest coding technologies, methodologies, and languages. You arrive for work ready to sit down and use everything you know to crank out some brand new code to help the company succeed.
And then it happens. There is a legacy system that was built several years ago that must be updated. And you are the lucky developer who has been assigned to make that update. Never mind that you have no idea or concept of how the application works, the inner workings of the calls between different objects, or how it interacts with other third-party add-ins.
Before Visual Studio 2010 Ultimate, the only solution to this problem was to get your hands dirty in the code. You would have to open up the code files and start tracing (as best you could) how the logic flows between the different classes and components that make up the application. Maybe you would even try (as best you could) to diagram out the logic flow on a piece of scratch paper.
Visual Studio 2010 Ultimate changes all that with the introduction of the Architecture Explorer tool. Using Architecture Explorer, you can quickly learn more about your current application by visualizing the organization and relationships among the various parts. By using Architecture Explorer in conjunction with dependency graphs, a developer is able to analyze an existing system and quickly understand it. These tools also allow the developer to find areas in the application that should be improved or modified.
This chapter examines both Architecture Explorer and dependency graphs. The chapter begins with a discussion about the Architecture Explorer tool, what it is, and how it was designed to be used. From there, you will learn about using Architecture Explorer and how it can be used to drill down into your existing application.
After that, you will learn how to take the information from Architecture Explorer and make it graphical by turning it into a dependency diagram. Dependency diagrams are a nice way to graphically view your code, as well as code contained in other managed DLLs (such as the .NET Framework).
Though the example used through this chapter is rather simplistic, it works well to introduce the different capabilities of Architecture Explorer and dependency diagrams. So, let's take a look at the code base you will be using throughout this chapter, so that later sections will make more sense.
Figure 4-1 shows the projects and code files that make up the sample solution.
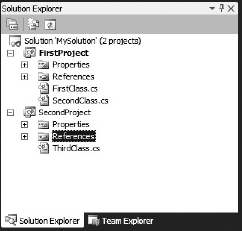
This solution is made up of two project files:
FirstProject— This project contains two class files,FirstClass.csandSecondClass.cs. TheFirstClass.csclass file contains two methods,Method1andMethod2. TheSecondClass.csclass file contains one method,Method3.SecondProject— This project contains one class file,ThirdClass.cs. TheThirdClass.csclass file contains three methods:Method4,Method5, andMethod6.
Getting confused yet? Let's add to it a little more:
Method1callsMethod3andMethod2Method2callsMethod1Method3doesn't call any other methodsMethod4callsMethod1Method5callsMethod3Method6doesn't call any other methods
Whew! All of that sounds just a little bit confusing, and this is only a contrived solution with two projects and three classes. Imagine what it would seem like with a real software solution with hundreds of projects and thousands of classes and methods. As you are about to learn, though, Architecture Explorer and dependency graphs are going to help with the understanding of any project, both small and large.
In Visual Studio 2010 Ultimate, Architecture Explorer is used to drill down into your existing code, allowing you to select the code you want to visualize using a dependency graph. Architecture Explorer can be used to browse existing source code open in Visual Studio 2010 Ultimate, as well as compiled managed code located in .dll or .exe files. Architecture Explorer can be extended by third parties, providing the capability to browse other domains of code or other items. Once you have drilled down into your code and selected the items you are interested in, you can turn that information into a dependency graph.
Architecture Explorer is only available in the Visual Studio 2010 Ultimate. To open Architecture Explorer, open Visual Studio 2010 Ultimate. From the main menu of Visual Studio, select View
Note
The shortcut keys for opening Architecture Explorer are Ctrl+ and Ctrl+R.
Figure 4-2 shows an initial view of Architecture Explorer.

Architecture Explorer represents structures as nodes, and relationships as links. As you browse through your code base using Architecture Explorer, nodes will be displayed in successive columns to the right. The first column in Figure 4-2 shows the initial domains and views that are available for browsing. Selecting a domain or view will cause a new node to appear to the right, with the results of that selection.
Note
You can browse all the way to the level of statements for Visual C# and Visual Basic projects. For other languages, you can browse to the procedure level.
When you select a node in a column, the next column will show node information that is logically related to the selection made in the initial column. For example, selecting a class in a column will show the members of that class in the following column. You have the capability to select multiple nodes in multiple columns and then display that information as a dependency graph.
As you can see in Figure 4-2, there are five options (represented as icons) available on the left side of the Architecture Explorer window.
The first option provides the capability to create a new dependency graph document from all the nodes currently selected in Architecture Explorer. To include only the nodes in the current column, you can press and hold the Ctrl key before clicking this option.
The second option enables you to add the selected nodes from Architecture Explorer to an existing dependency graph that is currently visible in Visual Studio. As with the first option, to include only the nodes that are in the current column, you can press and hold the Ctrl key before clicking this option.
The third option enables you to export the information from Architecture Explorer into a .dgml file. A Directed Graph Markup Language (DGML) file is the XML schema used to define a dependency graph. Selecting this option will export all the information open in all the columns into a .dgml file that can be viewed at a later date.
The fourth option resets Architecture Explorer to its initial state, cleaning up the window and allowing you to start from the beginning.
As you drill down into the architecture of your application using Architecture Explorer, behind the scenes, Visual Studio is keeping track of what you do by creating a query using a new language called the Directed Graph Query Language (DGQL). There will be times when you want to return Architecture Explorer to a certain state, drilled down to a certain level. This is accomplished by using the fifth option on the toolbar, which allows you to save the state of Architecture Explorer as a query that can be re-run at a later time.
To begin navigating through Architecture Explorer, select one of the rows in the first column. You have several options.
Under the column heading, Visual Studio, you can choose to view the information in your solution either by classes or through a solution view, which allows you to view the different files in your solution. If you don't want to drill down through all the files in a solution, you can click the Select Files option and open just the files you are interested in.
Optionally, you can open and run a saved DGQL query. You can choose to open a query that has been saved in the current solution, or a query that has been saved to a shared folder. Opening the query will run the query, and set Architecture Explorer to the appropriate state.
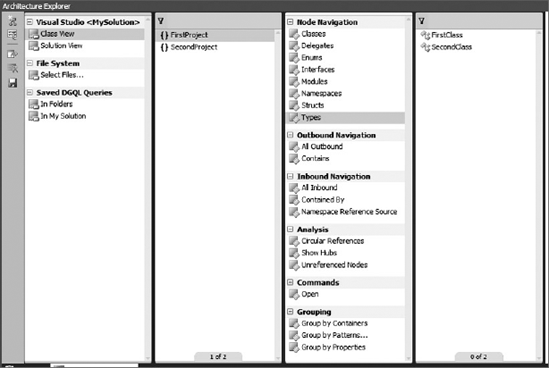
For this example, let's navigate through the code using the Class View options. In Architecture Explorer, select Class View under Visual Studio <My Solution>. This opens a new column to the right of the selected column, displaying a list of all the different namespaces in the solution, as shown in Figure 4-3.
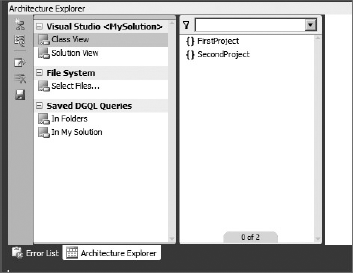
In Figure 4-3, you see that the two namespaces currently in the solution (FirstProject and SecondProject) are displayed on the right of the screen.
Obviously, for a large project, you could have many namespaces, which could result in a large scrolling list in this column. The list box at the top of the column enables you to filter the information in this column. For example, if you only wanted to see namespaces that began with the "Second," you could type Second in the list box, press Enter, and the contents of the column would be filtered, as shown in Figure 4-4.
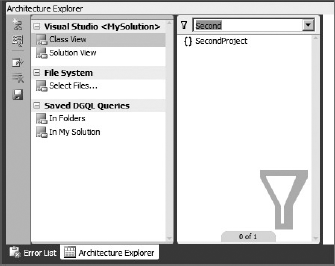
Notice the differences between Figure 4-3 and Figure 4-4. Figure 4-3 displays all the namespaces in the solution. Figure 4-4 displays only the namespaces that match the filter expression. Also, notice the filter icon that is added in the lower right of the column, giving a visual indication that the column is currently being filtered.
Note
When you type in a filter, a substring search is performed. For example, if you enter c for the filter statement, it will match on both FirstProject and SecondProject.
To clear the filtering on a column, simply delete the filter statement and press Enter. This will remove the filter and display the entire contents of the column.
From the namespace column, you can navigate into the different classes contained in a particular namespace. Selecting the FirstProject namespace opens a new column to the right, containing the classes contained in the FirstProject namespace — in this case, FirstClass and SecondClass. As mentioned previously, you have the capability to filter on this column by entering your filter criteria into the list box at the top of the column. You also have the capability to filter based on different categories and properties.
Click the filter button located to the left of the filter list box at the top of the column. This displays all the possible categories and properties that can be filtered on, as shown in Figure 4-5.
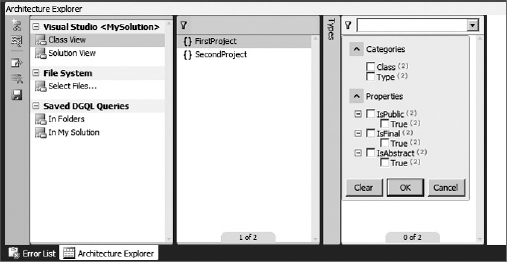
For this particular column on classes, you have the following filter options:
Class
Type
IsPublic
IsFinal
IsAbstract
IsInternal
You have the option of selecting one or multiple filter options, allowing you to drill down into the information contained in the column in a variety of ways.
In addition to the filtering options mentioned previously, you have another option for controlling what is displayed in a column. Notice in Figure 4-5, just to the left of the column containing the classes, there is a collapsed column with the name Types. Clicking on that collapsed column will expand it, as shown in Figure 4-6.
This column provides a variety of options for determining what is initially displayed in the column. The first section is the Node Navigation section. By default, the Types node is selected, which shows all the different available types — in this case, FirstClass and SecondClass. You have the capability to select the following nodes for display:
Classes
Delegates
Enums
Interfaces
Modules
Namespaces
Structs
Types
You can select multiple nodes by holding down the Ctrl key while you select the nodes. Each time you select a node, the column to the right will recalculate with the new data to display.
You have the capability to organize the link types into two categories: outbound and inbound. These categories describe the direction of the link in relation to the currently selected node.
An outbound link points from the currently selected node to the next related node. For example, say that you have currently selected the FirstProject namespace. If you select All Outbound under Outbound Navigation, the two classes, FirstClass and SecondClass, will be displayed. FirstClass and SecondClass exist in the FirstProject namespace, and, as such, are the next related nodes beneath the FirstProject namespace.
You have following options for Outbound Navigation:
All Outbound
Contains
An inbound link points from a previously related node to the currently selected node. For example, say that you have currently selected the FirstProject namespace. If you select All InBound under Inbound Navigation, the solution file MySolution will be displayed in the next column. MySolution exists above the FirstProject namespace from a hierarchical perspective.
The following options exist for Inbound Navigation:
All Inbound
Contained by
Namespace Reference Source
You also have the capability to perform Analysis and Grouping options. Using the Analysis options, you can look for circular references, or hubs (for example, classes) that are not being called or used. The Grouping options also allow you to group by container or properties or by using a pattern specified in a DGML file.
The following options exist for Analysis:
Circular References
Show Hubs
Unreferenced Nodes
The following options exist for Grouping:
Group by Containers
Group by Patterns
Group by Properties
Previously, you learned about some of the Node Navigation options from a namespace perspective. Let's continue the example by selecting the FirstClass class in Architecture Explorer to see what Node Navigation options are from a class perspective. Figure 4-7 shows Architecture Explorer after the FirstClass class has been selected.
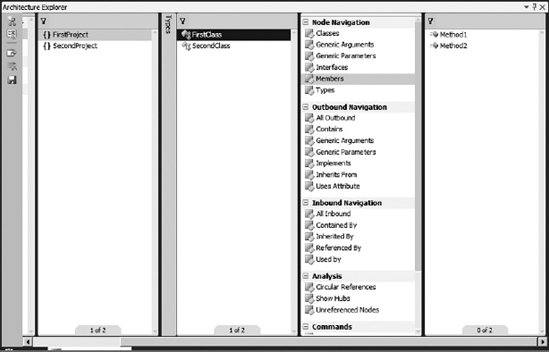
By default, Node Navigation defaults to Members. As you can see in Figure 4-7, FirstClass has only two members, two methods named Method1 and Method2. As you might expect, the filtering options at the top of the column work the same as they have in previous columns. However, now that you are working on a class level as opposed to a namespace level, you have different navigation options.
From the Node Navigation options, you can view any of the following information about the selected class:
Classes
Generic Arguments
Generic Parameters
Interfaces
Members
Types
Outbound Navigation has several more options available to it, as you would expect. Classes can inherit from other classes, implement interfaces, and have attributes. The following are the Outbound Navigation options:
Inbound Navigation also has more options, including the following:
All Inbound
Contained By
Inherited By
Referenced By
Used By
The Analysis patterns and Grouping options are the same as before.
In this example, let's drill down one more level by looking at some of the Node Navigation options available at a member level. In Architecture Explorer, let's select the Method1 method, as shown in Figure 4-8.
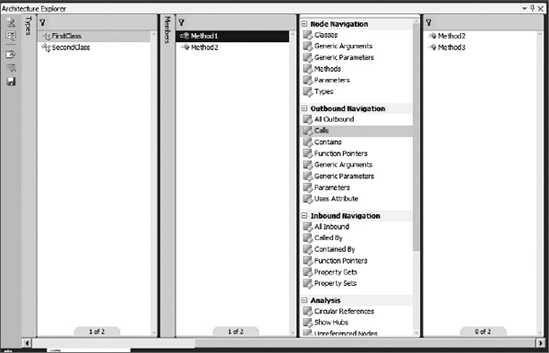
As you would expect, the Node Navigation options have changed again. By default, when you select a method, the resulting column in Architecture Explorer shows all the outbound calls that method makes (that is, all the methods that the selected method uses).
From a Node Navigation perspective, you can view any of the following information about the selected method:
Classes
Generic Arguments
Generic Parameters
Methods
Parameters
Types
Outbound Navigation has several more options available to it, as you would expect. The following are the Outbound Navigation options:
All Outbound
Calls
Contains
Function Pointers
Generic Arguments
Generic Parameters
Parameters
Uses Attribute
Inbound Navigation also has more options, including the following:
All Inbound
Called By
Contained By
Function Pointers
Property Gets
Property Sets
The Analysis patterns and Grouping options are the same as before.
As you continue to drill down into your code, Architecture Explorer will continue to expand to the right. As you can imagine, this could lead to a rather convoluted path through Architecture Explorer. Obviously, once you have found the information you are concerned with, it would be nice to be able to instantly return to that information, rather than have to drill all the way back down once more.
Architecture Explorer allows you to do this by saving your path through it as a DGQL query. To do this, in Architecture Explorer, click the "Save Query to Favorites" button. You will be prompted to save your query, which contains all the information you have selected and navigated through using Architecture Explorer.
By default, the query will be saved to My DocumentsVisual Studio 2010ArchitectureExplorerQueries. You can also save queries directly into your solution as well.
Note
By saving your queries with your solution, they can be placed into Team Foundation Version Control with the rest of your solution. This allows you to version-control your queries, as well as make the queries available to anyone who is using your solution file.
Figure 4-9 shows how you can access your queries using Architecture Explorer.
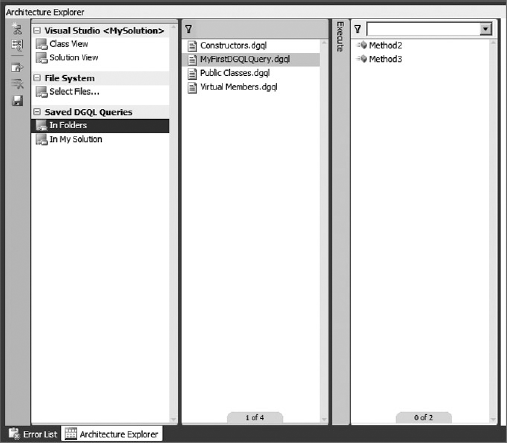
In the first column, under Saved DGQL queries, you can select either the In Folders or the In My Solution option. The In Folders option looks in the My DocumentsVisual Studio 2010ArchitectureExplorerQueries for DGQL queries, while the In My Solution option looks in your solution for any referenced queries.
They say a picture is worth a thousand words, and dependency graphs prove that saying. Architecture Explorer is invaluable for its capability to drill down into the code base. But it can also present so much information that it can be a bit overwhelming as well. Given its capability to continuously scroll to the right, you could become confused after doing an intense, deep drill-down. Wouldn't it be nice to be able to visualize the information from Architecture Explorer? Dependency graphs allow you to do just that.
A dependency graph can be used to explore the relationships and organization of an existing code base. These graphs make it easy to understand code that is new or unfamiliar to you. The relationships on the graph make it readily apparent how different areas of code relate to one another, and can show you how a change to one area of code could cause potential issues for other areas of the code. As you will see, you have multiple ways to view your dependency graph information.
Note
A dependency graph will show only those dependencies in code that have gone through a successful build. Any code that did not build successfully will not appear on the dependency graph.
Note
Dependency graphs are also referred to as directed graphs. The two terms are used interchangeably.
You actually have several different options for creating a dependency graph. Since the first half of this chapter has dealt with Architecture Explorer, let's will continue that thread, and show how you can create dependency graphs from Architecture Explorer. Later, you will learn how you can create dependency graphs without using Architecture Explorer to get a quick overview of your source code or compiled code.
Previously, using Architecture Explorer, you learned how to drill down into your source code. You saw how to select the FirstProject namespace, the FirstClass class, and the Method1 method. From here, let's select Method2 and Method3 in Architecture Explorer.
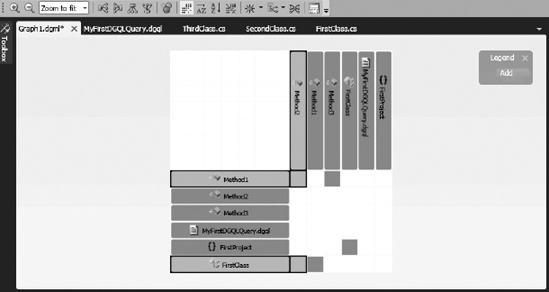
To display this information as a dependency graph, simply click the "Create A New Graph Document" button on the Architecture Explorer window. This will take all the information selected in Architecture Explorer and display it as a dependency graph, as shown in Figure 4-10.

As you can see, this graph provides an easy-to-understand graphical overview of the information contained in Architecture Explorer. You can see that the FirstProject namespace contains the FirstClass class. The FirstClass class contains two methods, Method1 and Method2. And Method1 makes references to both Method2 and Method3.
But the dependency graph can do much more than just show the layout of method calls. By hovering the mouse over a node in the graph, you can view detailed information about that node. Figure 4-11 shows the information that is displayed for Method1 when the mouse is hovered over the Method1 node.
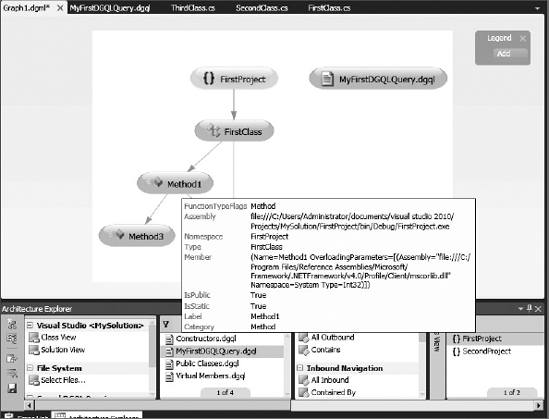
This information shows the type of function this is (in this case, a method). It shows the assembly where this method resides, along with namespace and type information. It also shows helpful information such as whether the method is static, and if it is a public or private method. All this information can help you understand your code base better, without having to open a code file.
However, if you want to view the code file for a particular node, that is easy to do from the dependency graph. You simply right-click on the node and select View Content from the context menu. This will open the code file associated with the selected node.
You can easily add more nodes to an existing dependency graph. Let's say you create an initial dependency graph using Architecture Explorer. Now, let's say that you want to add more nodes to the graph to make it more detailed. Select the nodes you want to add in Architecture Explorer, and then click the "Add Selected Nodes to Existing Graph" button on the left-hand side of the Architecture Explorer window. This adds the selected nodes to the existing graph.
You also have the capability to create a dependency graph without even opening Architecture Explorer. This can be very handy when you want to analyze the entire code base of your code, without having to worry about drilling down through particular elements using Architecture Explorer. For example, you can drag and drop a .NET assembly onto a blank diagram and it will automatically decompose the assembly for you.
From the main menu of Visual Studio 2010, select Architecture
By Assembly — This will add a node to the graph for each assembly element in your solution.
By Namespace — This will add a node for each namespace in your solution.
By Class — This will add a node for each class in your solution.
Custom — This allows you to select from a variety of options for what to include in your dependency graph, including assembly, namespace, and class.
Figure 4-12 shows an example of a dependency graph generated using the By Assembly option.

Each project will generate its own assemblies, which, in the example project, would be FirstProject.exe and SecondProject.exe. In addition, there is a reference to an Externals assembly, which includes the references and calls into the .NET Framework. Though the black-and-white picture may not show it well, the legend is color-coded to help you easily understand the different aspects of your dependency graph.
You may be thinking that the information shown in Figure 4-12 is nice, but it is not that helpful. It sure would be nice if you could drill down into the dependency graph, in a manner similar to how you drill down into information in Architecture Explorer. Well, guess what? You can!
By clicking the chevrons located at the top-right of a node, you can expand the node to view the detailed information in that node, as shown in Figure 4-13.
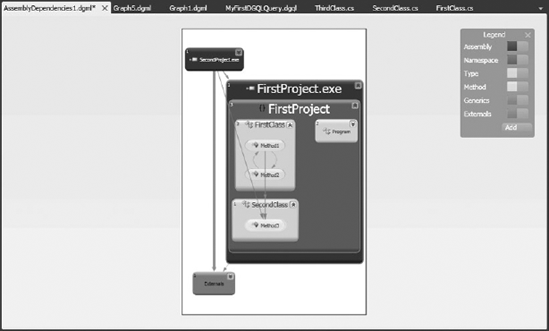
FirstProject.exe is comprised of the FirstProject namespace. The namespace contains three classes: FirstClass, SecondClass, and Program. FirstClass contains two methods, Method1 and Method2. SecondClass contains one method, Method3.
The dependency graph shows the interactions between the different methods. It also shows that the SecondProject.exe assembly makes calls to Method3 in the SecondClass class. To view exactly which object is making this call, you can expand the information for that assembly on the dependency graph.
Note
The information displayed in Figure 4-13 is the same information displayed in Figure 4-10, just in a different format. A dependency graph can be formatted using a variety of different options.
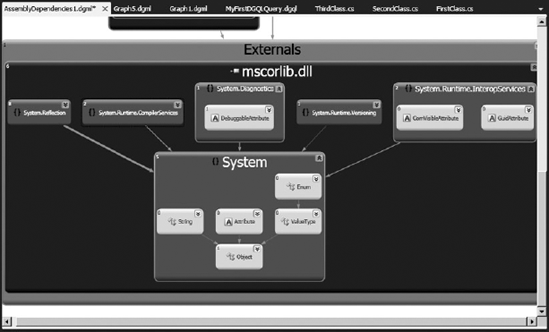
The next question you might have is whether you can drill down into that external node. The answer is, yes! Using a dependency graph, you can drill down into external assemblies (such as the .NET Framework). This is an incredibly powerful tool. You now have the capability to delve into the .NET Framework and map how all the objects and methods interact with each other, allowing you to come to a much better and deeper understanding of how the .NET Framework works. Figure 4-14 shows an example of this.
You also have the capability to interact with your dependency graph by right-clicking on the graph, and selecting from a variety of context menu options. You will recognize many of the options from Architecture Explorer. The exact options will depend on what is selected on the dependency graph.
You can select a specific node on a graph and then choose the Selection menu option from the context menu. This enables you to do the following:
Select all incoming links to the selected node
Select all outgoing links from the selected node
Select both incoming and outgoing links from the selected node
Select all connected nodes to the selected node
Select all children of the selected node
You have the capability to add groups and categories to the graph, enabling you to organize the graph in a more readable fashion.
Let's refer back to Figure 4-10 to show another nice feature of dependency graphs, which is the capability to apply different analyzers to the information on the graph. You saw these analyzers before when working with Architecture Explorer, but they make even more sense when seen in conjunction with the dependency graph.
Let's say you were to right-click on the graph shown in Figure 4-10, select Analyzer, and then select Circular References. This analyzer looks for circular references, or infinite loops, in your graph. When those references are found, it highlights them (in red) on the dependency graph, instantly bringing them to your attention, as shown in Figure 4-15.

A second analyzer that is available is the Show Hubs analyzer. This analyzer shows which hubs are in the top 25 percent of high-connected nodes. This is a quick-and-easy way to see which hubs are involved with a majority of the work in the application.
A third analyzer that is available is the Unreferences Nodes analyzer. This analyzer highlights any nodes that are not referenced by any other nodes. They are orphans. This is a good way to find areas of the code that are not being used, either because of oversight, or because they are no longer needed.
In the upper-right corner of each dependency graph is the legend (see Figure 4-10). The legend can be used to help you understand all the different components that make up the dependency graph. One nice feature of the legend is that it is completely customizable, allowing you to control the shapes and colors that are used on the graph, thus enabling you to customize the graph to your needs.
For the dependency graph shown in Figure 4-10, if you were to click the Add button on the legend, you would have the following four options that could be added to the graph:
Node Property
Node Category
Link Property
Link Category
Each of these options has sub-options underneath it that can be added to the legend. For Node Property, the options are the following:
IsAbstract
IsFinal
IsPublic
IsStatic
FunctionTypeFlags
Hub
StronglyConnected
For Node Category, the options are the following:
Class
Method
Namespace
Solution
Source File
For Link Property, the option is the following:
Circular Link
And, finally, for Link Category, the options are the following:
Calls
Contains
Once a new item has been added to the legend, its appearance can be customized. You can click on the icon in the legend and select from the following four customization options:
Background — This lets you select a color for the background of the node.
Stroke — This selects the color that outlines the node.
Foreground — This sets the text color in the node.
Icons — This allows you to select from a wide variety of icons to add into the node itself.
Figure 4-16 shows an example of a dependency graph that has been "spruced up" using these options.
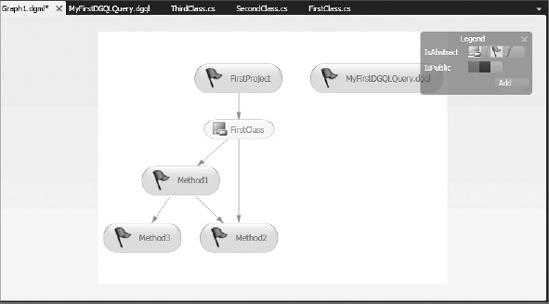
Figure 4-17 shows the dependency graph toolbar.
This toolbar can be used to modify the look and feel of a dependency graph. At the far left of the toolbar are the zoom controls. As you can imagine, a dependency graph can grow to be quite large. These tools allow you to zoom into and out of areas of the graph that you are interested in. The drop-down list box can be used to fit the graph to the page, or to select pre-specified zoom options.
The next five toolbar icons are used to specify the directional flow of the dependency graph. These options include (reading from left to right) left-to-right, right-to-left, top-to-bottom, and bottom-to-top. By default, the third option (a top-to-bottom flow) is used. Simply click the appropriate button on the toolbar, and the dependency graph will re-orient itself. The fifth option is the Force Directed Layout view. This view shows the nodes as clusters or hubs. In this view, the graph is arranged with the most-dependent nodes near the center, and the least-dependent nodes at the outer edges of the clusters of hubs.
The next four buttons allow any regular dependency graph to be turned into a matrix view. Select the Dependency Matrix View toolbar button to create a matrix view. Figure 4-18 shows an example of the Dependency Matrix View. This takes the information from the dependency graph and turns it into a matrix, where the intersecting portions of the matrix indicated interactions between the different nodes. The next two buttons are sort buttons (the buttons marked AZ), which can be used to change the sort order of the rows and columns in the dependency matrix. The final button of that group is the Show Reflexive View button, which shows a different take on the dependency matrix.
The next button on the toolbar provides the capability to control when cross-group links are shown. By default, cross-group links are shown only on selected nodes. Using this button, that can be changed to show all cross-group links on the graph, or to hide all cross-group links on the graph.
The next two buttons are extremely useful when dealing with large diagrams. The Neighborhood Browse Mode button allows you to show only those nodes that are a specific number of links away from a selected node. To turn on this mode, click this button, then select from the drop-down list the level of nodes you want to view. This allows you to take a large diagram and view it in more discrete chunks.
Next to the Neighborhood Browse Mode button is the Butterfly mode button. This button turns the graph into a butterfly tree view by hiding links that do not live on a path through the selected nodes.
Be careful, because circular links do not appear while in this mode. As well, dependencies that are more than one level away from the selected node will not necessarily appear in order. As with the Neighborhood Browse Mode, the Butterfly Mode is a good way of dealing with large diagrams, breaking them down to make them easier to understand.
This chapter examined both Architecture Explorer and dependency graphs. The chapter started off discussing Architecture Explorer, why you would want to use it, and how to use it. From there, you walked through an example of using Architecture Explorer, while learning about many of its features.
The discussion then moved on to dependency graphs. You learned how dependency graphs can be created with information from Architecture Explorer, as well as directly from solutions or compiled assemblies. You also learned about dependency graphs in depth and how to use all the options available.
Chapter 5 is the final chapter on the architecture tools available in Visual Studio 2010 Ultimate. Chapter 5 looks at layer diagrams, how they are built, and how they are useful in dividing your code base into understandable sections, as well as how they can be used as a validation tool during the build process.