
Chapter 2
Quality of Experience
First, this chapter presents the definitions and explanation of importance of Quality of Experience (QoE) in the network context. The Quality-of-Service (QoS)/QoE relationship and some QoE measurement methods will be also discussed. The state of art of different approaches for each layer will be described in detail.
2.1. Motivation
Nowadays, next-generation networks (NGN) trend includes deploying the fixed mobile Internet Convergence (FMIC) and migrating the traditional telecom networks to Internet Protocol (IP) technology. NGN will employ multiple networking technologies for the best network service. Network operators and service providers try to simplify network operations and management in order to offer multiple services over a single network. While NGN network experts are going to employ a common network layer protocol in core networks to accomplish the current network services, the access networks will use numerous technologies, such as WLAN, WPAN, Ethernet cable, DSL, 2G/3G/4G, LTE, WiMAX, UWB and optical fiber, to meet the diversified requirements of end users [ZHA 11]. Using a network environment with multiple operators and multiple networks, end users expect to use a heterogeneous wired and wireless high-bandwidth ubiquitous network access and diversified services. Hence, the end users have a multitude of offers that decrease service prices. Consequently, the competition between network providers increases. So, the customer is today in a strong position, being able to select between different competing providers. Apart from similar pricing schemes, which are a useful decision aid for users, their choices are also influenced by the expected and experienced quality. So, the interest of service providers in how users perceive usability, reliability, quality and price-worthiness has increased. As a result, the QoE notion has been introduced to help service providers to take into account user perception and satisfaction.
As mentioned in the Introduction, this book presents an adaptive end-to-end (E2E) QoE control model and applies it to a real infrastructure, the content distribution network (CDN), to construct a QoE-based content distribution network architecture (QCDNA). Before presenting our QCDNA, we need to clarify what QoE is and how important it is in the network context. Afterwards, it is also necessary to describe the CDN architecture to show the need of applying an E2E QoE model. Therefore, in this chapter, we survey the QoE notion in the networking context.
2.2. QoE concept
The era of user-centered network service has begun, where user perception plays a key role in the entire system. The quality perceived by end users when using a service is called QoE. Taking image processing as an example, the question of which features are included in a multimedia service becomes how well such features are addressed and the impact they have on end users. The data usually pass through many processing phases before delivering to end users host. These phases include: acquisition, processing, coding, transmission, enhancement, decoding, etc. The quality of multimedia data may be affected by each of these phases. This affection decreases the E2E QoE. There are also some other factors that impact on the QoE such as usability, human factors and context.
Traditionally, service providers carry only the notion of QoS, which objectively measures and guarantees characteristics of service from the provider perspective. QoS metrics take into account system components’ characteristics, not the human perception. Over the last few years, QoE has brought a new look to E2E quality in multimedia systems. QoE represents aspects related not only to subjective perception, but also user behavior and needs, appropriateness, context, usability and human factors of the delivered content.
The first concern refers to what the QoE is. There are different definitions of QoE. According to International Telecommunication Union (ITU) [ITU 65], QoE is defined as “the overall acceptability of an application or service, as perceived subjectively by the end user”. In fact, QoE is more a qualitative measure than a quantitative measure. In PC Magazine [PCM 94], QoE is defined as “a subjective measure of performance in a system. QoE relies on human opinion and differs from quality of service (QoS), which can be precisely measured”. According to Fiedler et al. [FIE 10a], if a user does not feel that (s)he is getting “value for money”, i.e., good-enough QoE for what (s)he is paying for, (s)he might be ready to abandon the particular service provider and/or network operator in question.
To clarify the above definitions, many standards organizations have studied the concept of QoE. We cite here three relevant standards organizations:
All these standards organizations focus on providing a clear and uniform definition of QoE and QoS. Moreover, they also try to establish the relationship between QoS and QoE in order to contribute to the QoE measurement and management.
Classification is necessary for understanding any concepts. QoE is not an exception. We classify this notion into three different classes (Table 2.1): QoE as QoS extension, QoE for management systems and QoE as a hedonistic concept. We have chosen this method of classification because these three approaches can cover the whole QoE notion. Indeed, what makes us interested in considering the user perception concept are the following:
Table 2.1. Three QoE approaches
QoE approaches |
Descriptions |
|
Extension of QoS |
QoE is considered as an extension of QoS. That reflects the QoS influences on end users’ perception. |
|
Key factor for management systems |
QoE is considered as a key factor for management systems. It reflects the user’s perception, and has vital importance for management tasks. |
|
Hedonistic concept |
QoE determines the user satisfaction when using a service. The key idea of the hedonistic concept is that pleasure is the only factor that has intrinsic value. This concept, in the context of QoE, is used to evaluate service in terms of how much pleasure and how little pain end users experience. |
2.3. Importance of QoE
E2E-QoE measures the degree of satisfaction of services perceived by the end user both objectively and subjectively. It has become a major issue for telecommunication companies because their businesses are highly dependent on customer satisfaction, and thus, the average revenue per user can only be increased by value-added services, which requires taking into account the complete E2E system effects. E2E-QoE involves the entire E2E path chain including the Quality of Design (QoD)1 of terminal equipment and QoS supported by network components. In the context of communication services, E2E-QoE is influenced by content, network, device, application, user expectations and context of use. Other external factors that can also have an impact on E2E-QoE include user’s terminal hardware, mobility, and the importance of the application.
Technical metrics such as packet delay, loss rate and jitter can represent QoS notions, and for some of the high-quality conferencing applications, these QoS metrics certainly become important. However, the QoS parameters are not the only crucial factor that determines service quality. Therefore, QoE aims to estimate or measure what happens in the customer’s mind, i.e. service quality perceived by the customers. As we know, simply improving technical metrics by itself would never be enough to prevent customers from giving up the service. Instead, operators should use some metrics that can react in advance and improve customer perception, i.e. QoE. As a result, network providers who provide good QoE have a significant competitive advantage, while providers who ignore the importance of QoE may suffer unnecessary costs. [SOL 06] confirm this point in showing statistical results: approximately 82% of customer defections (churning) are due to frustration over the product or service and the incompetence of the provider and 90% of users will not complain before defecting. The results indicate the necessity of a strategy to manage and improve QoE proactively for customer satisfaction.
Today, with the highly competitive environment of various service providers, end users have the option to choose the best service provider. As a consequence, the service availability is not enough. In this context, the service providers must improve those services so that users can enjoy a rich experience with a reasonable price. In addition, data traffic is today no longer just the best-effort traffic. To meet user needs and requirements, many applications of data traffic need high QoS. Thus, many standards organizations (e.g. ITU, Broadband Forum, TeleManagement-Forum as mentioned in the previous section) have proposed many classifications of services and QoS parameters. However, they do not clearly capture the real QoE. The most important difference between QoS and QoE is that while QoS just focuses on measuring performance from network perspective, the QoE focuses on how well a service meets the user’s expectations. Therefore, the challenge for service providers is to take into account both QoE and QoS. In many cases, acceptable QoS does not always infer acceptable QoE. For example, in a session of VoIP [BAT 10], the packet overflow is monitored at the aggregate queue level. Assume that an edge router has an inadequate buffer size. As the VoIP traffic volume is low compared to other types of traffic, the aggregate buffer statistics give an acceptable QoS. Despite this, the QoE in this case is poor because of dropped packets. So, the VoIP subscribers are unsatisfied.
2.4. QoE metrics
Even though QoE is difficult to predict due to its subjective nature, measurement of QoE is necessary for the assessment of overall service quality. Therefore, we need an effective strategy to measure QoE as realistically as possible. One way to achieve this is by the top-down approach. In the top-down approach, the factors that influence user perception are determined at the beginning. Then, this information is used to generate operating requirements. Finally, a method to constantly evaluate these factors and improve them is created.
We can group the expectations obtained in the initial phase into two main categories: reliability and quality [SOL 06]. Quality in this case refers to the QoS and application software features. KPIs for the reliability dimension in the network service include:
KPIs for the quality dimension include:
The KPIs are measured for each service in order to calculate an estimate of each service score. Based on the comparison between these scores and the initial “QoE targets” which were set before measuring each KPI, the values of each of these metrics will be mapped to assess the level of impact on the actual QoE.
Some KPIs will be totally irrelevant in one case while being the most important in another. It all depends on the type of service application the user is running. For example, important characteristics of voice and video conferencing are time relation preservation, guaranteed resource allocation without retransmissions and real-time traffic. In applications such as Web browsing, remote server access and interactive gaming, however, characteristics such as request/response pattern of use, transmission delay, dynamic resource allocation and best-effort traffic should be considered more.
Another way to classify QoE metrics is based on subjective or objective methods. Subjective methods are conducted to obtain information on the quality of multimedia services using opinion scores, while objective methods are used to estimate the network performance using models that approximate the results of subjective quality evaluation. Subjective parameters assess how audio and video data are collected from users, namely what their opinion is about the quality of sequences of audio/video. A typical example of qualitative metrics (subjective) is the mean opinion score (MOS) [REC 06], which was first standardized by the ITU. With this metric, the system quality is assessed subjectively from the mean opinion of a panel or group of users. Each user rates the service on a five-point scale: 1 = bad, 2 = poor, 3 = fair, 4 = good and 5 = excellent. The MOS is used typically in subjective tests of audio listening, where a number of people asses the quality of the audio. Another example of a qualitative metric is the R-factor [REC 11b], which can be used in a manner similar to MOS. Subjective evaluation of speech quality uses the R-factor in voice transmission models. Examples of subjective tests were summarized in ITU-R Rec. BT.500-11 [REC 02] and ITU-T Rec.P.910 [REC 99] and cited in [CHI 11].
However, subjective QoE measurement is time consuming, tedious, expensive and is not particularly applicable in a production environment. Instead of directly collecting quality information, objective methods can be used to estimate the MOS score. This way, the scores reflecting real-time user perception can be estimated and, immediately, the service providers can utilize the information to maintain the network condition thereby providing best QoE.
The objective quality measurement methods have been classified into the following five main categories [CHI 11, TAK 08]:
Among these categories, the media-layer objective quality measurement methods are subdivided into three types: (Figure 2.1) full reference (FR), reduced reference (RR) and no reference (NR). Taking video signals as an example, these subtypes can be explained as follows:
Figure 2.1. Classification of objective measurement methods

Figure 2.1 shows us the classification of objective quality measurement methods. The FR and RR are classified into traditional point-based metrics (e.g. peak signal-to-noise ratio (PSNR), mean square error (MSE)), natural visual characteristics oriented metrics (e.g. structural similarity (SSIM), video quality metric (VQM)) and perceptual oriented metrics (e.g. human visual system (HVS), perceptual evaluation of video quality (PEVQ), perceptual evaluation of speech quality (PESQ), perceptual quality significance Map (PQSM)). We now present in detail some representative objective metrics:
The QoE measurement possibility helps operators to maintain networks’ performance in the overall level of customer satisfaction in terms of reliability, availability, scalability, speed, accuracy and efficiency.
2.5. QoE measurement methods
We now survey several QoE measurement models that have recently been proposed in the literature. Goong et al. [GOO 09] proposed a pentagram model for measuring QoE with five factors: integrality, retainability, availability, usability, and instantaneousness. The authors defined a model of experience taking into account these factors in quality evaluations. The model was applied to measure experience of a VoIP service. QoE KPIs and the most important measures were defined as the following:
Taking each factor into account, the authors propose a formula (equation [2.1]) to calculate QoE:
where λ represents the 72-degree angle between the two sides in the QoE pentagram model. This model facilitated QoE measurement during a service use process in order to improve and represent new methods to evaluate the perception of VoIP services.
Kim et al. [KIM 08] propose a method for the objective QoE measurement using traditional QoS parameters. The QoS and QoE correlation model was described, and the QoE evaluation method using QoS parameters was studied in the converged network environment. The QoS parameters associated with QoE evaluation and the service classes include delay (D), jitter (J), loss rate (L), error rate (E), bandwidth (B) and signal success rate (S). The QoS-QoE correlation model was expressed as (equation [2.2]):
where, α is the QoS quality class of the network level. The QoE class measured by the QoS quality parameter of a network level is mapped similarly to the existing MOS grade with a five-point scale. β is determined according to the class of service as the grade of service constant. K is the scale constant to show the satisfaction with the used service. Using the QoS information measured on a network level, authors explain the proposed QoS-QoE correlation model for the objective QoE.
Another approach by Moebs [MOE 08] takes into account the trade-offs between QoS parameters and the flow requirements for e-learning, and aims to develop better evaluation methods for QoE using QoS-QoE correlation. The authors proposed an adaptive multimedia e-learning system that consists of a user model, a domain model and an adaptation model. The domain model represents the concept of the subject domain and usually, these concept structures are described as concept maps, semantic networks or concept graphs. The user model represents general characteristics of the user such as location, preferences for devices, previous knowledge, knowledge state and learning goals. The adaptation model uses adaptation rules to connect the two previously outlined models. Flow-related and learning-related aspects are the principal elements of the QoE, and are both influenced by QoS. This relationship is represented by the following function:
QoS is based on packet loss, delay and jitter in background applications, video, audio and data. Quality of Learning (QoL) represents the aspects of the user model (feedback, learning styles, assessment of the previous knowledge) and the domain model. Quality of Flow (QoF) is based on feedback, interaction, the balance of skill and challenges, which contains use of technology and emotions.
Hamam et al. [HAM 08] propose a taxonomy that is modeled by a mathematical model where the QoE is calculated as the weighed linear combination of the QoS and UE for a particular haptic user interface:
where ζ controls the relative weight given to the QoS parameters compared to the UE parameters. UE is a linear combination of perception measures, rendering quality, physiology measures and QoS measures. If the quality factors are restricted between 0 and 1, then the overall QoE will also have a value between 0 and 1. To achieve this condition, the sum of constant coefficients must be equal to 1.
The four previous approaches have shown different methods for measuring the QoE. However, all these methods are based just on the linear combination of QoS metrics (objective elements) and on the QoS/QoE correlation, from which the authors calculate QoE. It seems that they have ignored subjective perception, an indispensable factor of the QoE concept. QoE measurement methods must reflect the user’s perception and satisfaction. Certainly, the QoE of audio or video media should be evaluated in subjective terms. Subjective quality measurement is the most basic method of evaluating subjective quality. This deficiency motivates us to use a hybrid tool that mixes the two types of measurement: the subjective and objective method.
The meaning of QoE in a network context is so important that we have to find out the relationship between the QoS and the QoE. Actually, understanding the relationship between a familiar concept (QoS) and the new concept (QoE) is the best way to understand this new concept. The next section clarifies this.
2.6. QoS/QoE relationship
The notion of QoS [REC 11a, REC 01a] has been discussed for more than a decade. It concerns essentially the technical view on service quality. The QoS architectures (e.g. integrated services or differentiated services) are used to pave the way for high-quality real-time services such as VoIP or video streaming. However, the lack of UE consideration raises unresolved issues. As a result, in order to redirect the focus toward the end user and quantify the subjective experience gained from using a service, the notion of QoE has been introduced to describe quality as perceived by the human user.
QoS is defined as “ability of the network to provide a service at an assured service level” [SOL 06], or “capability of a network to provide better service to selected network traffic described by the following parameters: delay and jitter, loss probability, reliability, throughput and delivery time” [MAR 07a]. These definitions show that QoS is fundamentally a technical concept, which usually has little meaning to users. There are also some QoS definitions that correlate with the QoE: “collective effect of service performance which determines the degree of satisfaction of a user of the service” [REC 94], “a set of qualities related to the collective behavior of one or more objects” [ISO 98], or “the network’s capability to meet the requirements of users and applications” [KIL 02].
Compared to QoS, the notion QoE means the user perception about the quality of a particular service or network. It is expressed by human feelings like “good”, “excellent” and “bad”.
In order to clarify the relationship between QoS and QoE, we observe a quality chain of E2E services (Figure 2.2) where QoE is influenced by all intermediate aspects in the E2E chain, such as Quality of Perception (QoP), QoD and QoS. QoP is an aspect related to user’s perception and to his personal profile (e.g. age and sex) and his psychological status (e.g. happy, nervous and uninterested). QoD, which depends on designers and manufacturers, is defined as the quality perceived by an end user when using end-devices. The quality of a network service, including core network and access network, is determined by “access QoS” and “backbone QoS”. Hence, the E2E-QoE is considered as a conjunction of all intermediate aspects: QoP, QoD and QoS. For this reason, QoE is an important factor for an operator to properly design and manage its network.
Figure 2.2. Quality chain in an E2E service

Regarding another point of view of the relationship between QoS and QoE, we now analyze the quality management (QM), an indispensable term for every network operator. QM aims not only to ensure that a network service is consistent but also to achieve consistency. QM includes two main modules: quality assurance (QA) and client satisfaction (CS) (Figure 2.3). The term QA is defined as systematic activities implemented in a quality system to fulfill all quality requirements. While QA tries to design and meet worthy service specifications, CS metrics seek to capture the degree to which those requirements translate into services/applications that fulfill the user’s expectations. The QoS is actually related to the QA and the QoE is related to CS. This relation is explained by the fact that QoS is often part of enforceable SLAs based on specific performance levels while QoE refers to the perceived quality of the user engagement.
Figure 2.3. QoE and QoS in quality management module

According to the qualitative dependent relationship between QoE and QoS, Fiedler et al. [FIE 10b] give a schematic relation describing the impact of QoS problems on QoE. In Figure 2.4, the x-axis is the QoS disturbance and the y-axis is the QoE value, which is described by an MOS score [REC 06] (i.e. a scale of 1 to 5 where 5 is the best and 1 is the worst). As a function of QoS disturbance, the QoE is divided into three areas, separated by threshold 1 and threshold 2. We now analyze each of these areas (Figure 2.4):
Figure 2.4. General mapping curve between QoS and QoE
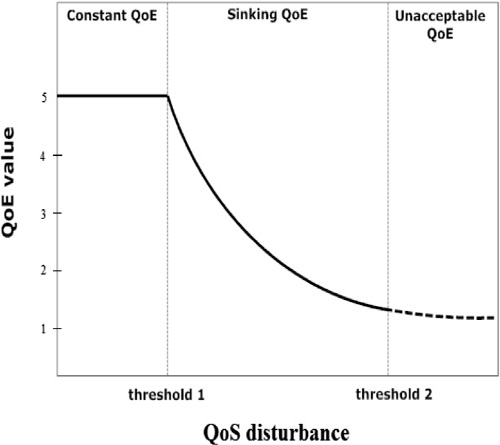
Concerning the mapping between QoS and QoE in Figure 2.4, the network provider should detect the moment of threshold 1 and propose solutions to improve service quality as long as the QoE is falling into the decreasing area. The goal is not only to solve the problem of quality degradation but also to avoid the churn problem (i.e. users give up the operator). Hence, the QoE is the most important factor for an operator to properly design and manage its network. A good QoS gives a good QoE. However, maintaining all the QoS parameters will not ensure a satisfied user. For example, in a wireless network, if there is no coverage a short distance away, this causes a bad QoE, although there is an excellent throughput in one part of a network.
In order to guarantee a good QoE in network system, apart from understanding the QoE/QoS relationship, we also need to comprehend the impact of networking on QoE. The next section discusses this issue.
2.7. Impact of networking on QoE
According to the impact of networking in QoE, with the continuous development of network services, it is giving new features and advances. It is not easy to explain how networking can affect the QoE because there are many research topics, technologies and applications related with the networking topic. First, based on [MAR 10], we present the layered approach similar to the Transmission Control Protocol (TCP)/IP model to explain this issue. Then, we talk about the impact of some network criteria on the QoE.
2.7.1. Layered classification of impacts on QoE
2.7.1.1. Link layer
The limit of the maximum speed that is transmitted in a link gives the link layer a fundamental role in the UE. In fact, it decides how the data are transported over the links and how the end users can access a link. In addition, the link layer can prioritize some kind of traffic in adjusting QoS parameters. On the other hand, this layer supports not only wired link technologies but also wireless technologies. Here we cite some examples: Wi-Fi [HEN 02], Wimax [NUA 07] and UMTS [KAA 01] that provide the wireless infrastructure for 3G networks. Besides the shared access technologies we mentioned previously, there are also point-to-point technologies such as digital subscriber line (DSL) [STA 99] and fiber to the home (FTTH) [KOO 06], which can provide QoS. The link layer technologies have the same aim but different performance, capacity and behavior. In addition, the deployed scenario and the external conditions influence their performance. Therefore, the context and scenario description is very important in QoE measurement.
2.7.1.2. Network layer
The network layer includes IPs. The IP performance depends on various factors. First, it is the routing path that data packets must follow to reach the destination. The routing path is influenced by three factors: the end points, the connectivity from ISPs to the customers and the relationship between ISPs. Building the routing tables in the routers of ISPs needs Border Gateway Protocol (BGP) [RAM 00] that manages the autonomous systems (ASs). Thus, the performance of the Internet is based on the way the ISPs establish routing policies through BGP. Therefore, many research projects related with IP carry the relationship between ASs and ISPs. Considering the QoE makes these projects more realistic and closer to the results in a real deployment. The other factor affecting IP is mobility. IP was originally designed in considering only wired network where hosts are fixed. However, the appearance of wireless technology as well as laptops, hand-held devices, poses a challenge to IPs. In fact, the QoE perceived by end users changes due to the fact that mobility affects delay, jitter and loss rate.
2.7.1.3. Transport layer
The transport layer plays an important role in the QoE perceived by end user. The main protocols of this layer are TCP [AWE 02] and User Datagram Protocol (UDP) [KUR 05]. The connection-oriented protocol TCP process different E2E flow congestion control mechanisms, which affect the QoE [TRI 10]. Besides TCP, there are also other similar protocols such as Stream Control Transmission Protocol (SCTP) [STE 01] or Datagram Congestion Control Protocol (DCCP) [KOH 06]. On the other hand, the connectionless protocol UDP is used for real-time transmission where the flow control is not necessary. Actually, the peer-to-peer traffic that has been growing for years affects the quality of other flows in the Internet because peer-to-peer applications open lots of connections to both UDP and TCP. Furthermore, different flows competing for the available network resource imply the overload issue of network system. According to Martinez-Yelmo et al. [MAR 10], the IETF Low Extra Delay Background Transport (LEDBAT) Working Group (WG) carries this problem to develop lower-than-best-effort transport protocols that avoid decreasing the QoE appreciated in the rest of applications running on the Internet.
2.7.1.4. Application layer
The application layer is an important layer in terms of QoE because it is the only thing that users can really appreciate and interact with. In fact, the end users do not take into account the technical metrics under their applications. They just consider the subjective media quality of applications they are using. For example, the simplicity of install and use is an important feature of a VoIP application. If the latter was able to cross NATs and firewalls without reconfiguring any network equipment and the users could install it in any computer and network without any complex configuration, this application would obtain a good QoE. Skype [CHE 06] is such an application that has had much success due to good QoE with the simplicity of install and use. QoE has different meanings in different kinds of applications. While the sound fidelity and ability to smoothly take turns in a conversation give a good QoE for a VoIP application, a multimedia streaming application with a large and clear video image has a positive QoE. For a Web browser, good QoE means the Web content is retrieved fast enough.
2.7.2. Impact of user mobility on QoE
In next-generation wireless networks, the IP-based transport through the radio and core network parts is provided by the all-IP-paradigm solution. However, this concept requires a precise management of user mobility. Therefore, the impacts of user mobility on QoE are an important issue to consider, and studied by Bernardo et al.[BER 08] and Ciubotaru and Muntean [CIU 09].
Bernardo et al. [BER 08] propose mechanisms in order to evaluate the QoE that users perceive with different QoS-aware mobility management strategies. In their work, the authors use a test bed that can evaluate the QoE in a real heterogeneous wireless access network. By contrast, Ciubotaru et al. [CIU 09] propose another novel quality-aware approach (smooth adaptive soft-handover algorithm (SASHA)) to handover on load balancing among different networks using a comprehensive function for decision-making. These approaches are described definitively as follows.
In [BER 08], the authors presented a brief overview of the test bed in the mobility management (MM). This test bed reproduces a beyond 3G heterogeneous radio access network that consists of three radio access networks (RANs): universal terrestrial radio access network (UTRAN), GSM EDGE radio access network (GERAN) and WLAN interfacing a common core network based on DiffServ/MPLS protocols. In this test bed, user equipment is connected to ingress routers (IRs) through traffic switching. The authors present three handover types:
After testing different handover types, the QoE of the UUT is depicted by MOS values. The authors used an FR model-based objective metric to obtain a satisfaction-level measurement.
Studies of Ciubotaru and Muntean [CIU 09] focused in a heterogeneous wireless network environment where the mobile device uses different wireless technologies to access to several networks. In order to maximize users’ perceived quality in a dynamic environment, a quality-oriented mobility management solution with efficient resource allocation is required. Multimedia mobility management system (M3S) is an application-level framework for delivering high-quality multimedia content to mobile clients. A novel Quality of Multimedia Streaming metric (QMS) is presented to depict and quantify the impact of separated network parameters to the multimedia delivery quality. M3S provides handover management and efficient quality-oriented resource allocation using the SASHA, which performs handover between different networks by transferring the load from one network to another. QMS is described by equation [2.6] with the communication channel i:

User preference grade (UPrefigrade) is the score of the user that expresses the user’s preference for the network interface used by the communication channel i.
User’s perceived quality grade (QoEigrade) is the user’s perceived quality that is calculated based on the received content’s video quality. QoE grade for each communication channel is determined by distributing the overall QoE according to the channel’s corresponding rate share:
This algorithm executes a quality-oriented handover by sending the load from one network to another. The handover decision-making algorithm is based on the QMS grades for each communication channel. QMS represents a more comprehensive metric to construct a handover management solution oriented on users’ perceived quality by taking several QoS and QoE related parameters into account. This approach aims to maximize the end users’ perceived quality (QoE) when streaming multimedia content by efficiently using all the communication resources available. M3S uses the novel algorithm (SASHA) to distribute the load over the communication channels based on their estimated contribution in order to deliver high-quality multimedia content.
The two approaches mentioned above show the influence of user mobility on the QoE. The next section discusses the impact of network resource utilization and management on the QoE.
2.7.3. Impact of network resource utilization and management on QoE
Proper management of the network resource is a good way to handle and maintain the system quality, so it also has a significant impact on end user perception. Indeed, there were many systems taking into account this feature such as [YAM 07] and [AGB 08].
In [YAM 07], a network resource management system for resource access control facility (RACF) based on the end user QoE is presented. The authors constructed a concept of a network resource management system (NetRM) to provide service-oriented network services via a Web services interface (WSI). NetRM distributes and supervises the suitable E2E network resources to meet the service request. NetRM provides guaranteed and scheduled network services to network service clients.
In [AGB 08], the authors propose a more concrete approach based on a QoE management methodology, which aims at maximizing the user’s QoE while preserving network resources at the same time. A statistical modeling technique, discriminant analysis, has been employed to implement this methodology. Because of the prediction model, network operators can anticipate the user’s experience and then allocate network resources accordingly. A statistical technique can be used to predict a qualitative attribute of an individual from known quantitative variables. In order to perform a discriminated analysis, we need a set of observations whose group memberships are already known. The general formula for a discriminated function is given as:
where:
fkm is the predicted discriminated score for case m in the group ki,
Xikm is the value of the quantitative predictors Xi for case m in group k,
ui is coefficients for variable i, for i = 1..p.
The results taken from this chapter illustrate how to maximize the utilization of network resources and provide different levels of service quality.
We consider these two approaches [YAM 07, AGB 08] as adaptive systems. They both used resource management functions to maintain required QoE and QoS. The main differences between the two approaches are the functions used. In [YAM 07], in order to maintain the QoE, a network resource management function was implemented in each access network and utilized when the communication service was set up to allocate required bandwidth. Instead, in [AGB 08] a discriminated function was used and a statistical modeling technique was implemented to maximize the user’s QoE while preserving network resources.
2.7.4. Impact of billing and pricing
We will discuss how billing and pricing can have an impact on QoE. Takahashi et al. [TAK 08] studied using a particular application based on IPTV service and focused on QoE requirements in consideration of service billing for this application. In their work, QoE was defined as how well an IPTV service satisfies the customer’s expectation. It was found that the service billing had a strong correlation with the customer’s expectation for service quality. The authors gave an example where service has a long channel zapping delay. An IPTV customer subscribing to a basic class accepted this channel zapping time. On the other hand, the premium IPTV customer who pays a more expensive service charge was dissatisfied with the same channel zapping time. Since customers tend to expect a better service quality as the service charge increases, the customer’s evaluation for the service strongly depends on its service billing.
As an example of a QoE metric with service billing, the authors propose end user’s utility (Us), which is a relative satisfaction level for service quality. Another metric is service quality metric (Ts) for IPTV, e.g. channel zapping delay, control command response time, STB startup time and picture quality. The third metric is service billing (Bs), i.e. the service charge for a service S. Finally, Us can be defined as Us = f (Ts,Bs). In this formula, f is a weight function that transforms the absolute service quality metric, Ts, with service billing as a relative end user utility value Us. Therefore, even if two customers have the same service quality metrics, their satisfaction levels (Us) can be different because each customer may pay a different service charge. The weight function is based on the types of services, the types of customers and the policies of service billing.
2.8. Conclusion
Nowadays, emerging network services (e.g. VoIP, video on demand and IPTV) are becoming increasingly numerous. Network service providers try to improve the quality of the offered services perceived by the end users. In this chapter, after presenting QoE/QoS relationship, QoE metrics and some QoE measurements models, many issues that may impact user perception in many different ways are also given, such as the method of measuring and monitoring QoE, modeling of user satisfaction as well as the impact of user mobility and network resource utilization.
1 The QoD is the quality perceived by end user when using end-devices. In other words, QoD is how end user is satisfied with design and usability of end-devices.