11.6. Characterizing the Workload at the Resource Level
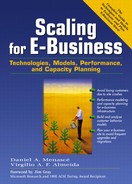
To be able to perform capacity planning and sizing studies of an e-commerce site, we need to map each CBMG resulting from the workload characterization process described above to IT resources as described in Section 7.7.2 and depicted in Fig. 11.10. The figure shows an e-business function search being mapped to a CSID. With each server in the CSID, we associate service demands at the various components (e.g., processors and disks) of the server. Also, to each arc of the CSID, we associate service demands for the networks involved in the exchange of messages represented by the arc. Consider the following example.
Figure 11.10. From CBMGs to IT Resources.

| Cluster | VBrowse | VSearch | VAdd | VSelect | VPay |
|---|---|---|---|---|---|
| 1 | 5.875 | 8.375 | 1.875 | 5.500 | 0.875 |
| 2 | 12.750 | 18.250 | 1.000 | 15.250 | 0.250 |
| 1 | 4.750 | 10.250 | 2.000 | 7.000 | 1.000 |
| 2 | 12.750 | 18.250 | 1.000 | 15.250 | 0.250 |
| 3 | 7.000 | 6.500 | 1.750 | 4.000 | 0.750 |
| 1 | 4.750 | 10.250 | 2.000 | 7.000 | 1.000 |
| 2 | 15.500 | 19.000 | 2.000 | 17.000 | 0.500 |
| 3 | 7.000 | 6.500 | 1.750 | 4.000 | 0.750 |
| 4 | 10.000 | 17.500 | 0.000 | 13.500 | 0.000 |
Example 11.5
The characterization of the customer behavior for an e-commerce site generated two CBMGs. One is more characteristic of heavy buyers, i.e.. customers who will buy from the site with higher probability and the other characterizes occasional buyers. These customers tend to search more than heavy buyers and buy less. Let us focus on the e-business function Search, which represents a state of the CBMG. Assume that the database server (DS) has one CPU and two disks with service demands 0.006 sec, 0.020 sec, and 0.018 sec, respectively, for one execution of the search transaction. Table 11.4 displays the session arrival rate for each of the two CBMGs and the average number of visits to the state Search for each one. What is the service demand per session for Search functions at each component of the DS for each CBMG? What is the utilization of each resource of the database server due to the Search function?
Consider the CBMG for occasional buyers. Each session of this type executes 6.76 searches on the average. Each search uses 0.006 sec of CPU at the database server. So, the CPU service demand due to Search functions executed during sessions from occasional buyers is
Equation 11.6.18
![]()
In general, the service demand at a resource i (e.g., CPU or disk) due to sessions of type r (e.g., heavy buyers, occasional buyers) for all executions of the e-business function f (e.g., Search, Browse) is
Equation 11.6.19
![]()
where Vf,r is the average number of executions of function f per session of type r and Di(f) is the service demand of a single execution of function f at resource i. Table 11.4 shows the results of the computations, using Eq. (11.6.19), of the service demands for all resources and for the two types of CBMGs.
Let us now compute the utilizations. As we saw in Chapter 8, the utilization of a resource is equal to the product of the service demand at that resource multiplied by the throughput (or arrival rate in equilibrium). Thus,
Equation 11.6.20
![]()
where Ui,r(f) is the utilization of resource i due to the execution of function f for sessions of type r, and in which ![]() is the rate of execution of function f due to sessions of type r and in which
is the rate of execution of function f due to sessions of type r and in which ![]() is the arrival rate of sessions of type r. So,
is the arrival rate of sessions of type r. So,

Table 11.4 presents the computation of the utilization for the CPU, disks 1 and 2, for heavy and occasional buyers due to the execution of the Search. It also presents the total utilization of each resource due to the Search function. For example, the total CPU utilization due to the execution of Search functions is 22.82%.