Chapter 12
Options: The Right to Buy or Sell at a Fixed Price
IN THIS CHAPTER
![]() Understanding the specifics of options
Understanding the specifics of options
![]() Feeling comfortable with an options chart
Feeling comfortable with an options chart
![]() Calculating the maximum loss, maximum gain, and break-even points
Calculating the maximum loss, maximum gain, and break-even points
![]() Dealing with unconventional options
Dealing with unconventional options
![]() Covering additional option rules
Covering additional option rules
Welcome to the wonderful world of options. I’m sure you’ve heard stories about the difficulty of options. Put your mind at ease — I’m here to make your life easier. Maybe I’m a little warped, but options are my favorite part of the Series 7 exam! Options are considered derivative securities because their value is derived from the value of the underlying stock, index, currency, and so on. Options are one of the more heavily tested areas on the Series 7. Options can be trades on individual stocks, stock market indexes, foreign currency, interest rates, or bonds. And options can be traded on exchanges such as the Chicago Board Options Exchange (CBOE).
Some option info was already covered when taking the Securities Industry Essentials (SIE) exam, so a little bit of this chapter will look familiar. However, the Series 7 digs a lot deeper than the SIE. A lot of the questions are simple calculations, so in this chapter, I show you how to put numbers into an options chart to make even the more difficult calculations simple. I give you plenty of example questions so you can put those math skills to good use. I also give you a general tour of the options basics — calls and puts, in- and out-of-the-money, and so on — and introduce you to the unique LEAPS and capped options.
Brushing Up on Option Basics
Options are just another investment vehicle that (hopefully) more-savvy investors can use. An owner of an option has the right, but not the obligation, to buy or sell an underlying security (stock, bond, and so on) at a fixed price; as derivatives, options draw their value from that underlying security. Investors may either exercise the option (buy or sell the security at the fixed price) or trade the option in the market.
All option strategies (whether simple or sophisticated), when broken down, are made up of simple call and/or put options. After going over how to read an option, I explain a basic call option and help you figure out how to work with that before moving on to a put option. Next, I discuss options that are in-, at-, or out-of-the-money, and the cost of options. After you’ve sufficiently mastered the basics, the rest (the more difficult strategies later in this chapter) becomes easier.
Reading an option
To answer Series 7 questions relating to options, you have to be able to read an option. The following example shows you how an option may appear on the Series 7:
Buy 1 XYZ Apr 60 call at 5
Here are the seven elements of the option order ticket and how they apply to the example:
-
Whether the investor is buying or selling the option: Buy
When an investor buys (or longs, holds, or owns) an option, she is in a position of power; that investor controls the option and decides whether and when to exercise the option. If an investor is selling (shorting or writing) an option, she is obligated to live up to the terms of the contract and must either purchase or sell the underlying stock if the holder exercises the option.
-
The contract size: 1
You can assume that one option contract is for 100 shares of the underlying stock. Although this idea isn’t as heavily tested on the Series 7 exam, an investor may buy or sell multiple options (for example, five) if she’s interested in having a position in more shares of stock. If an investor owns five option contracts, she’s interested in 500 shares of stock (check out “Off the charts: Multiple option contracts” later in the chapter for more information on this topic).
-
The name of the stock: XYZ
In this case, XYZ is the underlying stock that the investor has a right to purchase at a fixed price.
-
The expiration month for the options: Apr
All options are owned for a fixed period of time. The initial expiration for most options is 9 months from the issue date. In the preceding example, the option will expire in April. Options expire on the third Friday of the expiration month.
 This entire warning needs to be removed. Options used to expire on Saturday, now it’s Friday.
 -
The strike (exercise) price of the option: 60
When the holder (purchaser or owner) exercises the option, she uses the option contract to make the seller of the option buy or sell the underlying stock at the strike price (see the next step for info on determining whether the seller is obligated to buy or sell). In this case, if the holder were to exercise the option, the holder of the option would be able to purchase 100 shares of XYZ at $60 per share.
-
The type of option: call
An investor can buy or sell a call option or buy or sell a put option. Calls give holders the right to buy the underlying security at a set price; puts give holders the right to sell. So in the example scenario, the holder has the right to buy the underlying security at the price stated in the preceding step.
-
The premium: 5
Of course, an option investor doesn’t get to have the option for nothing. An investor buys the option at the premium. In this case, the premium is 5, so a purchaser would have to pay $500 (5 × 100 shares per option).
Looking at call options: The right to buy
 A call option gives the holder (owner) the right to buy 100 shares of a security at a fixed price and the seller the obligation to sell the stock at the fixed price. Owners of call options are bullish (picture a bull charging forward) because the investors want the price of the stock to increase. If the price of the stock increases above the strike price, holders can either exercise the option (buy the stock at a good price) or sell the option for a profit. By contrast, sellers of call options are bearish (imagine a bear hibernating for the winter) because they want the price of the stock to decrease.
For example, assume that Ms. Smith buys 1 DEF October 40 call option. Ms. Smith bought the right to purchase 100 shares of DEF at 40. If the price of DEF increases to over $40 per share, this option becomes very valuable to Ms. Smith, because she can purchase the stock at $40 per share and sell it at the market price or sell the option at a higher price.
If DEF never eclipses the 40 strike (exercise) price, then the option doesn’t work out for poor Ms. Smith and she doesn’t exercise the option. However, it does work out for the seller of the option, because the seller receives a premium for selling the option, and the seller gets to pocket that premium.
Checking out put options: The right to sell
You can think of a put option as being the opposite of a call option (see the preceding section). The holder of a put option has the right to sell 100 shares of a security at a fixed price, and the writer (seller) of a put option has the obligation to buy the stock if exercised. Owners of put options are bearish because the investors want the price of the stock to decrease (so they can buy the stock at market price and immediately sell it at the higher strike price or sell their option at a higher premium). However, sellers of put options are bullish (they want the price of the stock to increase), because that would keep the option from going in-the-money (see the next section) and allow them to keep the premiums they received.
For example, assume that Mr. Jones buys 1 ABC October 60 put option. Mr. Jones is buying the right to sell 100 shares of ABC at 60. If the price of ABC decreases to less than $60 per share, this option becomes very valuable to Mr. Jones. If you were in Mr. Jones’s shoes and ABC were to drop to $50 per share, you could purchase the stock in the market and exercise (use) the option to sell the stock at $60 per share, which would make you (the new Mr. Jones) very happy.
If ABC never drops below the 60 strike (exercise) price, then the option doesn’t work out for Mr. Jones and he doesn’t exercise the option. However, it does work out for the seller of the option, because the seller receives a premium for selling the option that she gets to keep.
Getting your money back: Options in-, at-, or out-of-the-money
To determine whether an option is in- or out-of-the-money, you have to figure out whether the investor would be able to get at least some of his or her premium money back if the option were exercised.
You can figure out how much an option is in-the-money or out-of-the-money by finding the difference between the market value and the strike price. Here’s how you know where-in-the-money an option is:
-
When an option is in-the-money, exercising the option lets investors sell a security for more than its current market value or purchase it for less — a pretty good deal.
The intrinsic value of an option is the amount that the option is in-the-money; if an option is out-of-the-money or at-the-money, the intrinsic value is zero.
- When an option is out-of-the-money, exercising the option means investors can’t get the best prices; they’d have to buy the security for more than its market value or sell it for less. Obviously, holders of options that are out-of-the-money don’t exercise them.
- When the strike price is the same as the market price, the option is at-the-money; this is true whether the option is a call or a put.
Call options — the right to buy — go in-the-money when the price of the stock is above the strike price. Suppose, for instance, that an investor buys a DEF 60 call option and that DEF is trading at 62. In this case, the option would be in-the-money by two points (the option’s intrinsic value). If that same investor were to buy that DEF 60 call option when DEF was trading at 55, the option would be out-of-the-money by five points (with an intrinsic value of zero).
A put option — the right to sell — goes in-the-money when the price of the stock drops below the strike price. For example, a TUV 80 call option is in-the-money when the price of TUV drops below 80. The reverse holds as well: If a put option is in-the-money when the price of the stock is below the strike price, it must be out-of-the-money when the price of the stock is above the strike price.
Don’t take the cost of the option (the premium) into consideration when determining whether an option is in-the-money or out-of-the-money. Having an option that’s in-the-money is not the same as making a profit. (See the next section for info on premiums.)
 Use the phrases call up and put down to recall when an option goes in-the-money. Call up can help you remember that a call option is in-the-money when the market price is up, or above the strike price. Put down can help you remember that a put option is in-the-money when the market price is down, or below the strike price.
The following question tests your knowledge of options being in- or out-of-the-money.
 Which TWO of the following options are in-the-money if ABC is trading at 62 and DEF is trading at 44?
- An ABC Oct 60 call option
- An ABC Oct 70 call option
- A DEF May 40 put option
- A DEF May 50 put option
(A) I and III
(B) I and IV
(C) II and III
(D) II and IV
The correct answer is Choice (B). Start with the strike (exercise) prices. You’re calling up or putting down from the strike prices, not from the market prices. Because call options go in-the-money when the market price is above the strike price, Statement I is the only one that works for ABC. An ABC 60 call option would be in-the-money when the price of ABC is above 60. ABC is currently trading at 62, so that 60 call option is in-the-money. For the ABC 70 call option to be in-the-money, ABC would have to be trading higher than 70. Next, use put down for the DEF put options, because put options go in-the-money when the price of the stock goes below the strike price. Therefore, Statement IV makes sense because DEF is trading at 44, and that’s below the DEF 50 put strike price but not the 40 put strike price.
When someone purchases an option, it is said that he is long the option. An investor who is long an option is paid the premium for the option so he needs the option to go in-the-money (the price of the underlying security to go in the correct direction) enough for him to not only recoup his premium but also make a few bucks.
When someone is short an option, it means that he sold the option. This person is on the opposite side of the transaction than the person who is long the option. In this case, the seller received a premium for selling the option. So someone who is short an option is doing so for income and is hoping that the option expires out-of-the-money so that he gets to keep the premium.
Paying the premium: The cost of an option
The premium of an option is the amount that the purchaser pays for the option. The premium may increase or decrease depending on whether an option goes in- or out-of-the-money, gets closer to expiration, and so on. The premium is made up of many different factors, including
- Whether the option is in-the-money (see the preceding section)
- The amount of time the investor has to use the option
- The volatility of the underlying security
- Investor sentiment (for example, whether buying calls on ABC stock is the cool thing to do right now)
One of the questions you may run across on the Series 7 exam requires you to figure out the time value of an option premium. Time value has to do with how long you have until an option expires. There’s no set standard for time value, such as every month until an option expires costs buyers an extra $100. However, you can assume that if two options have everything in common except for the expiration month, the one with the longer expiration will have a higher premium. Hopefully, the following equation can help keep you from getting a “pit” in your stomach:
In this formula, P is the premium or cost of the option, I is the intrinsic value of the option (the amount the option is in-the-money), and T is the time value of the option.
For example, here’s how you find the time value for a BIF Oct 50 call option if the premium is 6 and BIF is trading at 52: Call options (the right to buy) go in-the-money when the price of the stock goes above the strike price (call up — see the preceding section). Because BIF is trading at 52 and the option is a 50 call option, it’s two points in-the-money; therefore, the intrinsic value is 2. Because the premium is 6 and the intrinsic value is 2, the premium must include 4 as a time value:
The following question tests your knowledge of using the formula P = I + T.
Use the following chart to answer the next question.
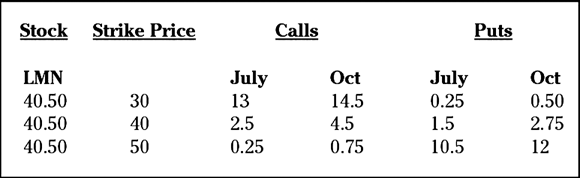
What is the time value of an LMN Oct 30 call?
(A) 2.5
(B) 4
(C) 6.25
(D) 9.5
The answer you’re looking for is Choice (B). I threw you a curveball by giving you a chart similar to what you may see on the Series 7 exam. I hope you’re able to find the premium that you need to answer the question. Most of the exhibits you get on the Series 7 are simple, and solving the problem is just a matter of locating the information you need.
Using the chart, the first column shows the price of the stock trading in the market, the second column shows the strike prices for the options, and the rest of the chart shows the premiums for the calls and puts and the expiration months. Scan the chart under the October calls, which is in the fourth column; then look for the 30 strike price, which is in the first row of data. The column and row intersect at a premium of 14.5.
Now you need to find the intrinsic value (how much the option is in-the-money). Remember that call options go in-the-money when the price of the stock is above the strike price (call up). This is a 30 call option and the price of the stock is 40.50, which is 10.5 above the strike price. Plug in the numbers, and you find that the premium includes a time value of 4:
Incorporating Standard Option Math
I’m here to make your life easier. Prep courses use several different types of charts and formulas to figure out things such as gains or losses, break-even points, maximum gain or loss, and so on. I believe that the easiest way is to use the options chart that follows. It’s a simple Money Out, Money In chart you can use to plug in numbers. What’s great about this chart is that you don’t even necessarily have to understand what the heck is going on to determine the answers to most options questions. As this chapter progresses, I show you how incredibly useful the options chart can be.
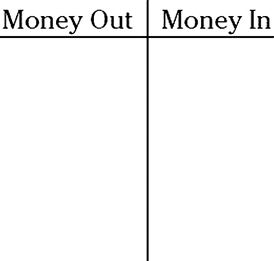
If it looks basic, it is — and that’s the idea. Any time an investor spends money, you place that value in the Money Out side of the options chart, and any time an investor receives money, you place the number in the Money In side of the chart.
Buying or selling call options
The most basic options calculations involve buying or selling call or put options. Although using the options chart may not be totally necessary for the more basic calculations (such as the one that follows in the next section), working with the chart now can help you get used to the tool so you’ll be ready when the Series 7 exam tests your sanity with more-complex calculations.
As you work with options charts, you may notice a pattern when determining maximum losses and gains. Table 12-1 gives you a quick reference concerning the maximum gain or maximum loss an investor faces when buying or selling call options. Notice that the buyer’s loss is equal to the seller’s gain (and vice versa).
TABLE 12-1 Maximum Gains and Losses for Call Options
|
Buying or Selling |
Maximum Loss |
Maximum Gain |
|
Buying a call |
Premium |
Unlimited |
|
Selling an uncovered call |
Unlimited |
Premium |
The key phrase to remember when working with call options is calls same, which means that the premium and the strike price go on the same side of the options chart.
Buying call options
The following steps show you how to calculate the maximum loss and gain for holders of call options (which give the holder the right to buy). I also show you how to find the break-even point. Here’s the order ticket for the example calculations:
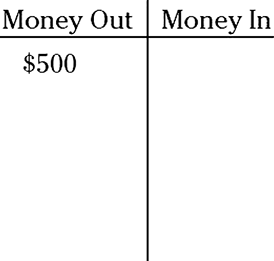
Buy 1 XYZ Oct 40 call at 5
-
Find the maximum loss.
The holder of an option doesn’t have to exercise it, so the most she can lose is the premium. The premium is 5, so this investor purchased the option for $500 (5 × 100 shares per option); therefore, you enter that value in the Money Out side of the options chart (think “money out of the investor’s pocket”). According to the chart, the maximum loss (the most this investor can lose) is $500.
-
Determine the maximum gain.
To calculate the maximum gain, you have to exercise the option at the strike price. The strike price is 40, so you enter $4,000 (40 strike price × 100 shares per option) under its premium (which you added to the chart when calculating maximum loss); exercising the call means buying the stock, so that’s Money Out. When exercising call options, always put the multiplied strike price under its premium. (Remember calls same: The premium and the strike price go on the same side of the options chart.)
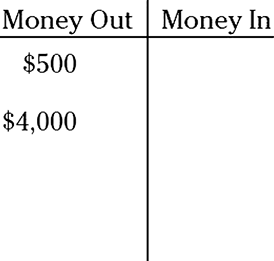
Because you’ve already determined the maximum loss, look at the Money In portion of the options chart. The Money In is empty, so the maximum gain (the most money the investor can make) is unlimited.
When you see a question about the break-even point, the Series 7 examiners are asking, “At what point does this investor not have a gain or loss?” The simplest way to figure out this point for a call option is to use call up (remember that call options go in-the-money when the price of the stock goes above the strike price — see the section “Options in-, at-, or out-of-the-money”). When using call up, you add the strike price to the premium:
For this investor, the break-even point is 45. This number makes sense because the investor paid $5 for the option, so the option has to go $5 in-the-money for the investor to recoup the amount she paid. Note: The break-even point is always the same for the buyer and the seller.
Selling call options
Here, I show you how to find the maximum gain and loss, as well as the break-even point, for sellers of call options. Here’s the order ticket for the example calculations:
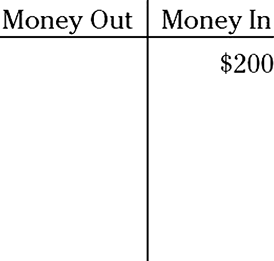
Sell 1 ZYX Oct 60 call at 2
-
Determine the maximum gain.
The seller makes money only if the holder fails to exercise the option or exercises it when the option is in-the-money by less than the premium received. This investor sold the option for $200 (2 × 100 shares per option); therefore, you enter that amount in the Money In side of the options chart. According to the chart, the maximum gain (the most that this investor can make) is the $200 premium received. Note: The exercised strike price of $6,000 (60 × 100 shares) doesn’t come into play when determining the maximum gain in this example because the holder of the option would exercise the option only if it were in-the-money.
-
Find the maximum loss.
To calculate the maximum loss, you need to exercise the option at the strike price. The strike price is 60, so you enter $6,000 (60 strike price × 100 shares per option) under its premium. The $6,000 goes in the Money In side of the options chart because this investor had to sell the stock to the holder at the strike price (60 × 100 shares). When exercising call options, always enter the multiplied strike price under its premium. (Remember calls same: The premium and the strike price go on the same side of the options chart.)
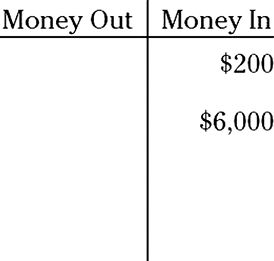
You’ve already determined the maximum gain; now look at the Money Out portion of the options chart. The Money Out is empty, so the maximum loss (the most money the investor can lose) is unlimited.
When you see a question about the break-even point, the examiners are asking you, “At what point does this investor not have a gain or loss?” The simplest way to figure this out for a call option is to use call up. When using call up, you add the strike price to the premium:
For this investor, the break-even point is 62. This makes sense because the investor received $2 for the option, so the option has to go $2 in-the-money for this investor to lose the amount that she received for selling the option. Call options go in-the-money when the price of the stock goes above the strike price.
When you're selling a call option and you don't own the stock to deliver if the option is exercised or you don't own a call option on the same stock that would be in-the-money first, you're option position is considered uncovered or naked. If, however, you do own the stock for enough shares to cover the option or hold a call option on the same stock that would be in the money first, you're considered covered (known as a covered call).
Buying or selling put options
Fortunately, when you’re calculating the buying or selling of put options (which give the holder the right to sell), you use the options chart in the same way but with a slight change (see the preceding section for info on call options). Instead of using calls same as you do with call options, you use puts switch — in other words, you place the premium and the strike price on opposite sides of the options chart.
Table 12-2 serves as a quick reference regarding the maximum gain or maximum loss an investor faces when buying or selling put options.
TABLE 12-2 Maximum Gains and Losses for Put Options
|
Buying or Selling |
Maximum Loss |
Maximum Gain |
|
Buying a put |
Premium |
(strike – premium) × 100 shares |
|
Selling an uncovered put |
(strike – premium) × 100 shares |
Premium |
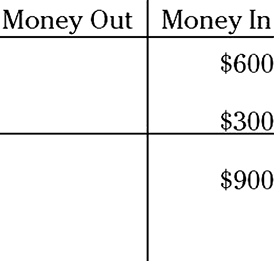
Buying put options
This section explains how to find the maximum loss, maximum gain, and the break-even point for buyers (holders) of put options. Here’s the ticket order for the calculations:
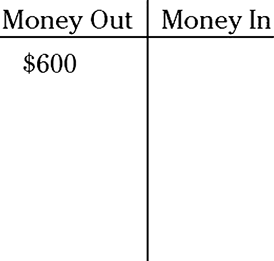
Buy 1 TUV Oct 55 put at 6
-
Find the maximum loss.
Exercising an option is, well, optional for the holder, so buyers of put options can’t lose more than the premium. Because this investor purchased the option for $600 (6 × 100 shares per option), you enter that value in the Money Out side of the options chart. The maximum loss (the most that this investor can lose) is the $600 premium paid.
-
Determine the maximum gain.
To find the maximum gain, you have to exercise the option at the strike price. The strike price is 55, so you enter $5,500 (55 strike price × 100 shares per option) on the opposite side of the options chart. (Remember puts switch: The premium and the strike price go on opposite sides of the options chart.) Exercising the option means selling the underlying stock, so that $5,500 is Money In.
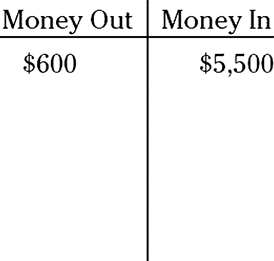
You’ve already determined the maximum loss; now look at the Money In portion of the options chart. Because you find $4,900 more Money In than Money Out ($5,500 – $600), the maximum gain is $4,900.
The break-even point is the security price where the investor doesn’t have a gain or loss. The simplest way to figure this point out for a put option is to use put down (put options go in-the-money when the price of the stock goes below the strike price). When using put down, you subtract the premium from the strike price:
For this investor, the break-even point is 49. The investor paid $6 for the option, so the option has to go $6 in-the-money in order for this investor to recoup the amount that she paid. As with call options, the break-even point is always the same for the buyer and the seller.
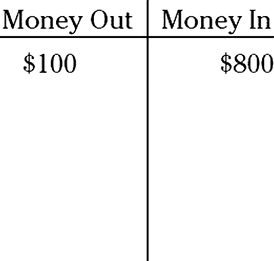
Selling put options
The following steps show you how to calculate the maximum gain and loss for the seller of a put option. I also demonstrate calculations for the break-even point. Here’s the ticket order for the example:
Sell 1 TUV Sep 30 put at 8
-
Determine the maximum gain.
The seller makes money only if the holder of the option fails to exercise it. This investor sold the option for $800 (8 × 100 shares per option); you put that number in the Money In side of the options chart. The maximum gain (the most this investor can make) is $800.

-
Find the maximum loss.
To calculate the maximum loss, you have to exercise the option at the strike price. The strike price is 30, so you place $3,000 (30 strike price × 100 shares per option) on the opposite side of the options chart. (Remember puts switch: The premium and strike price go on opposite sides of the options chart.)
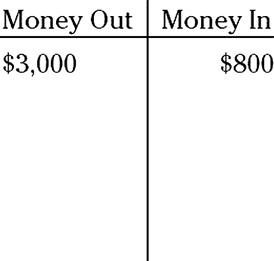
You’ve already determined the maximum gain; now look at the Money Out portion of the options chart and compare it to the Money In. The maximum potential loss for this investor is the $2,200 difference between the Money Out and the Money In.
You calculate the break-even point for buying or selling puts the same way: You use put down (the strike price minus the premium) to figure out the break-even point:
For this investor, the break-even point is 22. Because this investor received $8 for the option, the option has to go $8 in-the-money for this investor to lose the amount she received for selling the option. Put options go in-the-money when the price of the stock goes below the strike price (put down).
When you're selling a put option and you don't have a short position on that stock covering the put option or you don't own a put option on the same stock that would be in-the-money first, you're option position is considered uncovered or naked. If, however, you do have a short position on the stock for enough shares to cover the option or hold a put option on the same stock that would be in the money first, you're considered covered (known as a covered put).
Trading options: Opening and closing transactions
Although some investors hold onto their options long enough to actually exercise them, a lot of investors trade options the way that they trade other investments. On the Series 7, not only do you need to know the difference between opening and closing transactions, but you also have to be able to calculate the profit or loss for an investor trading options. This process is actually pretty easy when you break it down.
Putting things back where you found them: Doing opposite transactions
When distinguishing between opening and closing transactions, your key is to know whether this transaction is the first time or the second time the investor is buying or selling an option: The first time is an opening, and the second time is a closing.
Here are your opening transactions:
- Opening purchase: An opening purchase occurs when an investor first buys a call or a put.
- Opening sale: An opening sale is when an investor first sells a call or a put.
If an investor already has an option position, the investor has to close that position by doing the opposite — through a closing transaction. If the investor originally purchased the option, she has to sell to close it. By contrast, if she originally sold the option, she has to purchase to close. Here are the two types of closing transactions:
- Closing purchase: A closing purchase occurs when an investor buys herself out of a previous option position that she sold. For example, if an investor sold an XYZ Oct 40 call (opening sale), she would have to buy an XYZ Oct 40 call to close out the position. The second transaction is a closing purchase.
- Closing sale: A closing sale occurs when an investor sells herself out of a previous option position that she purchased. For example, if an investor bought an ABC Sep 60 put (opening purchase), she would have to sell an ABC Sep 60 put to close out the position. The second transaction is a closing sale.
When determining opening or closing transactions, whether the transactions are both calls or both puts doesn’t matter.
The following question tests your knowledge of opening and closing transactions.
Mr. Dimpledell previously bought 1 XYZ Oct 65 call at 8 when the market price of XYZ was 64. XYZ is currently trading at 69, and Mr. Dimpledell decides that now would be a good time to sell the option that he previously purchased. The second option order ticket would be marked
(A) opening sale
(B) opening purchase
(C) closing sale
(D) closing purchase
The right answer is Choice (C). This is the second time that Mr. Dimpledell does something with the option that he owns; therefore, the move has to be a closing transaction, and you can immediately eliminate Choices (A) and (B). Mr. Dimpledell has to sell himself out of the position because he owns the option. The second order ticket would have to be marked closing sale.
Tricks of the options trade: Calculating gains and losses
In addition to knowing how to mark the order ticket, you have to be able to figure out an investor’s gain or loss when trading options. This task isn’t difficult after you master the options chart. The key thing to remember is that when an investor closes, she does the opposite of what she did before.
The following question tests your mastery of options trades.
Mrs. Cleveland purchased 100 shares of DPY stock at $50 per share. Two weeks later, Mrs. Cleveland sold 1 DPY Oct 55 call at 6. Mrs. Cleveland held that position for three months before selling the DPY stock at $52 per share and closing the DPY Oct 55 call at 4. What is Mrs. Cleveland’s gain or loss on the transactions?
(A) $400 gain
(B) $400 loss
(C) $600 gain
(D) no gain or loss
The correct answer is Choice (A). This question introduces stock trades as well as options transactions, but that’s no problem. The options chart works for questions involving actual stocks and options or just options.
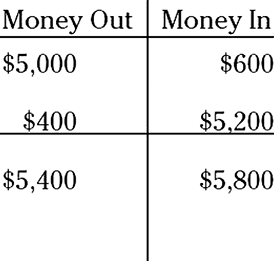
When you approach the transactions one at a time, the problem-solving process is actually pretty straightforward. Mrs. Cleveland purchased 100 shares of DPY stock at $50 per share for a total of $5,000; therefore, you enter $5,000 in the Money Out side of the options chart. Next, she sold the DPY 55 call for a premium of 6, so you need to enter $600 (6 × 100 shares per option) on the Money In side of the chart because she received money for selling that option.
Three months later, Mrs. Cleveland sold the stock for $5,200 ($52 per share × 100 shares) and received money for selling the stock. Place the $5,200 in the Money In side of the options chart. When closing the option, the customer has to do the opposite of what she did before. Originally, Mrs. Cleveland sold the option, so to close, she has to buy the option (make a closing purchase). She purchased the option for $400 (4 × 100 shares per option), so enter $400 in the Money Out side of the options chart. All that’s left for you to do is total up the two sides. Mrs. Cleveland has $5,800 in and $5,400 out for a gain of $400.
Mastering Complex Option Calculations
You may not be happy to hear this, but some investors out there will make your life difficult. But, hey, don’t be too upset, because working with these customers is how you’re going to earn your six- or seven-figures-a-year salary (not including pennies). The Series 7 exam also tests your knowledge on more-complex option strategies. Of course, you can use an options chart to make your life much easier.
Long straddles and combinations
Straddles are option positions in which the investor buys a call and a put or sells a call and a put on the same underlying security with the same strike (exercise) price and the same expiration month; if the securities are the same but the strike prices and/or expiration months are different, you have a combination instead. What’s nice is that combinations and straddles are virtually the same and the calculations are performed the same way.
This section deals with long positions, which involve purchases. (See “Short straddles and combinations” for info on sales.)
Long straddle
A long straddle is buying a call and a put with the same underlying stock, the same strike price, and the same expiration month. Investors who are expecting volatility in the underlying security purchase long straddles. These investors aren’t sure which direction the stock will go, so they’re covering their bases. They own a call option in case the price of the stock increases, and they own a put option in case the price of the stock decreases. Here’s an example of a long straddle:
- Buy 1 DEF Oct 40 call at 6
- Buy 1 DEF Oct 40 put at 3
In order to have a long straddle (or combination) you must have two buys.
Long combination
A long combination is buying a call and a put for the same underlying stock with a different strike price and/or expiration month. As with straddles (see the preceding “Long straddle” section), an investor of a long combination is looking for a security that’s volatile. The investor isn’t sure which direction the security will go, so she buys a call in case the security increases in value and a put in case it decreases in value. Here’s what a long combination may look like:
- Buy 1 LMN Oct 40 call at 6
- Buy 1 LMN Oct 30 put at 1
To distinguish a combination from a straddle, look at the expiration months and the strike (exercise) prices. If either one is different or both are different, you’re dealing with a combination.
The following example tests your skill at distinguishing a straddle from a combination.
An investor who owns 1 XYZ Oct 40 call option would like to establish a long combination. Which of the following option positions would fulfill his needs?
(A) Write 1 XYZ Jan 40 put
(B) Buy 1 XZY Oct 30 put
(C) Buy 1 XYZ Oct 40 put
(D) Buy 1 XYZ Jan 30 put
The answer you’re looking for is Choice (D). You can cross off Choice (A) right away because a long combination requires two purchases; Choice (A) is a sell (write), so it can’t be right. You can cross off Choice (B), too, because although it looks ever so close, it involves a different security. Choice (C) would be correct if the question had indicated that the investor was looking for a straddle. A long combination, however, is buying a call and a put for the same security with different expiration months and/or different strike prices. Therefore, the only answer that works is Choice (D).
Try another problem to practice using the options chart (see the earlier “Incorporating Standard Option Math” section for the basics on buying and exercising options):
An investor buys 1 ABC Mar 60 call at 6 and buys 1 ABC Mar 50 put at 3. ABC subsequently increases to 68. The investor exercises the call and immediately sells the stock in the market. After the put expires unexercised, what is the investor’s gain or loss?
(A) $100 gain
(B) $100 loss
(C) $500 gain
(D) $500 loss
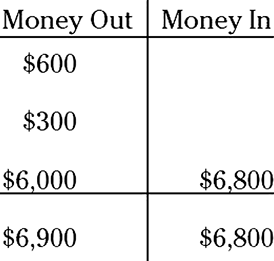
The correct answer is Choice (B). The investor bought the call for $600 (6 × 100 shares per option), so you have to enter $600 in the Money Out section of the options chart because that was money paid from the investor’s pocket. After that, the investor purchased the put for $300 (3 × 100 shares per option), so you have to enter $300 in the Money Out section of the chart. The next sentence states that the stock increased to 68, but it doesn’t tell you to do anything with that yet, so you don’t.
Next, you have to exercise the call option at the call strike price (always exercise at the strike price) and place the $6,000 (60 strike price × 100 shares per option) under its premium. (Remember calls same: The premium and strike price go on the same side of the options chart.) This investor sold the stock in the market for $6,800 (68 × 100 shares per option), which is Money In the investor’s pocket. Total up each side, and you see that this investor has a loss of $100.
When you get an option question with several steps (like the preceding one), look for the action words to tell you what to do. Action words include
- Buys, holds, owns, longs
- Sells, writes, shorts
- Exercises
Every time you see an action word, think of it as a clue to remind you that you have to put something in the options chart.
Short straddles and combinations
Short positions involve selling a call and a put with the same underlying stock. In straddles, the calls and puts have the same strike price and expiration month; with combinations, one of these values may differ.
Short straddle
A short straddle is selling a call and a put with the same underlying stock, the same strike price, and the same expiration month. An investor who is short a straddle is looking for stability. Because these investors are looking for a stock that’s not going to change too much in price, short straddles are considered a neutral position. If the stock doesn’t move in price, these investors will be able to keep the premiums they received for selling the options. A short straddle may look like this:
- Sell 1 GHI Oct 50 call at 9
- Sell 1 GHI Oct 50 put at 2
In order to have a short straddle (or combination), you must have two sells.
Short combination
A short combination involves selling a call and a put for the same underlying stock with a different strike price and/or expiration month. Similar to a short straddle, an investor who sells a combination has a neutral position and is looking for a security with stability. The investor is hoping the securities don’t go in-the-money so the options are not exercised and she gets to keep the premiums received. A short combination may look like this:
- Sell 1 QRS Dec 60 call at 4
- Sell 1 QRS Mar 55 put at 3
Fortunately, for both straddles and combinations, you can calculate the maximum gain and maximum loss by just placing the premiums in the options chart. No exercising is necessary. For instance, suppose an investor has the following ticket orders:
- Sell 1 TUV Jul 45 call at 6
- Sell 1 TUV Jul 40 put at 3
Here’s how you find the maximum potential loss and gain:
-
Find the investor’s maximum potential gain.
This problem involves a combination because the strike prices are different. However, if it were a straddle, you’d figure out the answer the same way. Place the premiums in the options chart. The investor sold the call for $600 (6 × 100 shares per option) and the put for $300 (3 × 100 shares per option). The transactions are both sells, so they have to go in the Money In side of the options chart. Add the numbers, and you can see that the maximum that this investor can gain (if the options never go in-the-money) is the $900 ($600 + $300) in premiums that she received.
-
Determine the investor’s maximum potential loss.
With straddles and combinations, the premiums help you determine both the maximum potential gain and the maximum potential loss. After entering the premiums in the options chart, you may notice that the Money Out side of the chart is empty, so the investor’s maximum potential loss is unlimited.
Break-even points for straddles and combinations
Straddles and combinations are a combination of calls and puts; therefore, you can find two break-even points (one on the way up and one on the way down). You must first add the two premiums together, because the investor either paid money twice (bought the call and bought the put) or received money twice (sold the call and sold the put). In the case cited in the preceding section, after you add the two premiums together, the total is 9 (6 + 3). Next, you use call up and add the combined premiums to the call strike price to get one break-even point. To get the other break-even point, use put down and subtract the combined premiums from the put strike price. This investor’s break-even points are 31 and 54:
- Combined premium: 6 + 3 = 9
- Call up: Call strike + combined premium = 45 + 9 = 54
- Put down: Put strike – combined premium = 40 – 9 = 31
You always have two break-even points for straddles and combinations. Make sure you call up (add the combined premiums to the call strike price) and put down (subtract the combined premiums from the put strike price) to get the break-even points.
Spreads
Investors create a spread position by buying an option and selling an option on the same underlying security. The maximum gain or loss with a spread position is limited. Investors create spread positions to either limit their potential loss or to reduce the premium paid.
Call spread
An investor creates a call spread position when buying a call and selling a call on the same underlying security. Additionally, the strike prices and/or expiration months have to be different. Here’s what a call spread may look like:
- Buy 1 JKL Aug 50 call at 9
- Sell 1 JKL Aug 60 call at 2
The following sections show you how to find the maximum gain, maximum loss, and break-even points for spreads. The process for finding the maximum gain, maximum loss, and break-even point is the same for both call spreads and put spreads. If you put the premiums in the options chart, you will see that the investor has more money out than money in. Therefore, this investor created a debit (long) spread.
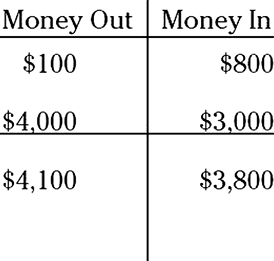
Put spread
An investor creates a put spread position when buying a put and selling a put on the same underlying stock with different expiration month and/or strike prices. Here’s an example of a put spread position:
- Buy 1 MNO Sep 30 put at 1
- Sell 1 MNO Sep 40 put at 8
When putting the premiums in the options chart, this investor will have more money in than money out, thereby creating a credit (short) spread. The options chart can make figuring out the particulars, such as the maximum gain, maximum loss, and break-even points easier. Here’s how you find these numbers, using the preceding put spread numbers:
-
Determine the maximum gain.
Begin by entering the premiums in the options chart. This investor bought the 30 put option for $100 (1 × 100 shares per option), so that $100 is Money Out of her pocket. Then this investor sold the 40 put for a premium of $800 (8 × 100 shares per option), which you enter in the Money In side of the chart because she received money for selling that option.
You end up with more Money In than Money Out; therefore, the investor’s maximum potential gain is $700 ($800 in minus $100 out).
To help you recognize a spread, notice that when you put the two premiums in the options chart, they are spread apart (one on either side). -
Find the maximum loss.
You already calculated the maximum gain, so next you need to exercise both options to get the maximum loss. When exercising put options, enter the strike prices (multiplied by 100 shares) on the opposite side of the chart from their premiums because puts switch (go on the opposite side of the chart from the premium). First, exercise the 30 put and enter $3,000 (30 × 100 shares per option) in the Money In side of the chart, which is opposite from the $100 premium. Next, exercise the 40 put and enter $4,000 (40 × 100 shares per option) in the Money Out side of the options chart, which is opposite its $800 premium. Total up the two sides, and you see that the maximum potential loss is $300 ($4,100 out minus $3,800 in).
 Placing just the premiums in the options chart can give you the maximum potential gain or maximum potential loss but not both. To find the other answer, you must exercise both options.
Determining the break-even point for spreads
To find the break-even point, begin by finding the difference between the two premiums because you had one buy and one sell:
This is a put spread; therefore, you have to subtract the 7 from the higher strike price. The higher strike price is 40, so the break-even point is 33:
For call spreads, you have to add the adjusted premium (after you’ve subtracted the smaller premium from the larger one) to the lower strike price. For put spreads, you subtract the adjusted premium from the higher strike price.
The following question tests your ability to determine the break-even point on spreads.
Miguel Hammer purchased 1 Apr 40 call at 9 and shorted 1 Apr 50 call at 3. What is Miguel’s break-even point?
(A) 43
(B) 46
(C) 49
(D) 53
The right answer is Choice (B). First, focus on the buy and the sell. If the investor is buying one option and selling another, you should be able to recognize it as a spread. Therefore, you have to find the difference between the two premiums:
Next, because it’s a call spread, you have to add the adjusted premium (after subtracting the smaller from the larger) to the call strike (exercise) price to get the break-even point:
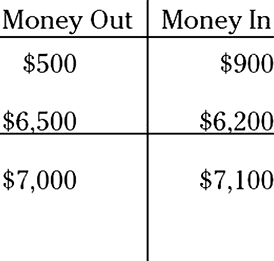
The following question tests your ability to answer a spread story question.
Mrs. Peabody purchased 1 DEF Mar 60 put at 5 and wrote 1 DEF Mar 65 put at 9 when DEF was trading at 68. Six months later, with DEF trading at 61, Mrs. Peabody’s DEF Mar 65 put was exercised. Mrs. Peabody held the shares of DEF for another two months before selling them in the market for $62 per share. Mrs. Peabody’s Mar 60 put expired without ever going in-the-money. What is Mrs. Peabody’s gain or loss?
(A) $100 loss
(B) $100 gain
(C) $700 loss
(D) $700 gain
The answer you’re looking for is Choice (B). I like to call such problems story questions because they take you on a journey, and this one is a tricky one. If you got this right, you’re a master of spreads.
Begin by placing the transactions in the correct side of the options chart. Because Mrs. Peabody purchased the DEF Mar 60 put at 5, you have to enter $500 (5 × 100 shares per option) on the Money Out side of the options chart because she spent that much to purchase the option. After that, she sold a DEF Mar 65 put for 9 and received $900 (9 × 100 shares per option) Money In for selling that option. The fact that DEF was trading at 61 when the option was exercised means nothing in this question, so feel free to ignore it.
Next, you have to exercise the 65 put that Mrs. Peabody sold. Because puts switch, you enter the strike price (multiplied by 100 shares) in the opposite side of the options chart from its premium. After you place the $6,500 in the Money Out section of the options chart, you have to sell the stock that Mrs. Peabody purchased when her option was exercised. She sold the stock in the market for $6,200 ($62 market price × 100 shares) and received cash for that transaction, so enter $6,200 in the Money In section of the chart. Total up the two sides, and you can see that good old Mrs. Peabody has a gain of $100.
Just like other option story questions (with several things happening), enter only items in the options chart when you see action words. Remember, every time you see an action word, such as purchased, wrote, exercised, sold, and so on, you know that you have to enter something in the options chart.
Understanding different types of spreads
When looking at a spread position, you may be asked to determine whether it's a vertical, horizontal, or diagonal spread. The way that you can tell is by looking at the strike prices and the expiration months. If just the strike prices are different, it's called a vertical or price spread. If just the expiration months are different, it's called a horizontal or calendar spread. If both the strike prices and expiration months are different, it called a diagonal spread.
To determine if an investor's spread position is bullish or bearish, a neat thing is that it doesn't matter whether you're dealing with call options or put options. All you need to do is look at the strike prices. If the investor purchased the option with the lower strike price and sold the one with the higher strike price (buy low, sell high) she's bullish. If the investor bought the option with the higher strike price and sold the one with the lower strike price, she's bearish.
When subtracting the premiums whether looking at call spreads or put spreads, you can determine if the investor has more money out of his pocket (debit spread) or more money in his pocket (credit spread). So for debit spreads (they can be debit call spreads or debit put spreads), the investor already has a loss, so the only way he can make money is if the options are exercised or the premium difference widens and he can close the transactions and make some money. Conversely, if the investor already has a credit spread (they can be credit call spreads or credit put spreads), he's already made the most amount of money he can, so he wants the options to expire or the premium difference to narrow so that he can close the transactions and make money.
Got it covered: Stock/option contracts
When an investor purchases or sells option contracts on securities she owns, that investor is choosing an excellent way to protect (hedge) against loss or to bring additional funds into her account, which would only be a partial hedge. The most common form is when an investor sells covered call options.
If an investor is selling a call option against a security that she owns, the investor is considered to be covered. She’s covered because if the option is exercised, the investor has the stock to deliver.
Take the following position as an example:
- Buy 100 shares of QRS at $47 per share
- Sell 1 QRS Dec 55 call at 4
-
Find this investor’s maximum potential loss.
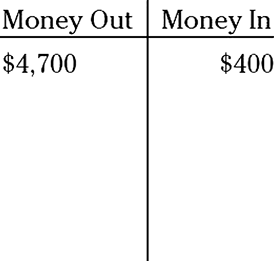
Place the purchases and sales in the options chart. This investor purchased 100 shares of QRS stock at $47 per share for a total of $4,700. That’s money spent, so enter $4,700 in the Money Out side of the options chart. Next, this investor sold 1 QRS Dec 55 call for a total premium of $400 (4 × 100 shares per option) and received money for selling that option, so you enter $400 in the Money In section of the options chart.
This investor has more Money Out than Money In, so the investor’s maximum potential loss is $4,300 ($4,700 minus $400).
-
Determine the investor’s maximum potential gain.
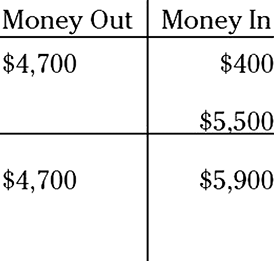
Placing the two transactions (in this case the stock purchase and the option sale) in the options chart helps you calculate the maximum gain as well as the maximum loss. To find the maximum gain, you need to exercise the option. You always exercise at the strike price, which in this case is 55. Take the $5,500 (55 × 100 shares per option) and place it under its premium. (Remember calls same: The exercised strike price and the premium go on the same side of the chart.) Total the two sides and you find that the Money In is $1,200 more than the Money Out, so that’s the investor’s maximum potential gain.
When the investor is covered, finding the break-even point is nice and easy for stock and options. Although you can use the options chart, you really don’t need to in this example case. First, look at how much the investor paid for the stock; then look at how much more she paid or received for the option. Find the difference, and you have your break-even point:
Because this investor paid $47 per share for the stock and received back $4 per share for selling the option, this investor would need to receive another $43 per share to break even.
Here’s how to find the break-even point for stock and options:
- If the investor purchased twice (bought the stock and bought a protective put option), add the stock price and the premium.
- If the investor sold twice (sold short the stock and sold an option), add the stock price and the premium.
- If the investor had one buy and one sell (for example, bought the stock and sold the option or sold short the stock and bought the option), subtract the premium from the stock price.
The following example tests your knowledge on stock and option problems.
Mr. Bullwork sold short 100 shares of DIM common stock at $25 per share and bought 1 DIM Aug 30 call at 3 to hedge his position. What is Mr. Bullwork’s maximum potential loss from this strategy?
(A) $300
(B) $800
(C) $2,200
(D) $2,700
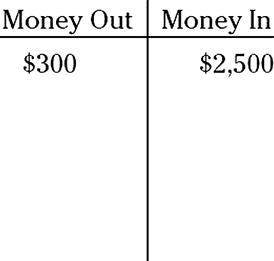
The answer you’re looking for is Choice (B). As always, you need to enter the initial purchase and sale into the options chart and see what you have. Your friend and client, Mr. Bullwork, sold short 100 shares of DIM common stock at $25 per share for a total of $2,500. Because Mr. Bullwork received the $2,500 for selling short, you have to put $2,500 in the Money In side of the options chart. Next, Mr. Bullwork purchased a DIM Aug 30 call to hedge (protect) his position in case the stock started increasing in value. You have to enter the $300 (3 × 100 shares per option) in the Money Out side of the options chart, because he paid money to purchase the option. Stop and take a look to see whether that calculation answers the question.
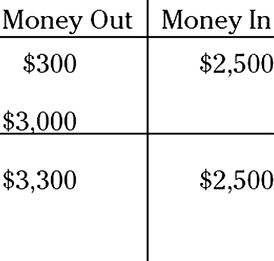
You see more Money In at this point than Money Out, so you have a maximum gain, not a maximum loss; therefore, you have to exercise the option to get the answer you need. Make sure you exercise the option at the strike price. The strike price is 30, so enter $3,000 under its premium. (Remember calls same: The premium and multiplied strike price go on the same side of the chart.) Total up the two sides, and you see that the maximum potential loss for Mr. Bullwork is $800 ($3,300 – $2,500).
Remember that investor who is long a particular security can buy an option on that same security to protect the position in the event that the price of the security declines or can sell an option on that same security to bring in money. For example, if an investor who is long 100 shares of DEF at 52 decides to sell a 55 call option at 4 on DEF (covered call) to bring some additional money (the $4 per share premium) into his account. The good part is that he lowered his break-even point to $48 ($52 per share for the stock minus $4 per share for the premium). The bad part is that he limited his upside potential for the remaining time on the option contract to $55 per share because he sold the right to have someone purchase the stock from him at $55. If this investor purchased a 50 put option at 2 (protective put) to limit his downside if the price of DEF starts to decrease, he just increased his break-even point from $52 to $54 ($52 per share for the stock plus $2 per share for the option).
The opposite holds true for investors who sold short. An investor who is short a particular security can purchase a call to protect himself in the event that the price of the security increases and can also sell a put on security shorted to bring some additional money into his account.
Investors who are long a stock may decide to sell a covered call on the underlying stock and purchase a protective put on the same underlying stock. This is known as a collar. If the cost of the premiums are equal, it is considered a cashless collar. Even though the cost of the trades may offset each other and now the investor has limited his downside risk, he has also limited his upside potential.
Off the charts: Multiple option contracts
Now before you start freaking out, know that working with multiple option contracts isn’t that much more difficult than working with single contracts. This change is simply a matter of an investor buying two, three, four, or more of the same option contract at one time. I guide you through the steps in this section.
When you work with multiple option contracts, approach the problem as though you were dealing with only one contract. You can easily do so by taking the multiple (the number of contracts) and placing it to the side of the options chart so you don’t forget it. Calculate the maximum potential loss or gain for a single contract, and then multiply that answer by the number of contracts.
The following sample calculations use this ticket order:
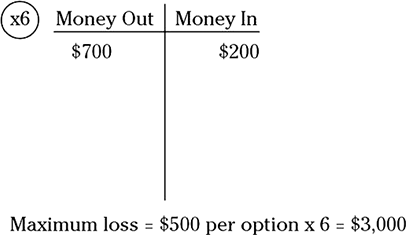
- Buy 6 ABC Oct 40 calls at 7
- Sell 6 ABC Oct 55 calls at 2
-
Find the investor’s maximum potential loss.
Take the number of contracts (in this case it’s six) and place it to the side of the options chart. Now this problem is as simple as the other options I mention in the earlier sections. In this case, you can look at the problem as though the investor is buying a call for $700 (7 × 100 shares per option), which is Money Out of the investor’s pocket. Next, the investor sells (writes) the ABC Oct 55 call for $200 (2 × 100 shares per option). Because this transaction is a sale, you enter it in the Money In side of the options chart. The investor has $700 out and $200 in; therefore, the maximum loss per option is $500. Now, take a look at the multiple. Take the maximum loss and multiply it by six (six options on each side), and you end up with a maximum loss of $3,000 for this investor.
Note: Some option strategies include having a different number of options on each side. However, you’re unlikely to be tested on these strategies on the Series 7. These strategies are covered more in the Series 4 exam (the Registered Options Principal Qualification exam).
-
Determine the investor’s maximum potential gain.
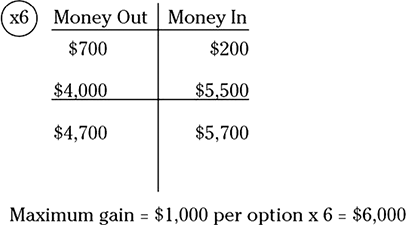
When dealing with spreads, the premiums give you the maximum gain or the maximum loss but not both. Because you’ve already so expertly determined the investor’s maximum potential loss, you need to exercise both options to get the maximum potential gain. Approach the question as if you were dealing with only one option on each side. Multiply the strike price of 40 by 100 shares per option to get $4,000. Enter $4,000 under its premium of $700. (Remember calls same: The premium and the strike price go on the same side of the chart.) After that, you can exercise the 55 call to get $5,500 (55 strike price × 100 shares per option). Enter $5,500 under its premium of $200 (again, following the calls same rule). Total up the two sides, and you have $1,000 more Money In than Money Out ($5,700 – $4,700). That value is the maximum gain for one option on each side. Because this investor has six options on each side, multiply the $1,000 by six to get $6,000 for this investor’s maximum potential gain.
What’s nice about finding the break-even point is that it works out the same whether the investor has 1, 10, 30, or more options on either side of the market. In this case, the investor bought one option and sold the other, so you need to find the difference between the two premiums. After subtracting the two premiums, you end up with an answer of 5:
This is a call spread (buying a call and selling a call — see the earlier “Spreads” section), so you need to add the adjusted premium (5) to the lower strike price (40) to get the break-even point. In this case, the break-even point is 45:
Follow the same strategy for all option transactions (spreads, straddles, combinations, and so on) when dealing with multiple options: Always take the contract size and move it to the outside of the options chart when calculating the maximum gain or loss. Then multiply the gain or loss by the number of contracts.
You have to worry (and I use that term loosely) about not only multiple option contracts but also multiple options and multiples of 100 shares of stock purchases or sales. This process is a piece of cake if you follow the rules that I give you. Check out the example, which uses the following position:
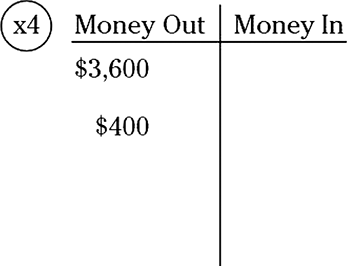
- Buy 400 shares of ABC common stock at $36
- Buy 4 ABC Oct 30 puts at 4
-
Determine the investor’s maximum potential gain.
This investor purchased 400 shares of stock and four options, which gives you a multiple of four. Take the multiple and move it to the outside of the options chart. You can then look at the problem as though the investor has only 100 shares of stock and 1 option, because you’ll deal with the contract size later. First, enter the $3,600 that the investor paid for the stock ($36 × 100 shares) in the Money Out side of the options chart, because the investor spent money to purchase the stock. Next, enter the $400 that the investor paid for the option (4 × 100 shares per option) in the Money Out side of the options chart because the investor purchased the option. Because the Money In side of the chart is empty, the investor’s maximum potential gain is unlimited.
-
Find the investor’s maximum potential loss.
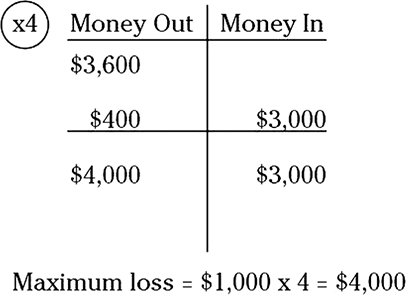
You’ve already determined the maximum potential gain; therefore, you need to exercise the option to get the maximum potential loss. The investor purchased a put option, so you have to enter the $3,000 (30 strike price × 100 shares per option) in the Money In side of the options chart. (Remember puts switch: The premium and the strike price go on opposite sides of the options chart.) Total up the two sides, and you see that you have $1,000 more Money Out than Money In, so the investor’s maximum potential loss is $1,000 per option. Because this investor has four options and 400 shares, you need to multiply the $1,000 by four to get the maximum loss of $4,000.
Here’s how you find the investor’s break-even point: In this case, the investor purchased the stock for $36 per share and the option for $4 per share. Therefore, this investor needs the price of the stock to go to $40 ($36 + $4) in order to break even:
Spending time on LEAPS: Long-term options
LEAPS is short for Long-term Equity AnticiPation Securities. The initial expiration for most options is nine months. LEAPS, however, can have expirations dates of up to three years. Investors can purchase LEAPS on a large variety of stocks, ADRs, the Dow, the S&P 100, and the S&P 500. Although most options have to be paid for in full, a unique characteristic of LEAPS options is that, unlike standard options, they can be purchased on margin by an investor who comes up with 75 percent of the premium. (See the “Margin on options” section later in this chapter for more info.)
Dividends and splits, more or less
This section addresses how an option contract is adjusted for corporate actions such as a company declaring a dividend or splitting its stock (see Chapter 6 for more info on splits and dividends). I begin with the basics and move forward from there.
Stock dividends
When a company declares a stock dividend, here’s what happens to option contracts:
- The number of option contracts remains the same.
- The strike price decreases.
- The number of shares per option contract increases.
Please peruse the following example to see how this works out. Here, the investor’s initial position is
4 ABC Sep 65 call options (100 shares per option)
If ABC declares a 5 percent stock dividend, you can find the investor’s position on the ex-dividend date (the first day the stock trades without the dividend).
Because ABC is giving a 5 percent stock dividend, the result will be 105 shares per option instead of 100 (5 percent more shares). To find the new strike price, multiply the original 65 call options by 100 shares per option to get 6,500. Next, divide the 6,500 by the 105 shares per option to get a new strike price of 61.90 (rounded to the nearest cent). The new position is
4 ABC Sep 61.90 call options (105 shares per option)
Cash dividends do not affect listed options. For example, suppose that an investor owns 1 ABC Oct 40 call option and ABC declares a $0.50 cash dividend. Although the price of the stock decreases by $0.50, the option still reads 1 ABC Oct 40 call.
Regular forward splits
Dealing with a regular forward split is relatively easy. In this case, you’re dealing with a 2-for-1, 3-for-1, 4-for-1, and so on. I cover your approach to tackling uneven splits in the next section. In an anything-for-1 split, here’s what happens:
- The number of option contracts increases.
- The strike price decreases.
- The number of shares per option remains the same (normally 100).
Check out the following example, where the investor has an initial position of
2 DEF Jul 60 calls (100 shares per option)
If DEF Corporation announces a 3-for-1 split, the investor’s position on the ex-dividend date is
6 DEF Jul 20 calls (100 shares per option)
In this case, the investor has three options for every one that she had before, and the strike price is 1⁄3 of what it was before:
Notice how you multiply the contracts by 3/1 and the strike price by the reciprocal (1⁄3).
A good way to double-check your work for all dividends and splits is to multiply the number of option contracts by the strike price and then by the number of shares per option. Do the same thing after you adjust the numbers for the dividend or split. Compare the answers. You should get the same number. If you don’t, you did something wrong.
Uneven and reverse splits
Uneven splits are similar to dividends in that the number of option contracts remains the same but the strike price and the number of shares per option change. Uneven splits are splits that are not x-for-1 (for example, 3-for-2, 4-for-3, 5-for-2, and so on). Look at the following example, where the investor has an initial position of
3 GHI Jun 50 calls (100 shares per option)
If GHI announces a 5-for-2 split, the investor’s position on the ex-dividend date is
3 GHI Jun 20 calls (250 shares per option)
First, because the investor has 5 shares for every 2 that she had before, you have to multiply the shares per option by 5/2:
Next, you have to multiply the strike price by 2⁄5:
To work out a reverse split (for example, 3-for-5, 2-for-3, and so forth), use the same process. Be aware that for reverse splits, the strike price increases and the shares per option decrease.
Nonequity Options
Although certainly most of the options questions you'll be dealing with on the Series 7 exam will relate to stock options, there are other options that you'll need to understand. Besides options on individual stocks, you can trade them on indexes, yields, and foreign currency.
Index options
Besides buying or selling options on an individual stock, you can also buy or sell index options. Index options allow investors to speculate on or hedge against the price movement of market or segments of the market. Like indexes themselves, index options can be broad-based or narrow-based. The main broad-based index options are the S&P 500 Index Options (SPX), the S&P 500 Volatility Market Index (VIX), and the S&P 100 Index Options (OEX). Narrow-based index options include options on the energy sector (IXE), financial sector (IXM), health care sector (IXV), technology sector (IXU), and so on.
Note: The Chicago Board Options Exchange (CBOE) VIX is a measure of how volatile investors believe that the S&P 500 index will be over the next 30 days. Typically, the higher the expectation of volatility, the higher the VIX premiums.
Premiums of index options
Like standard stock options, the pricing unit for index options is 100. This means that like standard stock options, you multiply the premium by 100 to get the actual cost.
Exercises in cash
Unlike regular stock options where when the option is exercised, the underlying security must be delivered, index options are settled in cash. This makes sense because it would be very difficult for investors to deliver a whole index. If the holder of an index call option exercises his option, he will receive the in-the-money amount multiplied by 100 based on the closing price at the end of the trading day, not the current value at the time of exercise.
Trading hours, settlement, and expiration dates
Narrow-based index options trade until 4:00 pm eastern time, and broad-based index options trade until 4:15 pm eastern time. Like equity options, the settlement date for index options is the next business day. The expiration date for index options is on the third Friday of the expiration month.
Index options are either broad-based or narrow-based. So people may buy or sell index options based on how they believe the market will perform overall (broad-based) or just how a segment of the market will perform (narrow-based). In this case, the same strategy of buying calls and selling puts if you're bullish and buying puts and selling calls if your bearish still applies. However, investors can also use index options to hedge (protect) a portfolio against a market decline. If an investor has a diverse portfolio of securities, he may decide to purchase an OEX or SPX put to protect himself in the event that the market declines. Also, an investor who has a large portfolio of health care sector stocks may purchase IXV put options to protect himself in the event that health care stocks are falling out of favor. There are even index options that only last a week (weeklys) that allow investors a way to trade index options based on economic news or earnings reports that may have a sudden impact on the market or a segment of the market.
You'll find that buyers and sellers of index options can incorporate most of the same strategies as equity option buyers and sellers. These strategies include covered writing, hedging, protective puts, straddles and combinations, and uncovered call or put writing.
Yield-based options
These are options based on yields instead of prices. Like index options, yield-based options are settled in cash. Yield-based options are based off of the yield of the most recently issued debt instruments such as the 13-week T-bill, the 5-year T-note, the 10-year T-note, and the 30-year T-bond. The value of the option is based on the difference between the value of the yield of the underlying debt instrument and the exercise price. For yield-based options, investors who're bullish on the yields (in other words, expecting that yields would increase) would buy yield-based calls or sell yield-based puts. Investors who're bearish on yields would buy yield-based puts or sell yield-based calls. For yield based-options, the strike price would need to be divided by 10 to determine the yield. For arguments sake, a strike price of 65 would represent a yield of 6.5 (65 strike price divided by 10). Look at the following example:
Mrs. Rice purchased an October 45 call based on the yield of a 30-year T-bond for a premium of 2.25 ($225: as with most other options, the premium gets multiplied by 100). The option expires nine months later when the settlement value is 48.50 (4.85 percent) and the call is exercised. What is Mrs. Rice's profit or loss?
To start, look to see how much the option is in the money (if it's out, Mrs. Rice lost her premium). In this case, the option is in the money by 3.5 (48.5 – 45), so the profit would be the difference of what Mrs. Rice got at maturity, which is $350 (3.5 × 100) and what she paid ($225) for a whopping profit of $125.
Unlike regular stock options, which are exercisable American way (any time up until the time of expiration), yield-based options are only exercisable European way (only on the day of expiration). However, European-style options may still be traded up to the last trading date.
There's an inverse relationship between bond yields and bond prices. So someone who is bullish on bond prices (believes they are going up) would be bearish on yields. Conversely, someone who's bearish on bond prices (believes they are going down) would be bullish on yields.
Foreign currency options
Although there are no options on the U.S. dollar (at least in the U.S.), U.S. investors can purchase options on the Australian dollar, Canadian dollar, British pound, Japanese yen, Swiss francs, and the euro. The idea behind this is that investors can speculate, or use foreign currency options to protect themselves (if they invest in foreign securities, U.S. companies with a foreign interest, or ones who get paid in foreign currency [importers and exporters]) based on what they believe is going to happen with a particular foreign currency in relation to the U.S. dollar. An investor who believes that the U.S. dollar will fall in relation to the euro might buy euro calls or sell euro puts because she is bullish on the euro compared to the U.S. dollar. Even though investors might be buying option contracts based on the euro, yen, or whatever, all exercises are settled in cash (same as index and yield-based options). Foreign currency options are actively traded on the NASDAQ OMX PHLX.
Contract sizes
Although foreign currency options used to be available to institutional or wealthy investors, the contract sizes are smaller than they used to be and now even a lot of retail investors would be able to afford them. The contract size for all foreign currency contracts except the yen is 10,000. The contract size for the yen is 1,000,000.
Strike prices and premiums
The strike prices of foreign currency options except for the yen are quoted in U.S. cents. The yen strike price is quoted in 1/100th of a U.S. cent. As with regular equity options, you have to multiply the premium by 100 to get the actual cost. So a premium of 2 means an actual cost of $200 (2 × 100). Now's where the contract size comes into play. If a euro contract is quoted with a premium of 2.5, the cost of the contract would be $250 (10,000 contract size ×0.025 quote size in pennies = $250).
Gaining Additional Option Info
To help you get a deeper understanding of options, you need to know a few additional things that you will most certainly see on the real-deal Series 7 exam. Some of these items include who issues the options, where you can get options quotations, what a ROP is, what a risk disclosure document is, and when options expire.
Clearing through the OCC
The Options Clearing Corporation (OCC) is the issuer and guarantor of all listed options. The OCC decides which options will trade and their strike prices. In addition, when an investor decides to exercise her option, it’s the OCC that randomly decides which firm on the other end will be responsible for fulfilling the terms of the option.
Getting the go-ahead: Registered options principal
In order to open an options account for a client, the client must receive an ODD (covered in the next section), and you must exercise due diligence by getting the customer’s investment objectives, employment status, estimated annual income, estimated net worth, estimated liquid net worth, marital status, number of dependents, age, investment experience and knowledge, and so on. In addition, the account and all transactions must be approved by a registered options principal (ROP), branch office manager, or limited principal-general securities sales supervisor. All options accounts must be approved or disapproved within ten business days. Please note that all option accounts may not be approved for all transactions — depending on the client, he may be approved for buying covered writing, uncovered writing, spreading, discretionary transactions, and so on.
Options are considered risky investments and are not suitable for all investors. Because of the extra risk of investing in options, all new accounts and all option order tickets must be signed by a registered options principal (ROP), which is a manager with a Series 4 license. The registered options principal determines the amount of risk that each investor can take. Certainly, sophisticated investors with a lot of money are able to handle more risk than new option investors with a limited supply of funds.
That’s ODD: Options risk disclosure document
Because options have a risk that is greater than almost any other investment, all investors must receive an options risk disclosure document (Options Disclosure Document or ODD) prior to their first options transaction. This ODD explains to investors option terminology and the risk involved in investing in options, such as the chance of losing all money invested or, if selling call options, facing an unlimited maximum loss potential. In addition to the risks, the ODD must also explain tax rules related to options, transaction costs, margin requirements, and so on.
The ODD is typically the first form of options-related communication sent to a customer. However, if any options communications are sent out prior to the delivery of an ODD, the approval of a ROP is not enough as it is with other options communications. In this case, options communications sent out prior to the ODD must be approved by either FINRA or an exchange such as the Chicago Board Options Exchange (CBOE). Approval must take place at least ten calendar days prior to the first use.
OAA: Options account agreement
Within 15 days after approval of the account by an ROP, the customer must provide proof of background and financial information used when opening the account. In addition, the customer must sign and return an options account agreement (OAA). Basically, the OAA just states that the customer has read the ODD, understands the risk associated with trading options, and will abide by the rules and regulations regarding options trading. Should anything change (such as the customers, investment objectives, or financial situation), the customer agrees to notify the firm. In the event that the OAA is not received within 15 days after approval of the account, the customer cannot open any new options positions.
Last trade, last exercise, and expiration of an option
Unlike stock certificates, options do expire after a certain period of time. In addition, investors are limited as to when they can trade and exercise an option. Here’s the timeline to keep in mind:
- Last trade: The last time an investor can trade an option is 4:00 p.m. EST on the business day of expiration.
- Last exercise: The last time an investor can exercise an option is 5:30 p.m. EST on the business day of expiration. If an option is in-the-money by at least one point at expiration, it will be automatically exercised. A vast majority of options can be exercised any time up till expiration — this is known as American style. However there are also European-style options that can only be exercised on the expiration date. European-style options include capped index options and some foreign currency options.
- Option expiration: Options expire at 11:59 p.m. EST on the third Friday of the expiration month.
Exercise and assignment
When taking the Series 7 exam, you will be expected to have a basic understanding of how options are exercised and assigned. Options are cleared through the OCC. Here’s how an option is exercised:
When a client wants to exercise an option she owns, she contacts her broker-dealer. The broker-dealer contacts the OCC. The trade settles in two business days after the OCC is notified because when the investor is exercising an option, she is actually trading stock (the right to buy or sell stock). Stock trades settle in two business days, so exercises of options settle in two business days (trades of options settle in one business day).
The steps involved look like this:
- Client #1 tells her broker-dealer (Broker A) to exercise the option.
- Broker A notifies the Options Clearing Corporation.
- The Options Clearing Corporation chooses the contra broker (the broker-dealer on the other side of the transaction — Broker B) randomly.
- Broker B assigns (chooses the client — Client #2) either randomly, first-in-first-out (FIFO), or by any other method which is fair and reasonable. However, Broker B cannot choose the assignment based on size (the one with the most options, the one with the least options, and so on). (The firm's method of assignment must be disclosed to options clients in writing.)
- Client #2 sends the proceeds (stock or cash) to Broker B.
- Broker B sends the proceeds directly to Broker A. (The OCC doesn’t handle stock or cash.)
So if you were to look at a flow chart, it would look something like this:

Although most exercises of options are settled by the delivery of the underlying security, there are some that are settled by the delivery of cash. Specifically, index options (options on an index of securities) and foreign currency options are always settled in cash. This just makes sense because investors can’t be expected to deliver an entire index for index options nor be expected to deliver the underlying foreign currency for foreign currency options.
Note: No matter which way the contra broker (Broker B in this case) chooses the client, it should be fixed and it must be disclosed to options customers in writing. In addition, the contra broker must inform of the method to the exchange where the options are traded and receive approval.
Margin on options
As stated previously, with the exception of LEAPS, options cannot be purchased on margin, they must be paid for in full. LEAPS can be purchased on margin by depositing 75 percent of the premium. All other options must be paid for in full. However, for an investor who has a margin account, buying or selling stock at the same time as buying or selling calls or puts on the same security at the same time does change the situation.
An investor buys 100 shares of HIJ on margin at 44 and writes an HIJ 45 call at 5.
The margin call for the securities purchased is $2,200 ($44 × 100 shares × 50 percent) but since the investor received $500 (5 × 100 shares per option) from selling the option, he only has to deposit $1,700 ($2,200 – $500) as a result of the two transactions. So in this case, even though the margin requirement on the stock is $2,200, the margin deposit required is only $1,700.
An investor buys 100 shares of HIJ on margin at 44 and buys an HIJ 40 put at 3.
The margin call for the securities purchased is $2,200 ($44 × 100 shares × 50 percent) but since the investor purchased the put option for $300 (3× 100 shares per option), he has to deposit $2,500 ($2,200 + $300) as a result of the two transactions. So in this case, even though the margin requirement on the stock is $2,200, the margin deposit required is $2,500.
The following example will show what happens with the margin requirement for LEAPS.
An investor buys 1 TUV Jan 40 call LEAP with a 30-month maturity at 12. The margin call for the LEAP is $900 ($12 premium × 100 shares per option × 75 percent). You should note that once the LEAP reaches nine months to maturity or less, the investor must have 100 percent of the current market value for the LEAP on deposit (100 percent maintenance requirement on options with maturities of nine months or less).
When an investor purchases stock and purchases or sells an option on the same security at the same time, the deposit required by the purchase of the stock is either decreased or increased by the amount of premium on the option depending on whether he's selling or buying. So an investor who purchased 100 shares of DIM stock at 35 in a cash account and simultaneously sold a DIM Oct 40 call (covered call) for 6 would only have to deposit $2,900 ($3,500 for the stock less the $600 received for the premium).
The margin requirement for spreads is equal to the maximum potential loss.
Taxes on options
Taxes on options are taxed as capital gains or capital losses. However, it can get a little bit tricky depending on other circumstances.
Closing transactions
Remember, this is when an investor either purchases or sells an option and then closes that option position by either selling or purchasing the same option (see “Trading options: Opening and closing transactions” earlier in this chapter). To determine the capital gain or loss, all you have to do is subtract the selling price from the purchase price and if you have more money in, it's a capital gain; more money out, it's a capital loss. Options with one year to maturity or less (most are 9 months) are taxed as short-term gains or losses. If the investor originally purchased a LEAP and held it for over a year before closing the position, it would be taxed as a long-term gain or loss.
Option expiration
If an option expires unexercised, the premium will be treated as either a capital gain for the seller or capital loss for the purchaser. Since most options mature in nine months or less, the gain or loss will be short term. However for the buyer (not the seller) of a LEAP option with over one year till maturity that expires unexercised, it will be a long-term capital loss.
Option exercises
Although most investors trade their options, some do exercise. Remember, when an investor exercises an option, he has the right to purchase the stock or the right to sell the stock. What this means is that the tax situation gets a little more complicated. In cases where the investor purchases the stock, you may have to determine the cost basis (what the investor paid to purchase the security). If the investor sells the stock, you have to determine the proceeds of sale (how much the investor received from selling the security). Fortunately for you, you already calculated this when you determined the break-even point for option purchases and sales. In addition, when options are exercised, the holding period for the securities purchased begins at the time of exercise, not at the time the option was purchased or sold.
An investor buys 1 CSA Jan 40 call at 6. Four months later with CSA trading at 52, the investor exercises his call. What is the investor's cost basis for the CSA stock purchased?
Remember that the investor purchased the right to buy the stock at 40. Since he paid 6 for the premium, his cost basis per share is 46 (40 + 6) or a total of $4,600 (46 × 100 shares per option). This investor may immediately sell the stock in the market for a short-term capital gain or hold onto the stock as long as he wants. If he sells the stock above his cost basis, it's a capital gain; below his cost basis, it's a capital loss. If he holds the stock for over a year, the gain or loss will be long term.
An investor sells 1 CSA Jan 40 call at 6. Four months later with CSA trading at 52, the investor's call is exercised. What is the investor's proceeds of sale cost basis for the CSA stock sold?
I used the previous example so that you could look at it from the seller’s point of view. This investor sold the right to have someone buy CSA stock from her at $40 per share. So once exercised, this investor received the $40 per share but also got to keep the $6 per share premium received. So the proceeds of sale is $46 per share (40 + 6) or a total of $4,600 (46 × 100 shares per option). (Notice that the cost basis and proceeds of sale are the same.)
Buying stock and buying puts
Some investors who purchase stock also buy puts on the same stock to hedge (protect) their position in case the stock price drops too low. Different tax situations come into play depending on when the option was purchased (same day, within the year, or over a year later).
- Married put: A married put is when an investor purchases a stock and purchases a protective put on that stock the same day. In this case, the cost of the stock (on a per share basis) and the cost of the premium (on a per share basis) are added together to establish the investor's cost basis. Let's say that an investor purchased 100 shares of JKL stock at 47 and purchased a JKL 45 put option for 4 on the same day. In this case, the investors cost basis on the stock would be 51 (47 + 4). For the investor to have a gain on the position, he would have to sell his shares at a price above the cost basis. Married puts do not affect the holding period of the stock.
- Within the year: Instead of the investor purchasing the stock and the put the same day, he purchases the protective put in a year or less after purchasing the stock. At the time the investor purchased the protective put, the investor had not yet established a long-term holding period (long-term being over one year). Unlike a married put where the cost basis is increased on the stock purchased, because the stock and protective put were purchased on different days, the trades are treated as if they're separate. However, if the investor has held the stock for one year or less prior to purchasing the protective put, then the holding period starts over for tax purposes.
- Over one year: If the investor purchases a protective put on stock that she's owned for over one year, she's already established a long position. As with the situation where the investor purchased the stock and protective put within a year, the stock and option are treated as two different positions. However, since this investor has already established a long position on the stock, it remains a long position and the holding period doesn't restart by her purchasing a protective put.
Some additional option rules
Yes, I know … even more? Don’t blame me; I didn’t design the test. Anyway, as with the preceding section, I think a quick perusal of the following items will give you enough of a general understanding of some of the additional rules that you should be able to pick them out of any multiple-choice questions posed on the exam.
- Position limits: A number placed on the amount of option contracts that a individual, registered rep, or investors acting together can hold or write on the same side of the market (bullish or bearish) on the same security. As of now, the limit is 250,000 contracts on the same side of the market for the most heavily traded options. This is subject to change but let's just say the amount will always be extraordinarily large. To see if there's a violation, long calls and short puts are added together because they're both bullish and short calls and long puts are added together because they're both bearish. As with equity options, position limits are also established for non-equity options (foreign currency options, yield-based options, and index options).
- Exercise limits: A number placed on the amount of option contracts that a person can exercise on the same side of the market (bullish or bearish) within five consecutive business days. The exercise limit is the same as the position limit. So if the position limit for a particular security is 100,000 contracts, the most a person may exercise on that security is 100,000 contracts on the same side of the market in a five consecutive business day period. As with equity options, exercise limits are also established for non-equity options (foreign currency options, yield-based options, and index options). Typically, the exercise limits are equal to the positions limits.
- Limit on uncovered short positions: FINRA may decide to limit the amount of uncovered short positions on option contracts of a given class if deemed necessary for the protection of investors.
- Restrictions on option transactions and exercises: As with the limit on uncovered short positions, FINRA may also place restrictions on option transactions or the exercise of option contracts in one or more series of options of any class when deemed necessary to help maintain a fair and orderly market.
- Open order on the “ex-date” (ex-dividend date): Since the underlying stock price will be lowered due to a dividend, the OCC will adjust option contracts accordingly unless otherwise instructed by the customer.
- Confirmations: Members are responsible for providing a written confirmation of each option transaction for each customer’s account. The confirmation must include the type of option (call or put); the underlying security or index; the expiration month; the exercise (strike) price; the number of option contracts; the premium, trade, and settlement dates; whether it was a purchase or sale (long or short); opening or closing transaction; whether it was done on a principal or agency basis; the amount of commission; and so on. There’s more on confirmations in Chapter 16 — yippee!
- Statements of account (account statements): All clients must receive account statements at least monthly if there has been any trading in the account for the previous month and at least quarterly (once every three months) when there has been no trading in the previous month. The account statements must show the security and money positions, entries, interest charges, and any other charges assessed against the account. Account statements are covered in more detail in Chapter 16.
- Uncovered short option contracts: Because uncovered short option contracts are the riskiest of all option contracts, member firms must create standard rules for evaluating the suitability of customers who plan on writing uncovered options.
- Maintenance of records: Each member must keep a current log, index, or other file for options-related complaints. Each complaint should be easily identified and easy to retrieve if necessary. Each complaint file (hopefully there aren’t many) must contain the identification of the complaint, the date the complaint was received, the name of the registered rep handling the account, a description of the complaint, any action taken (if any), and so on.
- Discretionary account: As with any discretionary account in which the client gives you the right to trade his account without preapproval, it must be approved by a principal (manager). Options discretionary accounts must be approved in writing by a registered options principal (ROP) or limited principal-general securities sales supervisor, and written approval must be received from the client. In addition, discretionary accounts must be reviewed frequently by an ROP.
- Suitability: You may not recommend any option transaction to a customer unless you believe that the transaction is suitable for the customer. Remember that you should already know the customer’s investment objectives, financial information, and so on. In other words, you should not be recommending a risky option transaction for someone you deem incapable of handling the risk.
- Supervision of accounts: Members conducting an options business must have a written supervisory system in place to adequately address the public customer’s option business. In addition, each branch office must have either a registered options principal or a limited principal-general securities sales supervisor in order to conduct options business.
- Volume: Trading volume is the number of contracts traded in a given period of time.
- Open Interest: The number of option contracts that are currently open. These are option contracts that have been traded but not yet liquidated. Options can be liquidated by either exercise or an offsetting trade.