Chapter 9
JMP on the Web
Introduction
In this chapter, I introduce you to a couple of examples that represent the continuing commitment by JMP to its users: the Interactive Learning Tools and the Learning Library. These are resources primarily designed for teachers and learners of statistics and are a small subset of resources available to the vast and varied JMP community.
Interactive Learning Tools
To begin to use the Interactive Learning Tools, direct your browser to the JMP website, www.jmp.com. You should see the home page, and at the top please notice the section shown in figure 9.1.
Figure 9.1 The home page

From this rather impressive collection of resources, select ACADEMIC and focus your attention on the list at the left of the page, shown in figure 9.2.
Figure 9.2 Our focus

Now select Interactive Learning Tools. You will be greeted with what is shown in figure 9.3, which is a partial list of some demonstration modules written for the classroom. These modules are JSL scripts, that is, computer programs written to be executed by JMP. You can execute them by double-clicking on the files or using the File ![]() Open sequence from the JMP menu. These JMP scripts have been written for teachers and students and can be used by teachers in a demonstration mode or by students as a computer lab assignment. They are completely free and exemplify another indication of the support by JMP for the teaching and learning of statistics.
Open sequence from the JMP menu. These JMP scripts have been written for teachers and students and can be used by teachers in a demonstration mode or by students as a computer lab assignment. They are completely free and exemplify another indication of the support by JMP for the teaching and learning of statistics.
Figure 9.3 Modules and demos

You will need to sign up to get a JMP account, which is standard operating procedure for many websites. I place my experience with such sites on a scale from 1 to 10, with 1 meaning a neverending stream of commercial appeals and other messages, and 10 meaning that we’re just keeping track of usage here, as part of our internal quality control. On that scale, JMP is a 9.9!
Almost all the modules come with a demonstration about how to use them. A teacher can run the demonstrations as part of formal instruction, and the student may use them as reminders when needed. My favorite is the confidence interval for the mean, and I will use that module to give a sense of what can be done with these modules. Of course, the dynamism will be lost in my description! If you follow along you will see this module in action. The confidence interval panel with my entries is shown in figure 9.4.
Figure 9.4 Confidence interval panel with values

When I ran the simulation with 100 samples and selected DrawSamples I was presented with what is shown in figure 9.5. Of course, your results will differ from mine—such is life when simulating.
Figure 9.5 Simulation results

After running the simulation, your students may note the % include Population Mean is not equal to the confidence level, in this case 95 percent. You might point out that this is an example of what is known in the cognitive psychological literature as the Law of Small Numbers. That is the belief that if a probability of success is equal to 0.95, a run of 100 (or other small number) trials will give exactly 95 successes. Notice also that after the simulation stops you can either reset it or take additional samples. If students elect to reset, they will see that for a small finite number of samples, one does not always get the same number of confidence intervals containing the population mean. Variability at work! If they elect to take additional samples, they can watch the % include Population Mean get closer and closer to the confidence level, the statistical Law of Large Numbers in action. The power of simulation is well known, and these JMP simulations are not only informative, but easy to run.
As of this writing, there are nine of these modules, but keep looking—these will probably soon be known as the “first” nine. I encourage you to try more of these modules.
The Learning Library
Another resource at the JMP site is the Learning Library option shown in figure 9.6. This is a great resource for at least two kinds of people: (1) the instructor-scholar, burdened with many papers, students with questions, and other classroom paraphernalia; and (2) the assuredly less burdened but all-too-common student who reads only under duress. The Learning Library is a remarkably well-written set of materials. The remarkable part is not that it is well written, but that it is so well written with a space limitation of a single page per topic.
Figure 9.6 The Learning Library

The Learning Library, downloaded in toto as a .pdf file or referenced singly by topic online, offers a fast answer to the JMP user’s simple questions. I must confess that the Learning Library is something I rarely use; the interface of JMP is so intuitive that even a small amount of experience gives one a kind of JMP “Zen.” However, while I am making confessions, here is another one. I recently used one of these one-pagers. I wanted to analyze some data on Florida hurricane damage using simple ordinal logistic regression. Ordinal logistic regression is a technique I rarely have occasion to utilize these days, and as it happened, I was on the road without my JMP library. I brought up the “Simple Logistic Regression” page in the Learning Library to see what was there. Not only did I find the information I needed, but I also found something I knew JMP could do but I had never actually considered implementing with logistic regression: using different markers and colors in the display. To make a short story shorter, this one-page presentation was responsible for my graph being much better than I had originally envisioned.
To illustrate how to take advantage of the Learning Library, select Graphical Displays and Summaries to get to what is shown in figure 9.7, and then select Bar Charts and Frequency Distributions to get to that represented in figure 9.8. This is a topic we have already discussed; now I would like you to put yourself in the mind of a typical student learning to use JMP as well as statistics, and appreciate how much information has been packed into that single page. Even the most reluctantly reading student—perhaps especially the most reluctantly reading student—would find needed answers, compactly presented.
Figure 9.7 Graphical displays
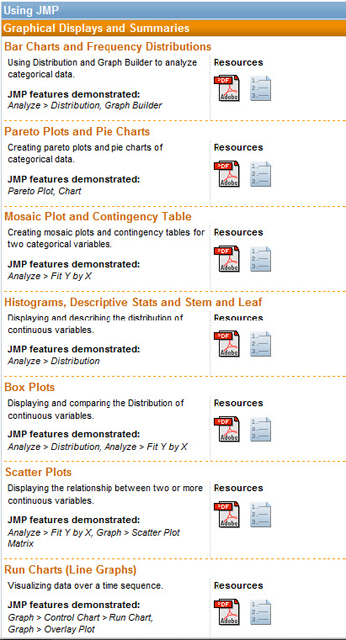
Figure 9.8 Bar charts and frequency distributions—on one page

What Have We Learned?
In this chapter we considered two of the resources available at www.jmp.com: Interactive Learning Tools and the Learning Library. These are a subset of the resources of JMP that are particularly useful to teachers and students of statistics.