
11
Monitoring
Out in the real world, in a production environment, is where your application gets really tested to its limits. Despite all the effort in developing test scenarios, and going through different stages of quality assurance, there will come a time when there are edge case scenarios that the development team or the quality assurance team might have not considered and, therefore, these missed edge case scenarios might cause bugs to occur. There are times when hardware-related issues will be encountered, or sometimes there will be some code-related performance bottlenecks causing timeouts and unhappy clients. It happens, but it’s not the end of the world. It would be great if the development team had access to a production environment’s usage statistics, the CPU or memory usage of the containers, the most accessed controllers, the stack trace of an exception, and so on.
Having this information will help you and your team resolve issues more quickly when they happen. It will give you and your team a better understanding of how heavily your application is being used. In this chapter, we’ll use an application performance monitoring (APM) tool to give us the ability to collect and go through this valuable application performance and usage data.
In this chapter, we will go through the following topics:
- Setting up New Relic APM for PHP
- Going through the application performance data
Technical requirements
For this chapter, you are expected to have gone through the processes and steps in Chapter 10, Continuous Delivery, and need to have access to the AWS EC2 instance that is used to host the PHP application; the code base for the PHP application can be found at https://github.com/PacktPublishing/Test-Driven-Development-with-PHP-8/tree/main/Chapter%2010.
Setting up New Relic APM for PHP
There are a lot of different APM tools available out there, but in this book, we will just focus on using New Relic.
New Relic offers a lot of performance monitoring tools, but in this book, we will focus on monitoring our PHP application, and the infrastructure it runs on top of.
In this section, we will install and configure the New Relic PHP agent in our EC2 instance so that we can start collecting PHP and server data.
Creating a New Relic account and license key
The first thing you will need before installing the New Relic agent into the EC2 instance is a free New Relic account. You can sign up at https://newrelic.com/signup to create a free account. You will need your license key later in the setup process.
The license key can be found on the New Relic API keys page under the Administration dashboard:
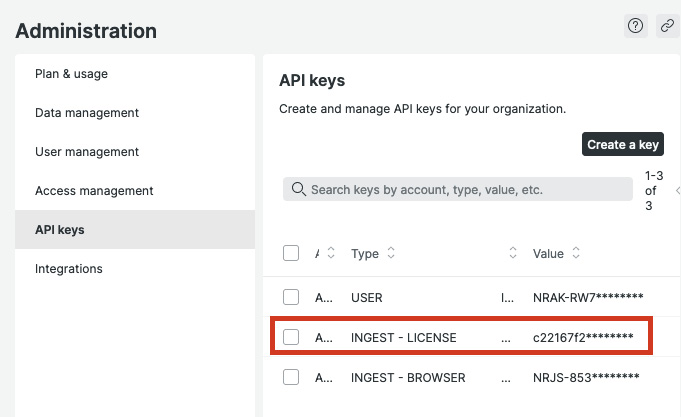
Figure 11.1 – License key
You can copy the license key from this page, and use it to set up the agent in the next steps.
Installing a New Relic agent in the PHP 8 container
To install the PHP agent, we’ll need to connect to the AWS EC2 instance we are using to serve the application.
Connect to the EC2 instance using SSH or the AWS EC2 Instance Connect web application.
Once inside the instance, we’ll install the agent inside the container. This can be a part of your deployment automation, but in this book, we will install it manually. You can run the following command to connect to your PHP container:
docker exec -it docker-server-web-1 /bin/bash
Once inside the container, run the following commands to install the PHP agent:
curl -L "https://download.newrelic.com/php_agent/release/newrelic-php5-10.2.0.314-linux.tar.gz" | tar -C /tmp -zx
export NR_INSTALL_USE_CP_NOT_LN=1
/tmp/newrelic-php5-*/newrelic-install install
After running these commands, you will be prompted to enter your New Relic license key. Paste the license key from the New Relic API keys page, and finish the installation process:

Figure 11.2 – PHP Agent Installation result
After the installation process, you will notice that there is a new ini file created in /usr/local/etc/php/conf.d/newrelic.ini. You can modify this manually to set the PHP application name of your choice, or just run the following command:
sed -i
      -e 's/newrelic.appname = "PHP Application"/newrelic.appname = "NEWRELIC_TDDPHP"/'
      -e 's/;newrelic.daemon.app_connect_timeout =.*/newrelic.daemon.app_connect_timeout=15s/'
      -e 's/;newrelic.daemon.start_timeout =.*/newrelic.daemon.start_timeout=5s/'
      /usr/local/etc/php/conf.d/newrelic.ini
After updating the newrelic.ini file, restart apache2 by running the following command:
service apache2 restart
The New Relic PHP agent is now installed in the PHP container serving the Symfony and Behat applications.
Next, we’ll see whether the agent is able to send data to New Relic, and we’ll go through the New Relic dashboard to see what performance data will be available to us.
Going through the application performance data
In the previous section, we installed a tool to collect performance and usage data from our PHP application. This data will be useless unless we are able to view and make sense of the data.
To view the data being gathered by the PHP agent we just installed, follow these steps:
- Go back to the new relic dashboard at https://one.newrelic.com and then click on the APM & services menu item:
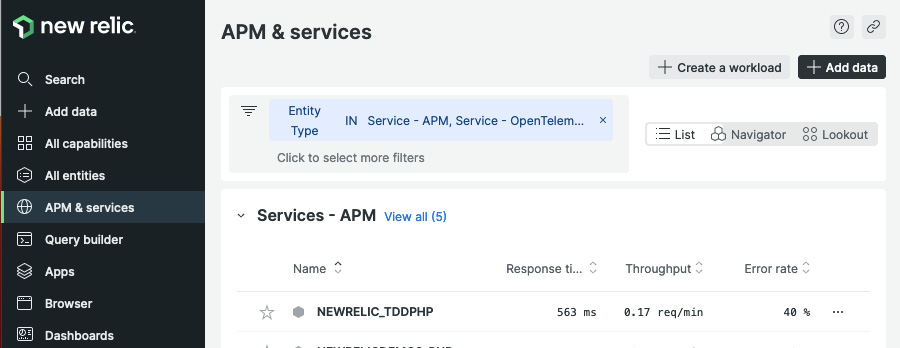
Figure 11.3 – New Relic services – APM
- Next, click on the NEWRELIC_TDDPHP item on the dashboard. You’ll notice that this is the same PHP name we used in the /usr/local/etc/php/conf.d/newrelic.ini file.
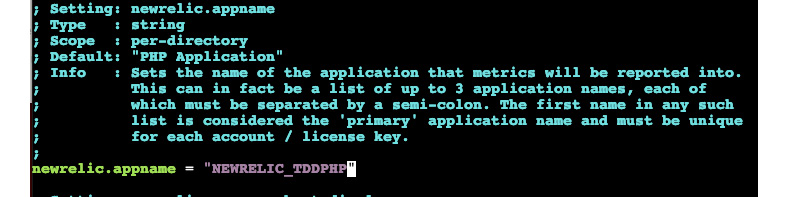
Figure 11.4 – newrelic.ini – newrelic.appname
Once you are monitoring a lot of applications, these app names will come in very handy so it would be great if you could standardize your app names. You can read more about New Relic’s APM best practices in the official documentation found at https://docs.newrelic.com/docs/new-relic-solutions/best-practices-guides/full-stack-observability/apm-best-practices-guide/.
After clicking on the NEWRELIC_TDDPHP item, you will be redirected to the APM dashboard:
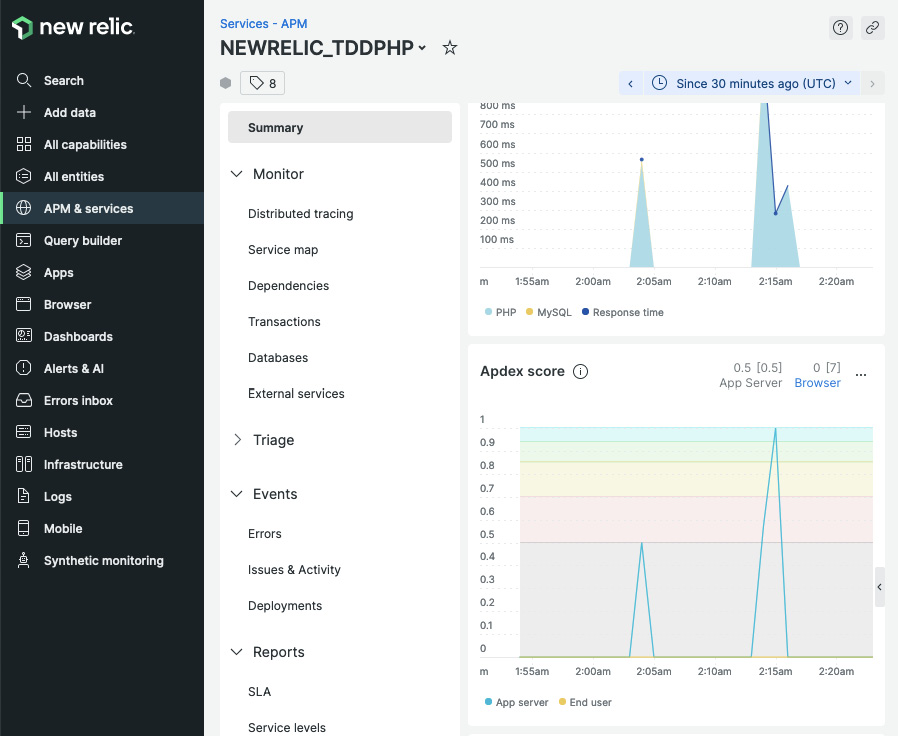
Figure 11.5 – PHP APM dashboard
On the dashboard, you will be able to view different metrics regarding the PHP application we are monitoring. For example, we can check which DB operations take the longest to execute:
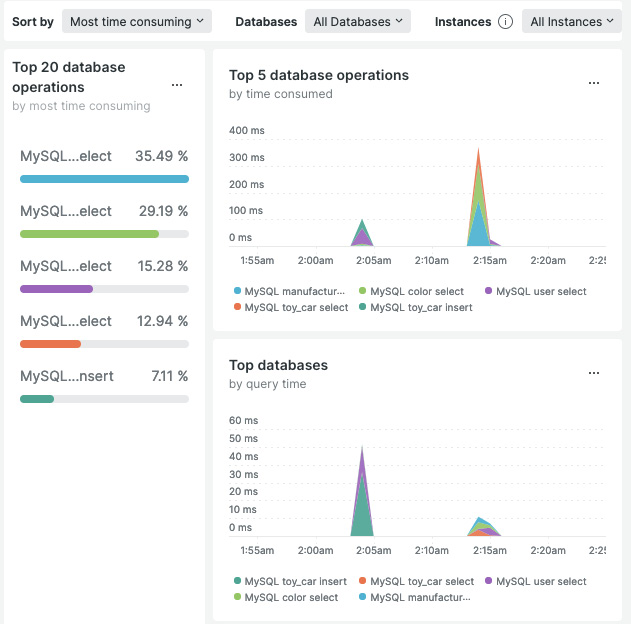
Figure 11.6 – DB operations
You and your team can learn a lot from the data being reported on these dashboards. You can spot performance bottlenecks, and go through the error exceptions that the users are encountering.
On the Errors dashboard, you will be able to view metrics about the errors being reported by the application:
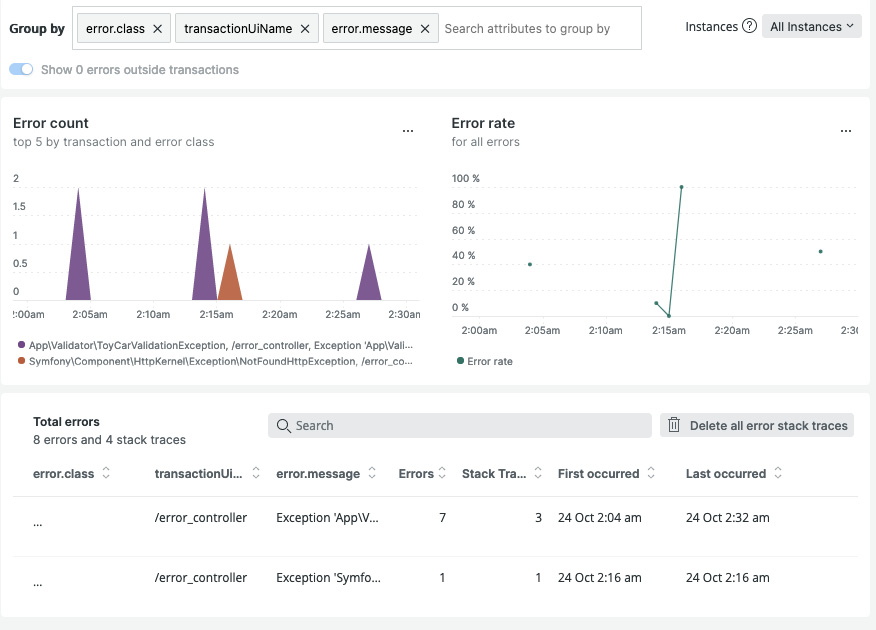
Figure 11.7 – Errors dashboard
You can also click on the error item itself to get a deeper understanding of what’s going on:
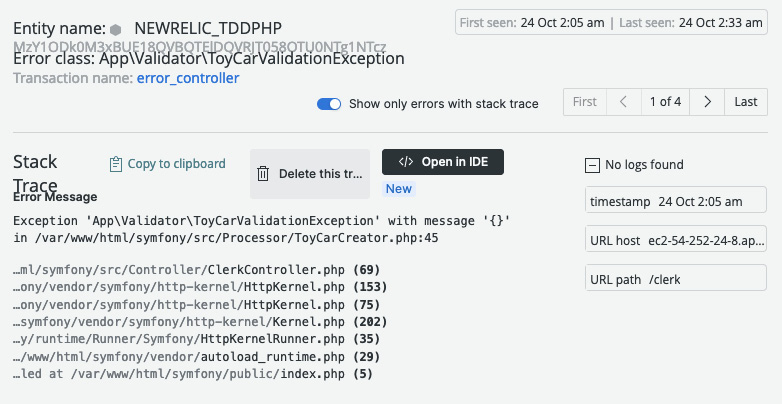
Figure 11.8 – Exception trace
Here, you can see which specific object threw an exception, and what exception was thrown, along with the stack trace. This is all valuable information that can help you and your team spot and fix issues.
Monitoring other containers in your setup
In our example application, we are using more than one container. We can also monitor these containers, such as the MySQL server, and that example phpMyAdmin container we were using.
In the EC2 Console, run the following command to install the New Relic agent into our AWS EC2 Linux instance:
curl -Ls https://download.newrelic.com/install/newrelic-cli/scripts/install.sh | bash && sudo NEW_RELIC_API_KEY=<your licence key> NEW_RELIC_ACCOUNT_ID=<your account id> /usr/local/bin/newrelic install -n logs-integration
Make sure to include your New Relic license key and account ID, which can be found on the API keys page, as shown earlier in the chapter.
After the installation process, go back to the New Relic dashboard, and in the left-hand menu, click on the All entities menu item, then select Containers. You’ll then see all of the Docker containers we have in that EC2 instance:
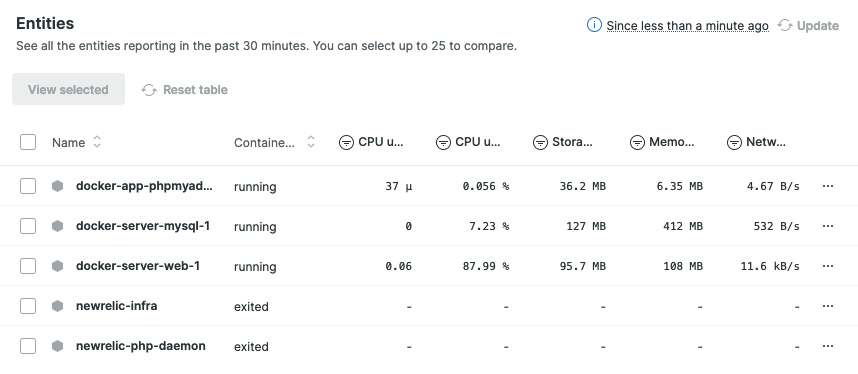
Figure 11.9 – Docker containers performance monitoring
If you click on one of those containers in the list, you’ll be able to get more metrics about that container such as memory usage, CPU utilization, and so on:
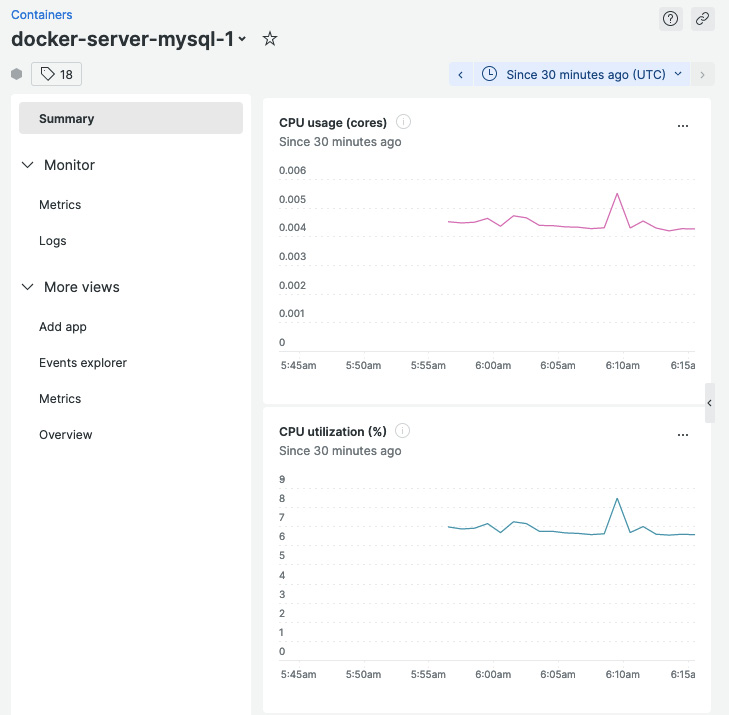
Figure 11.10 – MySQL container metrics
All of these data visualization tools will help you get a better understanding of how heavily your containers and applications are being used and will be able to help you diagnose performance issues when they occur.
Summary
In this chapter, we have gone through the importance of having an APM tool as a part of your setup. We have installed the New Relic APM agent into our AWS EC2 instance and Docker container to start recording performance and usage data. Using an APM tool is entirely optional, but having one will help you and your team address issues more quickly by giving you and your team real production performance data. By having an APM tool, you will be able to understand your application much better, and it will help you to optimize and improve your application.