6
Trends and Characteristics of Unemployment in India
B. A. Prakash. and M. P. Abraham
6.1 Introduction
Unemployment is one of the basic socio-economic problems of India. Generating more gainful employment activities has been one of the important objectives of the economic policies and planning since Independence. To address the rural poverty and unemployment, a number of poverty alleviation and employment generation schemes were implemented since the early 1970s. The major objectives of the structural adjustment reforms implemented since 1991 have been to achieve rapid economic growth and the generation of more gainful employment opportunities. Though the economic reforms have succeeded in generating new employment opportunities in many sectors and regions, unemployment of many categories of labour still remains as a major concern. The high rate of unemployment among the youth, educated, females, agricultural labourers, rural workers, etc. is the current major problem. There have been considerable variations in the rate of unemployment among the states and the union territories. Some of the states have a very high incidence of unemployment. Lack of remunerative jobs, the seasonal nature of the rural and agricultural employment, the slow growth of employment opportunities, the slow pace of structural change of rural areas, the absence of non-agricultural jobs, etc. are cited as the major factors contributing to a high incidence of open unemployment and underemployment of the rural areas. In this context, this chapter examines the trends, characteristics and the changing profile of unemployment in India during the post-reform period. In this chapter, we present the concepts and definitions of unemployment in Section 6.2, the trends in unemployment in Section 6.3, the unemployment situation in India in Section 6.4 and unemployment among the different categories in Section 6.5.
6.2 Definitions of National Sample Survey Organization
We have given the concepts and definitions of National Sample Survey Organization (NSSO) on employment, unemployment, labour force and the three activity statuses, viz., usual status, current weekly status (CWS) and current daily status (CDS), which are discussed in Chapter 5. Here we give the definitions used by the NSSO to define unemployment.
6.2.1 Definitions of Unemployed
The unemployed is usually defined as a person who is not engaged in gainful employment (economic activities), either making tangible efforts to seek work or being available for work if the work is available.
The NSSO has four definitions of unemployed:
- Unemployed based on usual status (principal status) (ps).
- Unemployed based on usual status (principal and subsidiary status) (ps+ss) or (adjusted).
- Unemployed based on current weekly status (cws).
- Unemployed based on current daily status (cds).
6.2.1.1 Usual Status (PS) This indicates the magnitude of the persons unemployed for a relatively longer period during the reference period of 365 days (major part of the year). Persons without gainful employment (economic activity) for the major part of the year and who are seeking or available for work are defined as unemployed according to this definition.
6.2.1.2 Usual Status (PS+SS) or (Adjusted) Among the unemployed belonging to the usual status (principal status) some of them work in a subsidiary capacity (as employed). One can get another estimate on unemployment excluding those employed in a subsidiary capacity during the reference period of 365 days. This is called usually unemployed excluding the subsidiary status workers or usual status (PS+ SS) or usual status adjusted.
6.2.1.3 Current Weekly Status (CWS) According to the CWS approach, a person was considered as unemployed in a week if he/she did not work even for one hour during the week but sought or was available for work at least for one hour during the week.
6.2.1.4 Current Daily Status (CDS) For measuring unemployment according to the CDS approach, seven person-days were assigned for a person for the seven days preceding the date of survey and activity for each of the person-days was considered. A person, who did not work even for one hour in a day, was considered unemployed for the day if he/she sought to or was available for work for four hours or more, and was considered unemployed for half day, if he/she sought or was available for work only for one to four hours. The estimate of person-days unemployed on a day during the survey period is obtained by dividing the person-days unemployed in a week by seven.
6.2.2 Unemployment Rate
It is defined as the number of persons employed per 1000 persons in the labour force, comprising of the employed and the unemployed. Unemployment rate estimated in percentage is usually used as a measure of unemployment.
6.2.3 Definitions Used in the Study
The NSSO has given four definitions of unemployment, viz., usual status (PS), usual status (PS + SS) or adjusted, CWS and CDS. The PS indicates the magnitude of unemployed for a major part of the year and indicates the chronically unemployed. For measuring the unemployment of those engaged in the regular categories of work such as educated, professional categories, etc., this is a suitable indicator. The ps+ss indicates the very acute category of chronically unemployed.
The CWS estimate is based on the weekly status and gives an average picture of unemployment in a short period of seven days during the survey period. It includes both chronic unemployment and also the intermittent unemployment of those categorized as usually employed caused by the seasonal fluctuations in the labour market.
The CDS, an estimate of unemployed based on the daily status concept, gives an average level of unemployment on a day during the survey year. It is the most inclusive rate of unemployment capturing the unemployed days of the chronically unemployed, the unemployed days of the usually employed who became intermittently unemployed during the reference week and the unemployed days of those classified according to the priority criterion of CWS.
Among the definitions of unemployment, CDS is the best definition. In our analysis we have used CDS as well as the other definitions of unemployment. The NSSO data on unemployment is used for the analysis.
6.3 Trends in Unemployment in the Pre- and Post-Reform Period
The major issue in the analysis of unemployment is the changing trends in unemployment in the pre-reform period (1980s) and the post-reform period (1990s). The economic reforms were implemented with an objective to accelerate the process of economic growth and to generate large new employment opportunities. The question is whether the economic reforms have succeeded in absorbing more unemployed labour force by reducing the unemployment rate in the pre- and post-reform period. Based on the NSSO data, an attempt is made to examine this issue. Table 6.1 gives the total number of unemployed and the unemployment rates of different categories of unemployed between 1983 and 2004–05. From the table we may draw the following observations. In the early 1980s, the rate of unemployment was 9.22 per cent for the total unemployed persons in India. For the rural and the urban unemployed, the rate was 8.85 and 10.55 per cent respectively. Nearly, 10 per cent of the females and 9 per cent of males were unemployed in the decade 1980s.
On the other hand, the rate of unemployment was lower in the decade 1990s, as per the NSSO surveys 1993–94 and 1999–2000. For the categories of unemployed such as rural, urban, male and female, the rate of unemployment was lower in the 1990s compared to the decade 1980s. This clearly suggests that the economic growth and development during the post-reform period had resulted in substantial reduction in the unemployed labour force.
TABLE 6.1 Number of Unemployed and Unemployment Rate in India (CDS Basis)
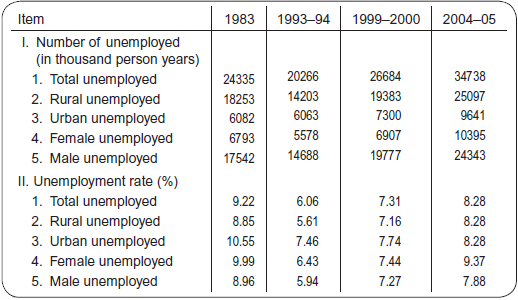
Source: Planning Commission (2008), Eleventh Five Year Plan 2007–2012, Vol. 1.
Let us also examine the trends in rural unemployment using the three definitions of unemployment, viz., PS, CWS and CDS. Compared to the urban areas, the employment opportunities in non-primary sectors are very few in the rural areas. Most of the rural employment is based on the primary activities such as agriculture, livestock, forestry and fishing. Due to lack of suitable employment, a high proportion of the educated labour force also remains as unemployed. Table 6.2 gives the trends in male and female unemployment between 1983 and 2004–05. An analysis of the trend in the male rural unemployment using the PS and CWS definitions shows that the rate of unemployment in the 1990s was lower compared to the decade 1980s. In the case of female rural unemployment, the rate of unemployment was lower in the post-reform period, according to the definitions of unemployment.
TABLE 6.2 Unemployment Rates (per 1000 Persons) According to PS, CWS and CDS in Rural Areas
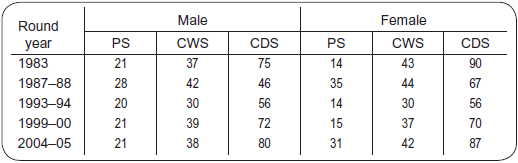
Source: Various NSS Rounds.
TABLE 6.3 Unemployment Rates (per 1000 Persons) According to PS, CWS and CDS in Urban Areas

Source: Various NSS Rounds.
We may also examine the trends in urban unemployment. Compared to the rural areas, the employment structure in the urban areas is characterized by the secondary and the tertiary activities. Table 6.3 shows that the rate of male as well as female urban unemployment was lower in the decade 1990s compared to the 1980s, according to the definitions of unemployment. Thus the NSSO data clearly suggest that the economic reforms have helped to reduce the rate of unemployment in the rural and urban areas in the postreform period.
6.4 Unemployment Situation in India
Here we present the current situation of unemployment in India based on the latest NSSO data. According to the NSSO survey 2004–05, unemployment rate using the CDS definition was 8.2 per cent for the rural areas (Table 6.4). There was not much difference in the unemployment rate among male and female in the rural areas. The NSSO surveys indicate a marginal increase in the rural unemployment between 1999–2000 and 2004–05. This suggests that the rural employment opportunities are not growing at par with the growth in rural labour force. The rural unemployment rate differs widely depending on the definition used. Among the definitions, the CDS will give a better estimate on unemployment.
TABLE 6.4 Unemployment Rate in India (per 1000 Persons)

Source: NSSO (2006), Employment and Unemployment Situation in India, 2004–05, Report No. 515.
Box 6.1: States Having the Highest Rate of Rural Unemployment (CDS), 2004–05

A characteristic of the rural unemployment in India is the wide variation in unemployment among the states and the union territories. The rate of rural unemployment is high in those states which are characterized by the backward rural economies. Lack of generation of the non-primary employment opportunities in the rural areas is a major reason for this.
Appendix 6.1 gives the male, female and total rural unemployment rates of states and union territories for the year 2004–05. Among the states, Kerala has the highest rate of rural unemployment for 2004–05 (Box 6.1). More than one-fourth of the rural labour force in Kerala was unemployed. With regard to the rural unemployment, the states such as Goa, Tripura, Tamil Nadu and West Bengal ranked the positions from two to five respectively. On the other hand, Meghalaya and Mizoram are the states having the lowest rate of rural unemployment.
An analysis of the unemployment in urban areas shows that 8.3 per cent of the urban labour force is unemployed in 2004–05. A notable feature of urban unemployment is the wide difference in the male and female unemployment rates (Table 6.4). While rate of male unemployed was 7.5 per cent, the rate that of female was 11.6 per cent. Higher incidence of female unemployment in the urban areas is a feature of unemployment in India.
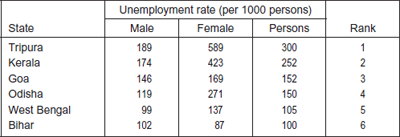
The NSSO survey shows that there has been much difference in the rate of urban unemployment among the states and the union territories. Appendix 6.1 gives the male, female and total urban unemployment rates for 2004–05. Among the states, Tripura has the highest rate of urban unemployment for 2004–05 (Box 6.2). Thirty per cent of the urban labour force in Tripura is unemployed. Kerala has the second highest rate of urban unemployment. The other states having a high rate of urban unemployment are Goa, Odisha, West Bengal and Bihar. The states having a low rate of urban unemployment are Mizoram, Sikkim, Meghalaya, Himachal Pradesh, Gujarat and Arunachal Pradesh.
Box 6.2: States Having the Highest Rate of Urban Unemployment (CDS), 2004–05
6.5 Categories of Unemployed
6.5.1 Youth
A feature of unemployment in the developing countries is the high incidence of youth unemployment. In India, persons aged 15–29 years, who were considered as youth, accounted for 25–29 per cent of the total population. A substantial chunk of them attain some level of education and enter into the labour market while they are in the age group of 15–29 years. In a labour-surplus economy like India, many of them remain unemployed and continue to search or be available for employment. Table 6.5 gives the sex-wise unemployment rate among the youth at the all India level. According to the CDS definition, the percentage of young labour force unemployed was 12.1 per cent in 2004–05 in the rural areas. There was a marginal increase in youth unemployment in the rural areas between 1999–2000 and 2004–05.
More than 15 per cent of the young labour force in the urban areas was unemployed in 2004–05. A feature of unemployment in the urban areas is the high incidence of female unemployment. Appendix 6.2 gives the male, female and the total youth unemployment for the rural and urban areas for 2004–05. A state-wise distribution of the youth unemployment shows that there is a considerable variation in the rate of youth unemployment among states. Among the states, Kerala has an alarming rate of youth unemployment in the rural (42.1 per cent) and urban (41.8 per cent) areas. The other states having a high rate of rural and urban youth unemployment are Tripura, Goa, Odisha, Tamil Nadu, Punjab, Assam and Bihar.
TABLE 6.5 Unemployment Rate (per 1000 Persons in the Labour Force) Among the Youth (15–29 years)

Source: Various NSS Rounds.
6.5.2 Educated Unemployed
We may also examine the unemployment of the educated category of persons. The educated are those persons who have attained an educational level of secondary and above including those who have completed diploma/certificate courses. Normally, one can attain this educational level at the age of 15 years or above. For analysing educated unemployment, the better measure is the usual status (principal status) as the educated are looking for a regular or other types of job for a major part of the year. According to the NSSO survey, 8.5 per cent of the rural educated labour force and 8.2 per cent of the urban educated labour force are unemployed in 2004–05 (Table 6.6). The incidence of unemployment among the female labour force is very high in the rural as well as the urban areas.
In the case of educated unemployed, we can find a considerable difference in the rate of unemployment among the males and females in the rural as well as urban areas (Table 6.7). The unemployment rate of females at all the educational levels, viz., secondary, higher secondary, diploma and graduate and above are very high in the rural and urban areas. Nearly one-third of the educated female labour force having educational qualification such as diploma or certificate and graduate is unemployed in the rural areas. In the urban areas, nearly 20 per cent of this category of the educated female labour force is unemployed. This difference in the unemployment rate may be due to the economic and social factors.
The young educated male labour force can seek employment either in their areas, other regions, cities or other states. They can also migrate to other states and countries for employment. On the other hand, the social customs and practices prevent the easy migration of educated females to other states or foreign countries for employment. The pregnancy, birth of children, looking after children, etc. also inhibit the mobility of the female educated. The high incidence of educated female labour force in the rural and the urban areas is an important socio-economic issue that needs the attention of all concerned.
TABLE 6.6 Unemployment Rate (per 1000 Persons) of Educated Persons of Age 15 Years and Above (Usual Status (PS)), 2004–05
| Rural | Urban | |
|---|---|---|
| Male | 59 |
60 |
| Female | 231 |
194 |
| Persons | 85 |
82 |
Source: NSSO (2006), Employment and Unemployment Situation in India, 2004–05, Report No. 515.
TABLE 6.7 Unemployment Rate (per 1000 Persons) for the Persons of Age 15 Years and Above with Different Educational Attainments—Usual Status (PS)

Source: Various NSS Rounds.
The NSSO survey shows that there is a wide variation in the educated unemployment in the states in India. Tripura has the highest rate of rural educated unemployment in the country. Forty seven per cent of the educated labour force in Tripura is unemployed (Box 6.3). The states, namely, Kerala, Odisha, Assam ranked second, third and fourth positions with respect to high rates of rural educated unemployment in India. In all the states, the incidence of unemployment of female educated was very high compared to males.
A state-wise analysis of the educated unemployment in the urban areas shows that Tripura ranks first with respect to a high rate of unemployment (Box 6.4). Kerala, Odisha and Goa ranked second, third and fourth positions with respect to a higher rate of educated unemployment. As in the case of rural areas, the rate of urban unemployment among the educated female labour force was very high compared to the males.
Box 6.3: States Having the Highest Rate of Rural Educated Unemployment (Age 15 Years and Above) (Usual Status (Ps)), 2004–05

Box 6.4: States Having the Highest Rate of Urban Educated Unemployment (Age 15 Years and Above) (Usual Status (Ps)), 2004–05

6.5.3 Rural Agricultural Households
The available data suggest that the incidence of unemployment among the rural workers and the rural households is fairly high. The Planning Commission estimates that the proportion of poor among workers in the rural areas was 20.3 per cent in 2004–05 (Planning Commission (2008), Eleventh Five Year Plan 2007–12, Vol.1). It is found that the incidence of unemployment among the rural households was also high. Table 6.8 gives the rate of unemployment among the rural households between 1983 and 2004–05. A disturbing development was the steady increase in the unemployment rates in the rural agricultural households. It is estimated that the unemployment rate of the rural agricultural household was 15.26 per cent in 2004–05. We can establish a relationship between the high incidence of unemployment and the poverty of the rural households. In this context, the policy option is to reduce rural poverty through the generation of more employment in the non-agricultural activities.
TABLE 6.8 Unemployment Rates of Rural Agricultural Households (CDS Basis)
| Year | Unemployment rates (%) |
|---|---|
| 1983 | 7.73 |
| 1993–94 | 9.50 |
| 1999–2000 | 12.29 |
| 2004–05 | 15.26 |
Source: Planning Commission (2008), Eleventh Five Year Plan 2007–12, Vol. 1.
6.6 Conclusion
The above analysis may be concluded with the following observations. An important issue in the analysis of unemployment is whether the economic reforms have resulted in the reduction of the unemployment rates. The trends in unemployment show that the unemployment rate was lower in the post-reform period compared to the pre-reform period. This clearly suggests that the economic reforms have resulted in a substantial reduction in the unemployed labour force. However, the recent trends in unemployment indicate a marginal increase in the unemployment rate in the rural and the urban areas. The high incidence of female unemployment in the urban areas, the youth unemployment and the educated unemployment is the notable characteristic of unemployment in India. Some of the disturbing developments in the unemployment scene are a very high incidence of educated female unemployment and a high rate of unemployment in the rural agriculture households. The distribution of unemployed among the states and the union territories shows that there is a considerable variation in the rate of unemployment. In the case of the different categories of unemployed such as rural, urban, male, female, educated, youth, etc., we can notice wide variations in the rate of unemployment among the states and the union territories.
References
Government of India. (2002). Report of the ‘Special group on targetting ten million employment opportunities per year’, Planning Commission, New Delhi.
Ghosh, J. (2006). The jobless young, December 8. http://www.macroscan.org/the/employment/dec06/emp081206JoblessYoung.htm
National Sample Survey Organization (NSSO). (1997). Report No. 409, Employment and unemployment situation in India, 1993–94, Pts I–II. NSSO, Ministry of Statistics and Programme Implementation, New Delhi.
NSSO. (2001). Report No. 458, Employment and unemployment situation in India, 1999–2000, Pts I–II. NSSO, Ministry of Statistics and Programme Implementation, New Delhi.
NSSO. (2006). Report No. 515, Employment and unemployment situation in India, 2004–05, Pts I–II. NSSO, Ministry of Statistics and Programme Implementation, New Delhi.
Planning Commission. (2008). Eleventh Five Year Plan 2007–2012, Inclusive Growth, Vol. 1. New Delhi: Oxford University Press.
Sundaram K. (2001). ‘Employment—unemployment situation in the nineties: Some results from NSS 55th round survey’, Economic and Political Weekly, March 17.
APPENDIX 6.1 Unemployment Rates (per 1000 Persons) According to Current Daily Status for Each State and Union Territory (2004–05)
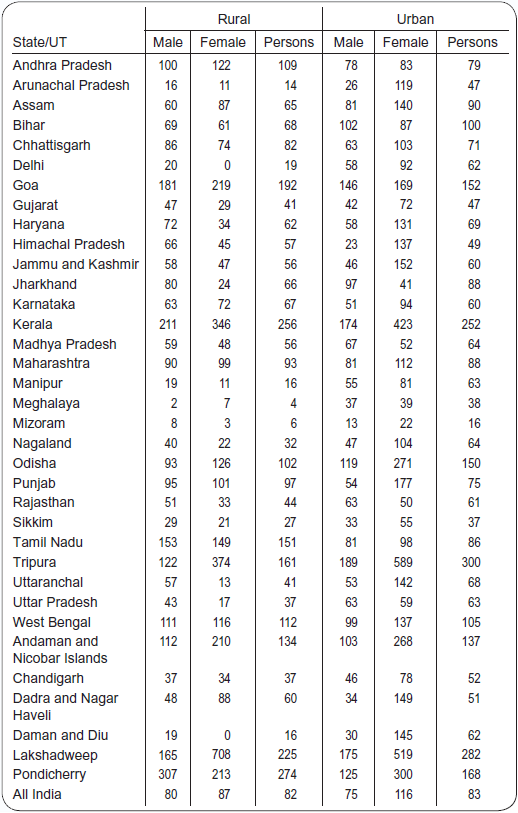
Source: NSSO (2006), Report No. 515.
APPENDIX 6.2 Unemployment Rate (per 1000 Persons) Among the Youth (15–29 years) According to Current Daily Status for Each State and Union Territory (2004–05)

Source: NSSO (2006), Report No. 515.