9
Finances of the Central Government (1991–2010)
M. R. Anand*
Fiscal reforms have been an integral part of the economic reforms launched in India in the early 1990s. These reforms have impinged on all aspects of the fiscal policy and altered the pattern of revenues and expenditure of the government. The enactment of the Fiscal Responsibility and Budget Management Act (FRBMA) in 2003 was an important milestone in the area of fiscal reforms in India, as it provided a statutory basis for fiscal management.
This chapter aims at providing an expository account of the fiscal trends in India in the light of the policy changes since 1991. The scope of discussion is limited to analysing trends in the finances of the union government.1 Further, the macroeconomic implications of the fiscal policy and its link to the monetary policy are also not discussed.
The chapter is divided into five sections. Section 9.1 provides a brief overview of the structure of the finances of the union government, followed by an analysis of the trends in resources (particularly, tax revenues) in Section 9.2. The reforms were also aimed at redirecting public expenditure and improving its efficiency. We therefore analyse the expenditure side of the government finances in Section 9.3. Section 9.4 focuses on the movement of key fiscal indicators, like the fiscal and revenue deficit and public debt. This discussion is in the context of the enactment of the FRBMA in 2003.
The global financial crisis that hit the world in late 2008 severely impacted the fiscal position of most of the countries across the globe. Section 9.5 briefly describes the fiscal response to the global financial crisis and its impact on the fiscal position of the union government. Observations follow in the end.
9.1 The Structure of Government Finances
The pattern of growth and development of the Indian economy after Independence was largely influenced by the planning process. Within the framework of a mixed economy, the responsibility of providing resources for public investment rested heavily on the fiscal policy, though the monetary and credit policies were also used alongside to implement the strategies envisaged in the successive plans (Bagchi and Nayak, 1994: 25). The main tasks set out in the First Five Year Plan for the fiscal policy were to help finance the investment by increasing savings, especially through public savings, to bring about a reduction in inequality of income and wealth, and to influence the volume and direction of economic activity.2 Many of these objectives continued to be restated in the successive plans, with the tax and expenditure policies employed for achieving these objectives.
While it is debatable whether the fiscal policy in India succeeded in fulfilling the objectives such as increasing public savings, providing the much needed resources for investment and in reducing inequality, there is little doubt that fiscal imbalance reached crisis proportions by the end of 1980s. The high marginal tax rates did not yield the necessary revenue, and the growth in the tax receipts persistently lagged behind expenditure. The second half of the 1980s came to be marked by high fiscal deficits and large revenue deficits, and a significant enlargement in the debt-servicing obligations. The fiscal deterioration raised the question of sustainability of such a fiscal stance and the need for a fiscal correction.
The developments on the economic front during the second half of the 1980s that culminated into a macro-economic crisis (in 1991) are well documented (Government of India, 1992, 1993). As far as the fiscal side is concerned, the extant view was that the high level of fiscal deficit had reduced the effectiveness of monetary policy, fuelled inflation due to its expansionary impact on the money supply and had fed into a large current account deficit in the balance of payments (Government of India, 1993).3 To quote ‘fiscal profligacy was seen to have caused the balance of payments crisis in 1991, and a reduction in the fiscal deficit was therefore an urgent priority at the start of the reforms’. (Ahluwalia, 2002) The fiscal policy that followed focussed on reducing the fiscal deficit through reforms that spanned both the revenue and the expenditure side.
9.1.1 Structure of Government Finances
Table 9.1 presents the structure of centre’s finances (i.e., receipts and expenditure) of the central government in relation to GDP from the 1980s to 2010.
The non-debt receipts of the centre primarily comprise of tax revenues and non-tax revenues. Tax revenues of the centre are shared with the state governments based on the recommendations of successive finance commissions. The centre retains the non-tax revenues and the non-debt capital receipts. Non-tax revenue mainly consists of interest receipts and dividends. Non-debt capital receipts comprise of the recovery of loans from the state governments and proceeds from the sale of assets.4 The expenditure side of the government has been conventionally divided into revenue and capital expenditure, in order to distinguish expenditure that goes into consumption expenditure of the government, from asset formation. From the planning perspective, the budgetary process in India also categorizes the government expenditure into plan and non-plan expenditures.5
TABLE 9.1 Changing Structure of Finances—Centre (Figures as Percentage of GDP at Market Prices)
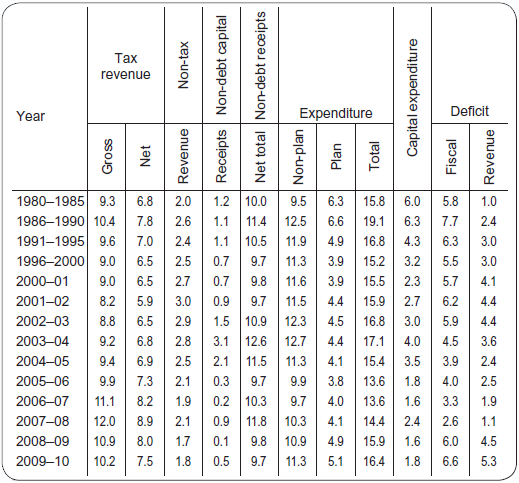
Source: Computed from Union Budget, Relevant Issues.
It is seen from Table 9.1 that non-debt receipts of the central government improved from 10 per cent of the GDP in the first half of the 1980s to 11.4 per cent in the second half of the decade. During the same period, the total expenditure shot up from 15 per cent to over 19.1 per cent of the GDP. The increase in expenditure was largely due to a rise in the nonplan expenditure, while the increase in the plan as well as the capital expenditure was moderate. The sharp increase in expenditure during the second half of the 1980s (particularly, under non-plan) as compared to the modest increase in non-debt receipts translated into a high fiscal deficit of 7.7 per cent of the GDP during the second half of the 1980s.
In contrast to the second half of the 1980s, the 1990s witnessed a fall in the ratio of non-debt receipts to GDP largely due to a slow growth in the gross tax revenue of the centre. The tax—GDP ratio declined from 10.4 per cent in the second half of the 1980s to about 9 per cent in the second half of the 1990s. The slowdown in the tax revenues could not be compensated by the small rise in the non-tax revenues.
The fiscal policy that followed the balance of payment crisis of 1991 was essentially focused on compressing the government expenditure. The expenditure to GDP ratio declined from 19.1 per cent in the second half of the 1980s to 15.2 per cent in the second half of the 1990s. The expenditure compression during this period was largely under plan expenditure which fell by as much as 2.7 per cent of GDP as compared to the modest decline of 1.2 per cent of GDP under the non-plan expenditure. As a matter of fact, the non-plan expenditure to GDP ratio that had declined to 10.7 per cent in 2006–07, increased once again to 11.3 per cent in 2007–08 and 12.1 per cent of GDP in 2008–09, largely on account of a rise in the expenditure arising from the recommendations of the Fifth Pay Commission. A decline in the overall government expenditure to the GDP ratio was also accompanied by a large decline in the share of capital expenditure. Thus the overall reduction in the fiscal deficit to GDP ratio, to below 6 per cent during the 1990s, was largely on account of a compression in the plan expenditure (including capital expenditure).
The period after 2001–02 was marked by an improvement in the revenue side, with the gross tax to GDP ratio increasing from 8.2 per cent to 12 per cent in 2007–08. The overall expenditure to GDP ratio did not show any marked decline. On the contrary it increased to 17.1 per cent in 2003–04. The expenditure to GDP ratio declined thereafter, for the next three years till 2007–08.
It can therefore be said that, while the fiscal performance during the 1990s was largely marked by the expenditure compression, especially the plan expenditure, after 2001–02 the government finances were largely aided by the buoyant tax revenues. In 2004–05, the fiscal reforms process was cast into a medium-term framework, backed by an overarching statute with enactment of the FRBMA, 2003. During the period from 1991 to 2007–08, there was a marked decline in the fiscal deficit to GDP ratio and the revenue deficit to GDP ratio to 2.6 and 1.1 per cent, respectively, by 2007–08.
In 2008–09 there was a sharp deterioration in the tax-GDP ratio, accompanied by a ballooning in the expenditure that in turn led to a deterioration of the fiscal deficit and the revenue deficit ratios to 6.0 and 4.5 per cent, respectively. The deterioration in the fiscal position in 2008–09 was largely on account of the measures taken to contain the adverse fallout of the global financial crisis.
Thus the performance on the fiscal front during the reform period, while being shaped by the policy changes, was also conditioned by the growth of the economy and the pattern of resource mobilization and government expenditure. The following two sections analyse the trends in the resources and expenditure, respectively, against the backdrop of changes in the respective policies and then followed by a discussion on the FRBMA.
9.2 Trends in Revenue of the Central Government
The resources of the government (other than borrowings) are collectively termed as nondebt receipts. The composition of the non-debt receipts in terms of the share of tax, nontax and non-debt capital receipts6 is given in Table 9.2.
Table 9.2 shows that the tax-revenues accounted for over 74 per cent of the non-debt receipts through the 1980s, which came down marginally during the 1990s—a trend that continued till 2004–05. In contrast, during the second half of the 1990s, there was a significant rise in the share (and growth) of non-tax revenues, which continued till 2001–02. There was also a brief spurt in the share of the non-debt capital receipts during 2002–03 to 2004–05.
TABLE 9.2 Share of Different Components of Non-debt Receipts

Source: Computed from Union Receipt Budget, Several Issues.
RE: Revised Estimate.
Before analysing the factors that led to these compositional changes, an understanding of the main features of the tax system, and its structure prevailing prior to the reforms, may be useful in the context of this study.7
9.2.1 Division of Powers and the Objectives of Taxation
The division of the powers of taxation in India between the union and the states is embodied in the constitution that assigns the powers to levy and collect personal and corporate income tax, wealth tax, customs and excise duties to the union, and the power to levy and collect taxes on land, agricultural income, retail sales and excise on alcohol to the states. Sharing of revenues between the centre and the states is based on the recommendations of the Finance Commissions, appointed every five years.
While the primary objective of taxation is to raise the revenue for public expenditure, in India there were multiplicities of objectives ranging from reducing inequalities of income and wealth, to providing incentives for the investment of protecting domestic industries from the external competition. These objectives played an important role in shaping up the direct and indirect tax system that evolved within a federal framework of division of taxation powers between the centre and the states.
9.2.2 Composition of Tax Revenues
It is a well known, stylized fact that countries in the early stages of development tend to rely more on indirect taxes (Hinrichs, 1966). In the case of India, this dependence was much higher than in other countries at similar levels of development (Burges et al., 1993). The transition of the tax structure, associated with economic development from the indirect to direct taxes, was not witnessed in the case of India at least till the end of the 1980s. The predominance of the indirect tax was ascribed to a variety of factors, including a high share of the unorganized sector, poor literacy levels, absence of standard accounting practices and inadequate tax collection infrastructure (Bagchi, 1997).
Figure 9.1: Composition of Gross Tax Revenues (1980s)

In the 1980s, the indirect taxes (union excise and custom duties) on an average constituted over 77 per cent of the gross tax revenue of the central government, while the direct taxes (i.e., income tax, corporate tax and others) accounted for only 23 per cent (Figure 9.1). The customs duty accounted for 31 per cent of the gross tax revenue of the central government in the 1980s (on an average). Since the taxes on traded commodities are (relatively) convenient to handle, the government tended to routinely increase the tariff rates to collect more revenues (Baghchi, 1997). The union government excise duties accounted for as much as 46 per cent in the 1980s.
The dependence by the union government on the indirect taxes, however, came at a high price. The indirect taxes, excise and customs duties in India were very high by international standards, with adverse implications for the competitiveness of the Indian industry. The consequence was that India had one of the highest levels of customs tariff, with the maximum rate being as much as 300 per cent by the 1980s. There was also a wide dispersal of rates across the commodities with numerous exemptions. The excise duties varied widely across the commodities. The general approach of the government was to bring more and more commodities under the excise duty. At the same time exemptions were granted on several commodities, particularly those meant for common consumption and the products manufactured by small-scale industries. The large number of rates, exemptions and ambiguities in the interpretation of law made implementation as well as compliance difficult, and created conditions of corruption and litigation. The adverse effects of a plethora of taxes on the relative prices and efficiency in the production and choice of inputs were not considered (Purohit, 1994). The indirect tax structure however left out a significant part of the economy, namely, the services sector.
Under direct taxes, the income tax and the corporate tax were the main sources of taxes with taxes on the agriculture sector outside the purview of the centre.8 The income tax in India had a very high degree of progressivity during the 1960s and the 1970s. This was perceived to have an adverse effect on the efficiency. To mitigate this problem, a variety of concessions and exemptions also came to be allowed (through the 1970s and 1980s) with varied objectives such as encouraging savings, promoting specific economic activities, stimulating regional development and so on. In the process, much of the rigor of progressivity of income tax got weakened, thereby eroding the already narrow tax base and creating incredible complications (Bagchi and Nayak, 1994: 51). The ad-hoc manner, in which the tax structure was frequently altered, made it difficult for the economic agents to keep a track of the changes thereby adding to the uncertainty.9
The fact that income tax accounted for a relatively small share in the tax revenues in India (less than one per cent of the GDP in the 1980s) was attributed to its narrow tax base. It was also argued that the low share and the low growth of the direct taxes were not merely due to the exemptions and concessions, but also on account of the widespread tax evasion. Acharya (1986) estimated that tax evasion accounted for 12 per cent of the GDP in the mid-1970s and 15 per cent in 1980. Das-Gupta and Mookerjee (1997) pointed out that rampant tax evasion was due to poor enforcement by the tax authorities, inadequate attention towards the design of tax administration, insufficient effort towards collecting the information on the tax base and the high cost of compliance.
Shome (1988) found the tax system to be lacking the design that would automatically yield higher tax revenue with a growth in the gross domestic product. According to him, the improvement in tax elasticity called for an expansion of coverage, regular adjustment in the rates of inflation, a reasonable progress in the system and the removal of various exemptions in the income tax.
The corporate taxes also had several anomalies. Apart from the high marginal rates, an issue that was raised frequently was that of the difference between tax rates on domestic companies (50 per cent) as compared to foreign companies that suffered a higher rate (65 per cent) which discouraged investment by the foreign companies (TRC, 1992: 169). Another problem was that profits of the companies were taxed and the dividends paid out were also taxed in the hands of the shareholder, thereby leading to double taxation.
Musgrave and Musgrave (1976) had observed that while the objective of raising the revenue is central to any system of taxation, a good tax system needs to conform to the principles of equity and minimize the interference with economic decisions, while being able to correct for inefficiencies. At the same time, administration of the tax system should be non-arbitrary with a low compliance cost.10 The empirical studies on India showed that successive change in the tax rates both direct and indirect, the multiplicity of the rates and the poor quality of administration had rendered the tax system not only inefficient but also ineffective in achieving the objectives laid out for it. Despite the fact that tax revenues grew at over 17 per cent during the latter half of the 1980s, it was not adequate to keep pace with the growing expenditure of the government. The tax system, apart from being unduly complex, could not deliver in terms of its basic function of providing the much-needed growth in the revenue Table 9.3. It was clear that the shortcomings in the tax system needed to be addressed.
TABLE 9.3 Shortcomings of the Tax System in 1980s
Direct taxes |
||
| Income tax | High degree of progressiveness during the 1960s and the 1970s | Adverse effect on efficiency |
| Large number of exemptions/concessions | Eroded the already narrow tax base | |
| Large number of rates and ad-hoc and frequent changes in the tax rates | Made it difficult for the economic agents to keep a track adding to uncertainty | |
| Poor enforcement and high compliance cost | Tax evasion | |
| Corporate taxes | Discrimination between different types of companies | Discouraged investment and encouraged devious routes |
| Double taxation of the dividends | Discouraged investment in equity | |
Indirect taxes |
||
| Customs and Central Excise | High rates of excise/customs duties | Adverse effect on industrial competitiveness |
| Wide dispersal of rates across the commodities | Ambiguities leading to litigation and poor compliance and corruption | |
| Numerous exemptions | Vested interests/lobbying for tax exemption | |
| VAT | Absence of VAT | Cascading of taxes and distortion of prices |
| Services | Services sector outside the tax net | Major growth sector outside the tax base |
9.2.3 Reforms of the Tax system
The efforts at reforming the taxation system and the tax structure prior to the economic reforms of the 1990s, on the basis of the recommendations of successive expert committees, have been documented by scholars (Thimmaiah, 2002).11 Notable among these efforts was the announcement of the Long-term Fiscal Policy in 1985, which recognized that the deteriorating fiscal position was a major challenge that needed taking a long-term view. The policy provided a direction for changing the taxation system, for increasing its elasticity and for securing better tax compliance. The non-integrated and complex nature of the indirect tax structure, and the problem of multiplicity of levies and its cascading effects, also received attention in the mid-1980s. A technical group was appointed by the government in 1985, to review and rationalize the central excise tariff, which led to the introduction of the Modified System of Value-Added Tax (MODVAT) in 1986. The reforms in the customs duty focused on an increased reliance on the tariff system, rather than on quantitative restrictions to regulate imports and a general reduction in the tariffs. A harmonized system (HS) of the classification of goods was also introduced.
Tax reforms received a further boost in the early 1990s, under the structural adjustment programme initiated in the wake of the economic crisis of 1991. The reforms in the tax structure, both direct and indirect, have since been an ongoing process.12 In 1991, the Government of India appointed the Tax Reforms Committee (TRC), under the chairmanship of Prof Raja Chelliah, to lay out an agenda for reforming the tax system and the tax structure. The basic approach adopted in the reports of the TRC (1991, 1992 and 1993) was different from the earlier ones. The emphasis was on adopting a small number of simple and broad-based taxes, with moderate and a limited number of rates, and very few exemptions and deductions. Secondly, the measures suggested were comprehensive as they covered both the direct and the indirect taxes. Thirdly, the recommendations included measures for improving the tax administration. In brief, the recommendations of the TRC emphasized the following:
- Reforming the personal taxation system by reducing the marginal tax rates.
- Reduction in the corporate tax rates.
- Reducing the cost of imported inputs by lowering the customs duties.
- Reduction in the number of Customs tariff rates and its rationalization.
- Simplifying the excise duties and its integration with a Value-Added Tax (VAT) system.
- Bringing the services sector in the tax net within a VAT system.
- Broadening of the tax base.
- Building a tax information and computerization.
- Improving the quality of tax administration.
Subsequently, the government appointed two task forces—the task force on the direct taxes and the task force on the indirect taxes, both under the chairmanship of Dr Vijay Kelkar. The reports of these two task forces provided a further direction to the tax reform process after 2003–04. Tables 9.4 and 9.5 summarize some of the important changes in the direct and the indirect taxes, respectively. The personal and corporate income tax rates were progressively brought down and a large number of rates on the personal income were simplified to just three in 1992–1993, with a reduction in the rates at the upper end. In 1997–98 the three slab rates were further modified to 10–20-30 per cent. Although in the subsequent years the need for additional revenue led to the imposition of a surcharge and a 2 per cent primary education cess on all taxes, the tax rates have remained stable with the modifications made mainly to the level of income at which the tax rates are applicable.13 Another important reform has been the expansion of the Tax Deduction at Source (TDS), which has had the effect of reaching the ‘hard to tax’ categories.
In the case of corporate taxes, there was a reduction in the tax rates in a phased manner for domestic companies from 50 per cent (in 1990) to 30 per cent by 2005–06. The 1994 budget removed the difference in the corporate tax rates applicable to the widely held and the closely held domestic companies. The wide difference in the corporate tax rate on the foreign companies earning income in India vis-à-vis the Indian companies was narrowed down. Though the reduction in the corporate tax was also followed up with efforts to mop out taxes from the ‘zero tax’ companies, through the introduction of Minimum Alternate Tax (MAT) in 1996–97, in general, the tax regime for the companies has become more moderate.
TABLE 9.4 Major Reforms in Direct Taxes After 1991

The administration of direct taxes came in for a major change with the budget of 2004–05, when it was made mandatory to report high value transaction measures taken for strengthening the information base on large taxpayers. Making the Permanent Account Number (PAN) for income tax payers mandatory, the outsourcing of related tasks to professional agencies and creating a Tax Information Network (TIN) through the National Securities Depository Limited. (NSDL) were the major initiatives that have contributed to improving the tax compliance.
In the area of commodity taxation, progress was made to reduce the distortionary impact of including inputs in the tax base. The measures relating to excise duties included a gradual unification of the rates, and a greater reliance on the account-based administration. In 1999–2000, almost 11 tax rates were merged into three, with a handful of ‘luxury’ items, subject to two non-VATable additional rates (6 and 16%). These were further merged into a single rate in 2000–01 to be called a central VAT (CenVAT), along with the three special additional excises (8, 16 and 24%) for a few commodities.14 The customs duties were scaled back along with the relaxation of quantitative restrictions on imports. The general reduction in the tariffs constituted a major change in the foreign trade regime in India during the 1990s.
TABLE 9.5 Major Reforms in Indirect Tax After 1991
| 1 | Customs duty | Progressive reduction in the rate of customs duty on non-agricultural products, from an average level of 128 per cent in the beginning of 1990s to 22.8 per cent in 2003–04.15 |
| 2 | Central excise | Reduction of 11 major ad-valorem excise duties to 3, viz., central rate of 16 per cent, merit rate of 8 per cent and demerit rate of 24 per cent in the year 1999–2000, while retaining the special excise duties on the specified goods. |
| 3 | Service tax | The introduction of tax on the services at the central level began in 1994–1995 with three services, viz., non-life insurance, stock brokerage and the telecommunications. The list was expanded in the succeeding years. Taxed at 7%, the rate was increased to 10% in 2002–03. |
A feature of the system of tax assignment in India was that the taxes on services were not specifically assigned either to the centre or to the states.16 This resulted in leaving out the consumption of services from the ambit of taxation; thereby, excluding an income elastic segment of the tax base from being taxed. The tax on services at the central level began to be levied in 1994–95 with three services, viz., non-life insurance, stock brokerage and telecommunications. The list has been expanded in the succeeding years to include over 80 services.
9.2.4 Trends in Tax Revenues
Most of the countries that undertook the tax reforms experienced a significant increase in the tax—GDP ratio (Shome, 1997). In the case of India, the impact of the tax reforms on the gross tax revenues did not show up for over a decade starting from 1991. On the contrary, the gross tax—GDP ratio of the central government, instead declined from an average of 10.4 per cent in the second half of the 1980s to 9.6 per cent (on an average) during the first half of the 1990s and further to 9.0 per cent in the second half of the 1990s (Figure 9.2).
After reaching a low of 8.2 per cent of the GDP in 2001–02, the ratio continued to improve till 2007–08. Apart from the lagged effect of the reforms, the improvement in the tax revenues was also aided by the strong economic growth from 2002–03 to 2007–08. However, following the sharp downturn in the economic growth in 2008–09 due to the impact of the global financial crisis, the tax revenues growth showed a sharp downturn which was duly reflected in a drop in the tax-GDP ratio. Nevertheless, it can be said that while the first decade of the reforms (i.e., 1990s) was marked by a low tax-GDP ratio, the second decade was marked by an improved performance in terms of the tax receipts.
Table 9.6 provides the tax-GDP ratios for different taxes, which shows that through the two decades of reforms (i.e., from 1991) the change in the tax-GDP ratios was not uniform across the different taxes. The ratio of indirect tax collections to GDP (i.e., customs and excise) declined from around 7.3 per cent in the second half of the 1980s to 7.1 per cent in the first half of the 1990s and further to 5.9 per cent in the second half of the 1990s.
Figure 9.2: Centre’s Tax GDP Ratio

TABLE 9.6 Tax-GDP Ratios—Centre
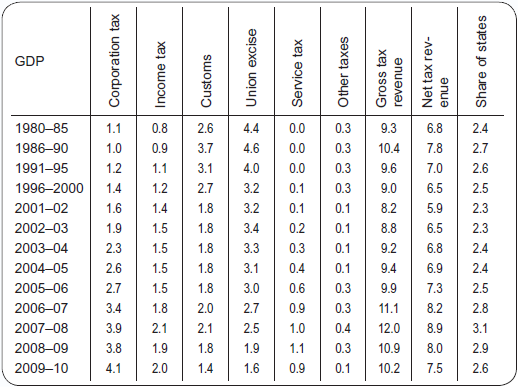
Source: Computed from Receipt Budget, Government of India (Several Issues) and National Account Statistics.
The stagnation in the growth of indirect taxes was mainly due to the rate cuts in the excise and the customs. The reforms of the indirect tax system during the 1990s were mainly aimed at rationalizing the tax rates and bringing down the number of rates, not necessarily for increasing the revenue productivity. The reduction in tax rates was not even compensated by an increase in the tax base. During the second half of the 1990s, the growth in imports also slowed down and the net impact was of a fall in the customs duty collections. The customs duty to GDP ratio came down significantly to about 3.1 per cent in the first half of the 1990s and further down to 2.1 per cent in 2007–08.
In the case of the excise duty collections, the scaling back of excise duties on the end products had another effect. With progressive extension of MODVAT and CENVAT, the outgo on credit extended to the inputs under this system increased, as duties on end products were brought down. Another important reason for reduced revenue collection, from both the customs and the excise duties, was that several concessions and exemptions continued to be in place. The services sector remained outside the tax net during the first half of the 1990s. As more and more services came to be included under the service tax, by 2007–08 it came to account for about one per cent of the GDP.
In contrast to the indirect taxes, the tax—GDP ratio for the direct taxes (income tax and corporate tax) increased from 2.0 per cent, in the second half of the 1980s, to 2.3 per cent in the first half of the 1990s and to 2.6 per cent by the second half of 1990s. The trend continued thereafter, and by 2009–10, the tax—GDP ratio for direct taxes was 6.1 per cent. The increase in direct tax collections, despite a significant cut in the marginal tax rates, may be attributed to a combination of factors. Apart from the overall economic growth, the adoption of economic criteria for the identification of taxpayers helped to broaden the tax base, and the rationalization and simplification, both in the personal tax induced and the corporate tax induced better compliance.
TABLE 9.7 Percentage Share of Different Taxes in Gross Tax Revenues

Source: Computed from Receipt Budget.
The differential growth in the direct and the indirect taxes over the two decades from 1991 to 2010 changed the composition of the tax revenues (Table 9.7). The share of the corporate taxes reached 32.5 per cent by 2007–08, from only 9.6 per cent in the latter half of the 1980s. The share of income tax increased to 17.3 per cent in 2007–08, from 9 per cent in the second half of the 1980s. As already mentioned, the share of both the customs and the excise duties declined during this period, while the service tax improved its share from just about 1 per cent in the second half of the 1990s to over 10 per cent in 2007–08. The increase in the share of service tax was on account of an increase in both the coverage as well as the tax rates.
9.2.5 Trends in Non-Tax Revenue
The non-tax revenue of the centre mainly comprises of the interest receipts, dividends and profits from the public sector undertakings including banks and receipts from the economic services. The non-tax revenues as a percentage of the GDP declined from about 3 per cent of the GDP in 2001–02 to 1.8 per cent in 2008–09 (Table 9.1). This decline has mainly been on account of the lower interest receipts, which has been its largest component.
The trends in the components of the non-tax revenue given in Table 9.8 reveal some interesting changes. The share of the interest receipts (on loans to state governments, PSUs and others) increased during the first half of the 1990s, on account of a rise in the interest rates. However, after 2004–05, the share of this component has declined to 20.6 per cent in 2007–08. The decline has been mainly on account of the lower interest receipts from the states, due to the termination of the practice of on-lending by the centre to the states and the interest relief granted to the states following the implementation of the debt consolidation and relief facility, as recommended by the Twelfth Finance Commission.17
TABLE 9.8 Percentage Composition of Non-tax Revenue of the Central Government

Source: Union Government Budgets.
There was a noticeable change in the share of the dividend and profits which increased from 6 per cent in the later half of the 1980s to 9.6 per cent during the first half of 1990s. In the second half of the 1990s, the share of the dividends and profits further increased to 14 per cent of the non-tax revenues, and this increase in the share continued further to reach 33.7 per cent by 2007–08. During the second half of the 1990s, the rise was mainly on account of an increased payout received from the central public sector enterprises. Subsequently, the transfers from the Reserve Bank of India (RBI) have also been an important component of the dividend and profits. Transfer from the RBI grew on account of the earnings from the deployment of the foreign currency assets, conversion of the Treasury Bills into marketable securities and discontinuation of the practice of crediting large sums to the National Industrial Credit Long Term Operations Fund. From 2007–08 onwards, this item has also come to include proceeds from the sale of spectrum, and the exploitation of the offshore oil and gas reserves.
The period of reforms from 1991 witnessed a significant change in the composition of its tax and non-tax revenues. The increase in the share of direct taxes (particularly corporate taxes), in the gross tax revenue of the centre, was particularly significant. A growth in the indirect taxes, however, remained sluggish through the 1990s and continued to be so thereafter. The introduction of tax on services has been yet another major change in the tax system. The reforms have also brought in some improvement in the quality of tax administration, though more needs to be done.
The tax reforms have also resulted in the introduction of VAT at the state level, as a consequence of which most of the sates moved to implementing the VAT in lieu of the state sales tax. As of 2009–10, the efforts are on to move to an integrated Goods and Services Tax (GST) and to introduce a new direct tax code. However a discussion of these reforms is beyond the scope of this chapter. In short, the observation of Rao (2005) is that the Indian tax system has come a long way from the narrow-based, complicated and confiscatory to the one that is far more efficient, and appears to be broadly correct, even though the reforms of the tax system remain an ongoing and unfinished agenda.
9.3 Changing Composition of Public Expenditure
The public expenditure can be viewed from two (interrelated) perspectives—its magnitude and its composition. At the outset, we mentioned that the immediate response to the economic crisis in 1991 was of expenditure compression. On the contrary, the fiscal response to contain the adverse impact of the global financial crisis (in 2008) was exactly the opposite, that is, of expansion. In both these extreme situations, the fact that public expenditure (in terms of magnitude) was a significant component of the aggregate demand assumed relevance for a macro-economic perspective. Apart from its magnitude, the composition of government expenditure is also important, since it directly impacts the provision of certain types of goods and services in the economy, and also as a consequence, the composition of demand in terms of consumption and investment.
The economic theory suggests that there are three main reasons that call for government intervention. These are market failure, (including missing markets), the distributional equity, and the situations characterized by externalities. The case for government provisioning of pure ‘public goods’ arises from the ‘non-rival’ and the ‘non-excludable’ characteristics of these goods (and the consequent inability to charge for them). The private sector lacks the incentive to supply them. National defence, public health, pollution control and, to a certain extent, roads are typical examples. Public expenditure on the infrastructure has positive externalities, and can facilitate private investment (also termed as the crowding in effect).
The results of empirical studies on the relationship between public investment and private investment and whether public investment ‘crowds out’ or ‘crowds in’ private investment have not been conclusive. However, there is a broad consensus that the composition of public expenditure plays an important role in facilitating or discouraging private expenditure (particularly private investment).
9.3.1 Composition of Expenditure
In the context of the planning process, the government expenditure continues to be categorized as ‘plan’ and ‘non-plan’. Both the non-plan and the plan expenditures comprise of the revenue and the capital expenditure. The data presented in Table 9.9 reveals the following trends. First, the share of the total plan expenditure (Column 10), which was around 27 per cent in 1990–91, increased in the first half of the 1990s but witnessed a decline towards the later part of the decade, after which there was a reprieve, and its share reached 28.8 per cent in 2007–08 and increased further in 2008–09. Second, there has been a general decline in the share of the capital expenditure and an increase in the share of the revenue expenditure, both in respect of the plan expenditure (Column 9) and non-plan expenditure (Column 12). Third, there was a sharp drop in the share of central assistance for the plan of the states under capital expenditure after 2004–05.
9.3.2 Change in the Composition of Plan Expenditure
The increase in the share of the revenue expenditure in the plan expenditure of the centre (Column 2) needs to be seen in the light of the composition of centre’s expenditure under ‘the plan’ over the years.
A break-up of the plan expenditure by the development heads given in Table 9.10 shows that in comparison to the 1980s, the composition of plan expenditure shifted away from the industrial and mineral sectors through the 1990s (and beyond). There has also been a decline in the share of plan expenditure of the centre in the agriculture sector. In contrast to the foregoing, there has been an increase in the share of the expenditure going to social sectors like rural development (particularly rural employment programmes), education, health, sanitation and social welfare. The share of the direct government expenditure, through budgetary sources under the plan for the energy sector, has also gone down; while, in the case of transport, the share showed a sharp increase during the ninth and the tenth plans. On the whole, it can be said that the shift from financing the investment in the industrial and the commercial public enterprises towards financing the social and the rural sector programmes has been one of the important reasons underlying a rise in the share of the revenue expenditure in the centre’s plan expenditure.
TABLE 9.9 Percentage Composition of Centres Expenditure (Plan and Non-plan, Revenue and Capital)

TABLE 9.10 Changing Composition of Plan Expenditure of the Centre

Note: * Four years average.
Source: Computed from Expenditure Budget (Several Issues).
9.3.3 Non-Plan Expenditure
The non-plan expenditure of the central government has been marked by a high degree of inflexibility, in terms of its composition, and this problem has continued to persist over the years, despite various efforts to reform and curtail its growth. Table 9.11 provides the composition of the non-plan expenditure, in terms of the total expenditure of the central government. It is seen that the interest payments are the largest component of the non-plan expenditure.
The share of the interest payment in the total expenditure, which was about 16.5 per cent during the second half of the 1980s, increased to 28.8 in the second half of the 1990s and reached over 30 per cent by 2000–01. Though the share of the interest payments in the total expenditure has moderated thereafter, it nevertheless accounts for a major component of the revenue expenditure on the non-plan side.
9.3.4 Subsidies
Rigidity in the non-plan expenditure has also been due to a quantum of explicit subsidies. The food and fertilizer subsidies are the main explicit subsidies provided by the centre and, along with the other subsidies, have continued to account for over 10 per cent of the total government expenditure. The explicit subsidies increased sharply in 2007–08 and 2008–09, to reach over 14.7 per cent of the total expenditure due to the firming up of commodity prices, particularly those of food, fuel and fertilizer.
TABLE 9.11 Non-plan and Plan Expenditures as Percentage of Total Expenditure of the Government

Source: Computed from Expenditure Budget Vol. 1, Ministry of Finance (Various Years).
TABLE 9.12 Interest Payment and Subsidies as Percentage of Net Revenue Receipts of the Centre
| Interest payments | Subsidies | |
|---|---|---|
| 1980–85 | 23.3 |
15.1 |
| 1986–90 | 30.4 |
17.5 |
| 1991–95 | 43.7 |
17.6 |
| 1996–2000 | 48.7 |
13.8 |
| 2000–01 | 51.6 |
13.9 |
| 2001–02 | 53.4 |
15.5 |
| 2002–03 | 51.0 |
18.9 |
| 2003–04 | 47.0 |
16.8 |
| 2004–05 | 41.5 |
15.0 |
| 2005–06 | 38.4 |
13.7 |
| 2006–07 | 34.6 |
13.2 |
| 2007–08 | 31.6 |
13.1 |
| 2008–09 | 35.6 |
24.0 |
| 2009–10 | 38.0 |
22.7 |
Along with the explicit subsidies, the payment of interest took away over 61 per cent of the revenue receipts of the central government in the second half of the 1980s (Table 9.12). Since then, the burden of the interest payments (in relation to the revenue receipts) after increasing to over 53.4 per cent declined to 31.6 per cent of the NRR. Interest payments, together with the subsidies, continue to account for over 50 per cent of the net revenue receipts as of 2009–10.
In the case of the interest payments, the government has a little control over its outgo at a given point of time since it is a committed expenditure determined by the past stock of debt (and its composition), the current level of fiscal deficit and the rate of interest on government debt. The subsidies differ from other components of the public expenditure, which target the provision of public goods, as they support the private consumption or production in a manner that their incidence is difficult to quantify. Unless the subsidies are more efficiently delivered, they will continue to make the expenditure pattern inflexible, thereby reducing the financial resources for other developmental activities.
9.3.5 Salaries and Pension
The salaries and pensions are also in the nature of committed expenditure (mostly), under the non-plan expenditure. The rising pension and wage bill have been considered as one of the factors leading to a sharp rise in the revenue expenditure during the 1990s (Rao, 2002; Acharya, 2001). The share of the salaries and pension as a percentage of the GDP was lower during the first half of the 1990s as compared to the 1980s; however, with the implementation of the Fifth Pay Commission award in 1997, there was a spurt in the wage bill followed by a similar increase in the outgo on pension. After the forgoing increase in 1997–98, the combined share of salaries and pensions showed a declining trend, in relation to the total expenditure as well as the total revenue receipts (Figure 9.3). A similar situation has since arisen with the implementation of the recommendation of the Sixth Pay Commission (effective from 2006) and the payment of 40 per cent of the arrears in 2008–09 and 60 per cent in 2009–10, to the government servants. The expenditure on this count can be expected to taper off in the coming years.
Figure 9.3: Pay, Allowance and Pension as Percentage of Net Revenue Receipt and Total Expenditure

9.3.6 Resource Allocation and Use
The activity of the public expenditure has two dimensions. The first relates to the resource allocation, which is essentially a part of the budgetary process. The second relates to the resource utilization, which is an outcome arising from the implementation of programmes, projects and the expenditure incurred on purposes for which the resources were allocated. The economic reforms aimed at allowing a greater role to the private initiative and investment in the economy. At the same time, there have been frequent references on the need to improve the efficiency in the public expenditure in terms of the quality of outcomes. Despite the theoretical rationale underlying the public expenditure, scholars have observed that the study of public expenditure has received scant attention (Premchand, 2000) . More attention is devoted to the taxation and the revenue side of the budget (Mundle, S., 1997). The reason for this is not too far to seek. The public documents on government programmes provide information on the expenditure rather than on the outputs. A correlation of the output to the inputs, particularly the expenditure, is hard to make. Information on the decisions that go into committing public expenditure is often unavailable. In this context, Stiglitz (1998) observed that ‘the electorate only observes outcomes and seldom has the information required to assess whether reasonable actions were undertaken. Better information—including less secrecy—might enable better judgments to be made, and thus lessen biases towards risk avoidance on the part of the officials’. We briefly touch upon the efforts made to reform the public expenditure in the central government.
9.3.7 Reforming Government Expenditure
The successive central government budgets have contemplated measures to curb the built-in growth in expenditure, and to bring about structural changes in its composition. The finance ministry decided to introduce the system of Zero Base Budgeting (ZBB), in all the departments of the union government in 1986–87, to optimize the government expenditure in the seventh plan to all the schemes and programmes with over Rs one crore outlay. The practice has since continued at the time of launching new plans. In an ideal sense the ZBB implies, constructing a budget based on a fundamental reappraisal of the purposes, methods and resources. Every programme is subject to scrutiny to see if the objective can be achieved more cost effectively or if the scheme has outlived its utility. It was also intended that the schemes of similar nature be converged to achieve synergy in the implementation and resource use. The Centrally Sponsored Schemes (CSS) that could be transferred to the states were to be identified with resource flows linked to performance. The ZBB requires that each government programme, regardless of whether it is new or existing, must be justified in its entirety—each time a new budget is formulated. This concept implies that a complete re-examination of the ongoing programmes and activities should be carried out to assess their continued utility.
In order to contain further increase in the interest burden, a move was made from 1999 to 2000 to gradually align the rate of interest on contractual savings, like the GPF, the EPF and other small saving schemes, to the prevailing market rate. With a view to promoting transparency and curbing the growth of the contingent government liabilities, a Guarantee Redemption Fund was established in 2001–02. While the programme of privatization or disinvestment in the central PSUs remained low key through the 1990s, it started to gather momentum from 2001–02. In order to give a greater thrust to the process of disinvestments in the CPSEs, a separate Department of Disinvestment was set up. From 2002–03, fresh recruitments were restricted to 1 per cent of the total civilian staff strength of the government. Alongside, a decision was also taken to reform the system of pension for the government employees by introducing a pay-as-you go system, as opposed to the existing fully funded system.
To prepare a road map for reforming the government expenditure, an Expenditure Reforms Commission (ERC) was constituted in February 2000, to look into specific areas of expenditure correction. The commission submitted 10 reports covering various aspects like the cost of the buffer stock operations and rationalization of the fertilizer subsidies, optimizing the government staff strength by a ban on the creation of new posts for two years, introduction of the VRS and redeployment of the surplus staff in various government departments and autonomous institutions funded by the government budgetary support. Many of the reforms recommended by the expenditure commission are yet to take shape, and there is no specific public commitment or indication of the likely time frame in which the recommendations are going to be implemented.
The General Financial Rules 2005 were notified after revising the earlier rules of 1963, to deal with the matters of financial nature by the Government of India. The revision in the rules was necessitated by innovations in the information technology, growth of the alternative service delivery systems, outsourcing of services, the new systems of procurement and accounting and disposal of goods in line with the international practices. The rules cover the general system of financial management, budget formulation and implementation, government accounts, works, procurement of goods and services, inventory management, contract management, grants in aid and loans, budgeting and accounting for externally aided projects, government guarantees and transfer of land and buildings.
The Public-Private Partnership (PPP): The government introduced the PPP scheme so that the capital expenditure on building the infrastructure could be augmented by bringing in the private sector as a partner in the setting up and management of such facilities. The PPP projects are formed through contracts which allow concessions granted to the private sector partners. A few telecommunications, civil aviation, ports and roads projects have been commissioned. In 2006, the Scheme for Financial Support to PPPs in Infrastructure, through Viability Gap Funding, was introduced to provide grants—one time or deferred—to the infrastructure projects undertaken through the PPPs with a view to make them commercially viable.
In 2005–06, a system, the ‘Outcome Budget’, was introduced wherein all government spending departments were required to indicate targeted outcomes and actual achievements, in physical terms in the form of outcomes rather than only in the form of financial expenditure.
While it may be difficult to quantify the overall impact of all the measures taken to reform the expenditure, it is clear that expenditure management in the government will have much more focused attention, if there has to be a tangible difference in terms of the quality of government interventions. With a greater involvement of the private sector and the use of the public assets, such as land, the spectrum and rights, the need to ensure transparency in bidding processes and proper incentive mechanisms has also become critical for ensuring that future tax and non-tax revenues of the government remain buoyant.
9.4 Fiscal Policy and Fiscal Responsibility
In a situation where a large proportion of the government expenditure is financed over a prolonged period, from borrowing, the build-up of debt leads to the expenditure getting increasingly allocated for meeting the debt servicing and the interest payments. The fiscal deficits financed by borrowing, add to the government debt. Figure 9.4a shows the trend in fiscal deficit and the debt of the central government. Between 1990–91 and 1996–97, the centre’s fiscal deficit declined from 7.8 to 4.8 per cent of the GDP. During the second half of the 1990s, the converse happened, as the fiscal deficit increased to 5.4 per cent by 1999–2000, a trend that continued till 2002–03, mainly on higher expenditure on account of the implementation of the recommendations of the Fifth Pay Commission and the slower growth in the tax revenues on the receipts side. As a consequence, after witnessing some decline in the early 1990s, the stock of government debt rose steadily after 1997–98, as a percentage of the GDP.
Some measures had already been taken during the first half of the 1990s to strengthen the fiscal discipline. For instance, it was decided to discontinue the practice of the unlimited recourse to credit from the RBI, through the creation of the ad-hoc treasury bills from 1994–95. The objective of phasing out the automatic monetization of the budget deficit was to check the growth of the primary liquidity and to induce fiscal discipline by shifting the government borrowing to the market-based instruments, rather than rely on the RBI credit. Nevertheless, till the first half of the 1990s, a significant part of the government deficit continued to be financed by the banking sector through the high level of statutory liquidity ratios (SLRs).
Figure 9.4a: Fiscal Deficit and Debt/GDP Ratio—Centre and Combined

Market borrowing accounted for 26.2 per cent and borrowing from other sources (mainly SLR-based borrowing) accounted for over 44.9 per cent of the financing of the fiscal deficit, during the first half of the 1990s (Table 9.13). However, the first half of the 1990s was also a period of high nominal interest rates that in turn got reflected in the weighted average cost of borrowing and on the interest expenditure (Figure 9.4b). With the reform of the financial sector and the debt market, during the second half of the 1990s, the central government moved to raising debt at the market-related rates.18
The objective of the debt management policy was to raise the resources for the government by the RBI at the minimum cost, while containing the re-finance risk. The RBI thus followed a strategy using a combination of the auctions, private placement and the open market operations, with a view to minimize the cost of public debt, and to elongate the maturity pattern of the government debt. Even with the limitations arising from the large borrowing requirements of the central and state governments, the RBI was considerably successful in minimizing the cost of borrowing. Furthermore, the cost of borrowing to the government from the second half of the 1990s was contained due to low interest rates, easy liquidity conditions in the money market and sluggish growth in the credit to the corporate sector.
Regardless of these developments, including the decline in the weighted average interest cost of borrowing, the debt management continued to be constrained by the growing size of the government borrowing. Although the first half of the 1990s witnessed some fiscal correction, its retraction during the second half of the decade underlined the need for a consistent and sustainable fiscal consolidation process, which placed limits on the extent of public borrowing and moved towards a sustainable level of public debt. The management of the public debt also became an important element of the reform process, particularly after the enactment of the FRBMA in 2003.
TABLE 9.13 Financing of GFD of the Centre

Figure 9.4b: Interest Payment/GDP Ratio and Weighted Average Cost of Borrowing

The post-2003–04 period witnessed important developments that had a bearing on the public finances of the centre (as well as the states). There was a considerable improvement in the revenue growth, following the higher growth in the economy. Most importantly, the enactment of the FRBMA by the centre was also an important milestone in India’s fiscal history, as it marked the beginning of a statute and a rule-based management of the country’s public finances. The main obligations of the centre, under the FRBMA 2003 and FRBM Rules 2004, as set out, were as follows:
- Eliminate revenue deficit by 2008–09 by a minimum annual reduction of 0.5 per cent of the GDP every year from 2004–05.
- Reduce fiscal deficit by at least 0.3 per cent of the GDP annually from 2004 to 2005, so that fiscal deficit is reduced to no more than 3 per cent of at the end of 2008–09.
- Limit government guarantees to 0.5 per cent of the GDP in any financial year, and limiting additional liabilities to 9 per cent of the GDP in 2004–05, thereafter reducing the limit of 9 per cent by 1 per cent point of the GDP in each subsequent year.
- The central government not to borrow from the RBI from 2006–07.
- Disclosing specified information, such as the arrears of revenue, government assets and guarantees, latest from 2006–07.
- Undertaking of a quarterly review of the receipts and expenditure.
In effect the FRBMA brought together the elements of the fiscal policy, management and its administration under an over-arching legal framework. It brought forth the recognition that fiscal performance is the combined outcome on the revenue as well as the expenditure side that gets reflected in summary indicators, like deficit ratios, and to the level of public debt.
Originally, the FRBMA mandated that the revenue deficit should be eliminated and fiscal deficit contained at 3 per cent of the GDP by March 2008. In 2004, the target was shifted to March 2009, through an amendment of the Act. The annual deficit reduction targets could not be adhered to in 2005–06, as the centre pressed the ‘pause button’ to accommodate the higher transfers recommended by Twelfth Finance Commission. Nevertheless, by 2007–08 the fiscal and the revenue deficit indicators at 2.6 per cent of the GDP and 1.1 per cent of the GDP, respectively, were in line with the requirement under the Act. Table 9.14 presents the fiscal indicators of the central government from 2001–02.
The enactment of the FRBMA also set off a series of improvements in terms of the quality of disclosure and transparency in budget making, which has continued. Notable among these have been the inclusion of statements on—the gender budget, the revenue forgone due to exemptions and on the contingent liabilities of the central government (Table 9.15).
The healthy fiscal position as seen through the indicators in 2007–08, however, underwent a somewhat dramatic change in 2008–09. There was a total reversal in the process of fiscal correction, following the impact as well as the fiscal response to the global financial crisis.
TABLE 9.14 Fiscal and Revenue Deficit to GDP Ratios (%)

TABLE 9.15 Changes Introduced Towards Improved Budgeting and Transparency
| Receipts • Statement of revenue forgone introduced in 2006–07 • Information on arrears of tax in the budget |
| Expenditure • Introduction of gender budgeting • Statement on transfers to states • Transfer to autonomous bodies |
| Fiscal deficit and debt • Presentation of contingent liabilities’ • Declaring of budget liabilities with fiscal impact |
| Procedural • Budget manual—July 2010 |
Source: Compiled from Budget Documents.
9.5 The Global Financial Crisis and the Fiscal Response
The global downturn caused a sharp decline in the GDP growth in 2008–09. The GDP growth declined sharply to 6.7 per cent in 2008–09, from an average of 9.4 per cent in the preceding three years. Apart from the impact of the international developments, deficient in the south-west monsoon in 2009–10 was also an adverse factor affecting the growth. The sharp decline in the growth of the economy has not only triggered an expansionary fiscal stance by the centre as a counter-cyclical measure, but was also followed by a slowdown in the tax revenues and therefore in a worsening of the fiscal deficit.
In view of the severity of the crisis that originated from the international economy, India had to take both the monetary and the fiscal measures in order to restore the growth momentum. The monetary and the credit-related measures, taken by the RBI, relate to a provision of adequate liquidity and credit delivery, progressive reduction in the signalling Repo rate under the Liquidity Adjustment Facility (LAF), a reduction in the Cash Reserve Ratio (CRR) and SLR for banks and to improve forex liquidity, while at the same time containing the financial contagion from the global financial crisis. These measures were supplemented with the sector-specific credit measures for exports, housing, micro and small enterprises and infrastructure.
9.5.1 Fiscal Measures
The extraordinary situation that emerged due to the crisis led to a sharp shrinkage in demand for the exports. The domestic demand also had moderated considerably, leading to a downturn in the industry and the services sector, as seen in the GDP growth, especially for the third and the fourth quarters of 2008–09. The situation arising from a sudden shrinkage in the demand (especially export demand) necessitated a fiscal response. The fiscal stimulus from December 2008 to February 2009 consisted of the expansionary plan expenditure, including additional allocations under the plan for CSS, like the National Rural Employment Guarantee Scheme (NREGS), reduction in indirect taxes, sector-specific measures for textiles, housing, infrastructure, automobiles, micro and small sectors, and exports and authorization to specified financial institutions, like the India Infrastructure Investment and Finance Company Limited (IIFCL), to raise the tax-free bonds to fund the infrastructure projects. The government effected an across the board cut of 4 per cent in ad valorem, CENVAT rate, except for the petroleum products.
Prior to these measures, a payout to government employees following the Pay Commission report and farm loan waiver package, to alleviate the debt burden of the distressed farmers, had already been implemented. These additional commitments, though not a part of the stimulus, nevertheless, served as a fiscal stimulus to the economy.
The additional provision of funds for the food and fertilizer subsidies, as also the fiscal stimulus, resulted in a higher fiscal burden; and the revenue and expenditure sides were impacted adversely. While the revenue deficit for 2008–09 increased to 4.6 per cent of the GDP as against the budgeted figure of 1.0 per cent of the GDP, the fiscal deficit for 2008–09 turned out to be 6.2 per cent of the GDP in 2008–09 (excluding the off-budget items) as compared to 2.5 per cent in Budget Estimates (BE) 2008–09.19 Collectively, these measures meant a ‘pause’ in the implementation of the FRBMA by the centre (as also the states).
9.5.2 Observations
The overall fiscal performance, during the 1990s, has been characterized by a divide in the mid-1990s in the attainment of fiscal targets. There was evidence of fiscal correction during 1991–92 to 1996–97 (except for 1993–94) in terms of a significant fall in the fiscal deficit. The fiscal deficit to the GDP ratio increased again, during the later half of the 1990s, and came down after 2002–03.20
On the revenue front, the results of these reforms have been in general positive. There has been a widening of the direct tax base. Despite periodic fluctuations, the gross tax to the GDP ratio of the centre has improved. Even though the goal of integrating the indirect taxes into an integrated goods and service tax is yet to be achieved, the road map for the same has been laid out. The task of reforming the revenue side of the government has been long drawn and is continuing. The reforms of the tax system in the Indian context has to contend with the complexity arising from the need to address the imbalances in the revenues between different levels of government (vertical) and among the different units within each of the levels (horizontal) within a federal set-up. Nevertheless, it can be said that the road map for reforming the taxation system has been relatively clear and comprehensive from the outset.
A beginning has also been towards modernizing the tax machinery. Conceptualizing changes in the tax administration has been difficult since the tax structure and the revenue machinery have had to contend with the multiple interest groups, such as the corporate entities, trade, small businesses and not the least individual taxpayers. Nevertheless, a predominant share of the measures relating to the tax administration pertains to clearly identified wings of the central government, viz., the Department of Revenue and its formations dealing with the levy and collection, and adjudication.
The task of reforming the expenditure side of the government has been more difficult with added dimensions of complexity. This is because changes in the composition of the public expenditure (in the context of the economic reform process) directly reflect a change in the role of the state. Its impact is direct and visible. The fact that the centre’s expenditure is spread across a large number of departments, each with its own sphere of intervention, programmes and schemes, has meant that the task of comprehending, conceptualizing and translating into action has been very difficult.21 This difficulty has been compounded by an inherent inertia in the composition of the expenditure.
The change in the composition of the expenditure (plan expenditure) towards social sectors, as compared to the earlier focus on the industrial sector, reflects a shift in the direction of government intervention. This shift by itself cannot be faulted to the extent that the social sector programmes aim at creating social and human capital. However, the ability to sustain an increasing share of the social sector expenditure would be contingent on improvement in the tax revenue mobilization (instead of debt-based financing). It needs to be recognized that even under the most stringent assumptions; most of the social sector programmes cannot be expected to recover the costs. Furthermore, the economic impact of these programmes depends strongly on the quality of governance and the capacity to deliver. Even where the private sector is expected to enter, it would be necessary to ensure that conditions prevail in such a manner that private investment is able to step into the areas vacated by the public sector. In other words, the process of fiscal reform may now have entered a more complex phase, where the issues of governance, interface with the private sector and better expenditure management may need greater focus both in terms of policy and practice.
References
Acharya, S. (1986). Aspects of the Black Economy in India, New Delhi, NIPEP.
Acharya, S. (2001). India’s Macroeconomic Management in the Nineties, Indian Council of Research in International Economic Relations, New Delhi, October 2001.
Ahluwalia, M. S. (2002). Economic reforms in India since 1991: Has Gradualism worked? http://planningcommission.nic.in/aboutus/speech/spemsa/msa008.doc (also in Journal of Economic Perspectives, Summer 2002).
Ahmad, E., and Nicholas, S. (1991). The Theory and Practice of Tax Reform in Developing Countries (Cambridge University Press), Great Britain.
Bagchi, A. (1997). Taxation of goods and Services in India, an overview. In S. Mundle (Ed.), Public finance, policy issues for India. New Delhi: Oxford University Press.
Bagchi, A., and Nayak, P. (1994). ‘A Survey of Public Finance and the Planning Process: The Indian Experience.’ In A. Bagchi, and N. Stern (Eds.), Tax Policy and Planning in Developing Countries, New Delhi: Oxford University Press.
Bagchi, A., and Nicholas, S. (1994). Tax policy and planning in developing countries, New Delhi: Oxford University Press.
Burgess, R., and Nicholas, S. (1993). “Tax reform in India,” Working Paper No. 45, STICERD, London School of Economics.
Change to Government of India (CGT) (2004).
Das-Gupta, A. (2002). Central tax and administration reform in the 1990s. In M.G. Rao (Ed.), The development, poverty and decentralization, New Delhi: Oxford University Press.
Das-Gupta, A., and Mookerjee, D. (1997). Design and enforcement of personal income tax in India. In S. Mundle (Ed.), Public finance, policy issues for India (pp. 140–196). New Delhi: Oxford University Press.
Government of India. (1992). Economic survey, 1991–92, New Delhi, Ministry of Finance.
Government of India. (1993). Economic reforms, two years after and the tasks ahead. Ministry of Finance, Department of Economic Affairs, New Delhi.
Government of India. (2002). Five Year Plan—2002–2007 (tenthplan document), Planning Commission, Macroeconomic Dimensions, New Delhi, Planning Commission.
Government of India. (2004). Central government subsidies in India. A report prepared with assistance of NIPFP, Ministry of Finance, New Delhi.
Government of India. (2004). Report of the expert group constituted to review the classification system for government transactions, Ministry of Finance.
Hinrichs, H. H. (1966). A general theory of tax structure, change during economic development, Cambridge: Law School of Harvard University.
International Monetary Fund. (1998). Tax revenue performance during the post-reform period, in India. Selected issues, IMF Staff Country Report No. 98/112.
Maxwell J. F (1997). Emancipating the Banking System and Developing Markets for Government Debt.
Meade Committee Report. (1978). Report of the committee on the structure and reform of direct taxation, (UK), pp. 777–79.
Ministry of Finance. (2000). Report of the Eleventh Finance Commission (For 2000–2005).
Ministry of Finance, GOI. (2004). Report of the task force on Implementation of the Fiscal Responsibility and Budget Management Act, 2003.
Mundle, S. (1997). Public finance. Policy issues for India. Oxford University Press, New Delhi.
Musgrave, R. and Musgrave, P. B. (1976). Public Finance in Theory and Practice, McGraw Hill.
Pattnaik, R. K., Raj, D. S., and Chander, J. (2009). Emprical fiscal research in India: A Survey. RBI staff studies (The document is available on the RBI web site).
Pillai, M. S. et al. (1997). Fiscal policy: Issues and perspectives. In RBI Occasional Papers Vol. 18 (pp. 188–223).
Planning Commission. (2001). ‘Tax Policy and Tax Administration for the Tenth Plan’.
Premchand, A. (2000). Control of public money, the fiscal machinery in developing countries, New Delhi: Oxford University Press.
Purohit, M. (1994). Reforms in fiscal policy, some issues in the context of liberalization, LNSNAA, Mimeo.
Rangarajan, C. (1989). Dynamics of interaction between government deficit and domestic debt in India. In Select Essays on Indian Economy by C. Rangarajan. Academic Press.
Rao, M. G. (2002). Development, poverty and fiscal policy, decentralization of institutions, New Delhi: Oxford University Press.
Rao, M. G. (2005). Tax system reform in India: Achievements and challenges ahead. Journal of Asian Economics, 16 (2005), 993–1011.
RBI. (2003). Report on Currency and Finance 2001–02.
Shome, P. (1988). On the elasticity of developing country tax system. Economic and Political Weekly, August 20.
Shome, P. (1997). Economic liberalization, fiscal performance and tax reform. In S. Mundle (Ed.), Public finance, policy issues for India. New Delhi: Oxford University Press.
Shome, P. (2000). India: Primary aspects of a medium term fiscal strategy, Indian Council for Research on International Relations (ICRIER), New Delhi.
Stiglitz J. (1998). Redefining the role of the state, What should it do? How should it do it? And how should these decisions be made? Address on the Tenth Anniversary of MITI 17 March 1998 Research Institute Tokyo, Japan.
Thimmaiah, G. (2002). Evaluation of tax reforms in India. In M. G. Rao (Ed.), Development, poverty and fiscal policy, New Delhi: Oxford University Press.
TRC (1991). Interim Report of the Tax Reforms Committee, Chairman: Chelliah, R. J., New Delhi: Ministry of Finance.
TRC (1992). Tax Reforms Committee: Final Report, Chairman: Chelliah, R. J., New Delhi: Ministry of Finance.