7
ANALYSIS
Analysis includes the processes to examine and document product information in sufficient detail to ensure that it reflects the stakeholders' needs, aligns to their goals and business objectives, and enables the identification of viable solution designs.
The Analysis processes are:
7.1 Determine Analysis Approach—The process of thinking ahead about how analysis will be performed, including what will be analyzed; which models will be most beneficial to produce; and how requirements and other product information will be verified, validated, and prioritized.
7.2 Create and Analyze Models—The process of creating structured representations, such as diagrams, tables, or structured text, of any product information to facilitate further analysis by identifying gaps in information or uncovering extraneous information.
7.3 Define and Elaborate Requirements—The process of refining and documenting requirements and other types of product information at the appropriate level of detail, format, and level of formality required for various audiences.
7.4 Define Acceptance Criteria—The process of obtaining agreement as to what would constitute proof that one or more aspects of a solution have been developed successfully.
7.5 Verify Requirements—The process of checking that requirements are of sufficient quality.
7.6 Validate Requirements—The process of checking that the requirements meet business goals and objectives.
7.7 Prioritize Requirements and Other Product Information—The process of understanding how individual pieces of product information achieve stakeholder objectives, and using that information, along with other agreed-upon prioritization factors, to facilitate ranking of the work.
7.8 Identify and Analyze Product Risks—The process of uncovering and examining assumptions and uncertainties that could positively or negatively affect success in the definition, development, and the expected results of the solution.
7.9 Assess Product Design Options—The process of identifying, analyzing, and comparing solution design options based on the business goals and objectives, expected costs of implementation, feasibility, and associated risks, and using the results of this assessment to provide recommendations regarding the design options presented.
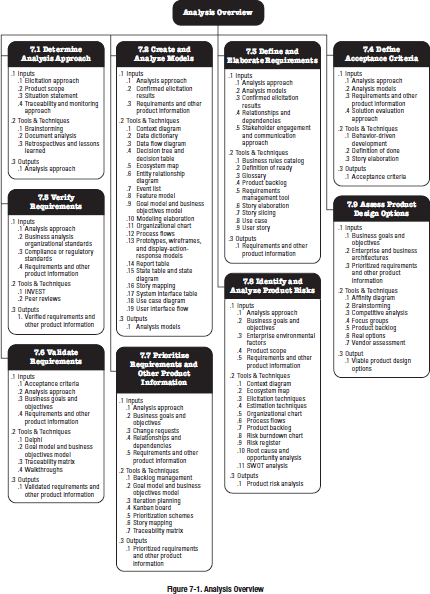
Figure 7-1 provides an overview of the Analysis processes. The business analysis processes are presented as discrete processes with defined interfaces, although, in practice, they overlap and interact in ways that cannot be completely detailed in this guide.
KEY CONCEPTS FOR ANALYSIS
Analysis is the process of examining, breaking down, synthesizing, and clarifying information to further understand, complete, and improve it. Analysis is one of the primary activities performed on any portfolio, program, or project, and typically warrants the commitment of a significant amount of effort. Beyond analyzing, modeling, and documenting product information, analysis completes the set of product information by ensuring that it is correct, conforms to standards, can be traced to goals, has inherent risks identified, and can be turned into the product design.
Analysis can be performed on any product information; however, there is a focus on requirements-related information. The type of product information and the format it takes are highly dependent on the project life cycle. Analysis processes are often performed iteratively and in conjunction with elicitation processes.
7.1 DETERMINE ANALYSIS APPROACH
Determine Analysis Approach is the process of thinking ahead about how analysis will be performed, including what will be analyzed; which models will be most beneficial to produce; and how requirements and other product information will be verified, validated, and prioritized. The key benefit of this process is that it supports a shared understanding of the business analysis work to be performed to develop the solution. The inputs, tools and techniques, and outputs of the process are depicted in Figure 7-2. Figure 7-3 depicts the data flow diagram for the process.


The analysis approach identifies the relevant types of product information that will be considered during business analysis. It includes an idea of the models that would be beneficial to produce, the requirements attributes that need to be captured, and an explanation about how product information will be verified, validated, and prioritized.
When using a predictive delivery approach, the analysis approach should also define the requirements life cycle for the portfolio, program, or project. The requirements life cycle represents the various phases or states through which a requirement moves as it is defined, elaborated, verified, validated, and prioritized. When using an adaptive delivery approach, the requirement states may be more implicit. User stories may be stated as not ready, ready, or done, where done is coupled to the delivery and acceptance of that portion of the solution that satisfies the requirement.
Requirements attributes are further discussed in Section 5.2.3.1 of Business Analysis for Practitioners: A Practice Guide.
The analysis approach uses the requirements architecture defined in Section 8.1, which specifies how requirements, models, and other product information relate to one another. The analysis approach also identifies which analysis models are most appropriate and how they will trace to one another. The analysis approach defines which analysis activities are pertinent, which templates to start from when documenting requirements, which tools to use, and how any of those might be modified. For organizations with less formal documentation needs, the analysis approach may specify whether snapshots of sketches or informal notes from analysis sessions need to be kept or when more formal documentation is advisable.
An analysis approach involves thinking about what analysis activities and techniques are likely to be useful, when they should be used, who should be involved, and which format is appropriate for any artifacts produced, based on a variety of factors, including complexity, risk, and value. In adaptive life cycles, determining the analysis approach may not be formally named, but the activities to determine the analysis approach are still similar. Determining the analysis approach should include:
- When and how models will be created and analyzed, which models are most appropriate, which stakeholders will be using and reviewing the models, which modeling language to use, and how detailed the models should be;
- When requirements definition and elaboration will occur and the level of depth that is appropriate for the requirements;
- An approach for defining acceptance criteria that describes when and what level of acceptance criteria to capture;
- An approach for verification to understand who will be involved in verifying requirements, when verification will occur and how frequently, and how best to ensure that requirements are well written, understood, and compliant with any standards;
- How to validate requirements to understand what information is used for validation and who should be involved in ensuring that the requirements achieve the business goals and objectives;
- A prioritization approach early in the portfolio, program, or project to ensure that stakeholders have correct expectations about how priorities will be determined and who has the authority to decide priorities;
- An approach to identify and manage risks to ensure that important risks are not overlooked during analysis activities; and
- An approach for assessing product design early so that the level and timing of design work is agreed upon.
Not all techniques need to be decided upon before analysis begins, but by thinking ahead, it is more likely that business analysts will be prepared to use a variety of techniques. Part of planning for analysis includes determining which types of analysis tools and techniques would be most beneficial given what is known about the participants, portfolio, program, or project at any given point in time. Some analysis might not be planned until it is time to perform the analysis, and, in other cases, the predefined analysis approach will just be updated when needed. Planning for various analysis approaches is further discussed in Section 3 of Business Analysis for Practitioners: A Practice Guide.
Analysis is most effective when it is conducted concurrently with elicitation. Analysis frequently provokes relevant and important questions about the situation, requiring more elicitation. Regardless of the project life cycle used, elicitation and analysis are usually iterative and intertwined; therefore, determining the analysis approach is an activity that will be performed repeatedly throughout the duration of a portfolio, program, or project.
7.1.1 DETERMINE ANALYSIS APPROACH: INPUTS
7.1.1.1 ELICITATION APPROACH
Described in Section 6.1.3.1. The elicitation approach explains how elicitation will be performed, including the elicitation activities that will be conducted. Business analysis teams use the elicitation approach as a starting point for determining some aspects of the analysis approach. The planned elicitation techniques and their outputs might influence which analysis techniques are applicable. The timing of individual elicitation activities will affect when related analysis activities happen. The timing of stakeholder involvement in elicitation activities will impact the timing of analysis based on when elicitation outputs will be ready. However, elicitation does not need to be complete to start analysis, and in fact, small increments of both are often performed concurrently.
7.1.1.2 PRODUCT SCOPE
Described in Section 4.6.3.2. Product scope is defined as the features and functions that characterize a solution. The product scope defines the boundaries within which analysis takes place.
7.1.1.3 SITUATION STATEMENT
Described in Section 4.1.3.2. The situation statement provides an objective statement about the problem or opportunity the business is looking to address, along with the effect and impact the situation is having on the organization. The situation statement provides context about the problems or opportunities being analyzed to help determine what information will need to be analyzed and how it might need to be analyzed. Business analysts are confronted with different types of information, and the situation statement helps separate out irrelevant information that might interfere with proper analysis.
7.1.1.4 TRACEABILITY AND MONITORING APPROACH
Described in Section 8.1.3.1. The traceability and monitoring approach defines the traceability and change management processes for the portfolio, program, project, or product. One of the components of that approach is how the requirements, models, and other product information relate to one another, which is an important input for selecting analysis techniques that support creating models, using the models together, and identifying requirements from the models.
7.1.2 DETERMINE ANALYSIS APPROACH: TOOLS AND TECHNIQUES
7.1.2.1 BRAINSTORMING
Brainstorming is a technique used to identify a list of ideas within a short period of time. When determining the analysis approach, brainstorming is helpful to identify analysis tools and techniques, including ones that might be outside a business analyst's typical tool set. For more information on brainstorming, see Section 5.1.2.1.
7.1.2.2 DOCUMENT ANALYSIS
Document analysis is an elicitation technique used to analyze existing documentation to identify relevant product information. Document analysis can help determine which existing models in the organization could be used as a starting point for analysis, thereby affecting which analysis activities need to be performed and how long they will take. For more information on document analysis, see Section 6.3.2.3.
7.1.2.3 RETROSPECTIVES AND LESSONS LEARNED
Retrospectives and lessons learned use past experience to plan for future work. When determining an analysis approach, retrospectives and lessons learned can leverage past analysis experiences to plan for future analysis work. When determining the analysis approach, review what worked and what may require improvement in a past similar situation. Retrospectives and lessons learned, combined with experience and expert judgment, are the basis for tailoring the analysis approach to fit the needs of the portfolio, program, or project and organization. For more information on retrospectives and lessons learned, see Section 5.7.2.4.
7.1.3 DETERMINE ANALYSIS APPROACH: OUTPUTS
7.1.3.1 ANALYSIS APPROACH
The analysis approach describes how analysis will be performed; how to verify, validate, and prioritize requirements and other product information; how risks will be identified and analyzed; how design options will be assessed; and which techniques and templates are expected to be used to perform any analysis. The analysis approach includes which requirements attributes need to be captured and how the requirements architecture impacts analyzing models. It also describes what other information or models from the organization might be used during analysis. This output will likely be updated throughout the course of the portfolio, program, or project.
7.1.4 DETERMINE ANALYSIS APPROACH: TAILORING CONSIDERATIONS
Adaptive and predictive tailoring considerations for Determine Analysis Approach are described in Table 7-1.
Table 7-1. Adaptive and Predictive Tailoring for Determine Analysis Approach
| Aspects to Be Tailored | Typical Adaptive Considerations | Typical Predictive Considerations |
| Name | Not a formally named process | Determine Analysis Approach |
| Approach | Describes the types of product information to be defined and refined during analysis. Though some high-level planning might occur, most of the analysis approach is defined just before or early in each iteration for the analysis that will occur during that iteration. Analysis performed in one iteration might not be used by the development team until a later iteration. | A high-level analysis approach is defined early, during a planning phase. The analysis approach is refined throughout the portfolio, program, or project. It describes types of product information to be defined and refined during analysis. |
| Deliverables | Not a separate deliverable. | Detailed analysis approach resides in a business analysis plan. |
7.1.5 Determine Analysis Approach: Collaboration Point
Based on their own experiences, business analysts work together as peers to help identify analysis tools, templates, and techniques that might be relevant. Collaboration with other business analysts who may be responsible for different aspects of product information is also recommended to avoid duplication of effort and to ensure continuity of analysis activities.
7.2 CREATE AND ANALYZE MODELS
Create and Analyze Models is the process of creating structured representations, such as diagrams, tables, or structured text, of any product information to facilitate further analysis by identifying gaps in information or uncovering extraneous information. The key benefit of this process is that it helps convey information in an organized manner that provides clarity and helps achieve correctness and completeness. The inputs, tools and techniques, and outputs of the process are depicted in Figure 7-4. Figure 7-5 depicts the data flow diagram for the process.


Models are visual representations of information, in the form of diagrams, tables, or structured text, that effectively arrange and convey a lot of information in a concise manner. Create and Analyze Models includes both developing the analysis models determined by the analysis approach and using those models to improve the overall product information. Analyzing models is helpful for finding gaps in information and identifying extraneous information by exploring the solution from multiple perspectives. Models provide context to discussions and analysis and provide for better understanding of complex relationships and concepts. Often, models can convey information more clearly than textual descriptions. Models provide a concise format to present information and can be used to clarify and discover information with stakeholders. Analyzing models involves looking at a few pieces of information, not necessarily the whole set of information, and finding patterns to explore the problem space further.
When performed in conjunction with elicitation, creating and analyzing models can be solitary or interactive activities. Creating and analyzing activities are highly iterative. Drafts of models are created based on the confirmed elicitation results. Those models might go back through elicitation sessions to identify new information to be refined and reanalyzed in the models. The Create and Analyze Models process is often performed concurrently with Sections 7.5 on Verify Requirements and 7.6 on Validate Requirements.
Models are important inputs to business analysis activities that occur outside of the Create and Analyze Models process, including:
- Defining and elaborating requirements;
- Building a shared understanding of the information;
- Mapping the relationships and dependencies within and across portfolios, programs, and projects;
- Finding information gaps that require additional elicitation;
- Identifying stakeholders who weren't previously included;
- Facilitating stakeholder understanding of the information during elicitation or review;
- Assessing capability gaps between the current and future states of a product;
- Analyzing changes to identify which areas of a product are impacted;
- Understanding what is of value for users;
- Prioritizing product information or projects in a portfolio;
- Estimating business analysis work; and
- Providing a business perspective on architectural designs.
The previous activities might require updates to existing models or the creation of new models.
The models are organized into five categories: (1) scope models (bounding the solution), (2) process models (how the solution will be used), (3) rule models (rules the solution needs to enforce), (4) data models (data used in a process or system and its life cycle), and (5) interface models (how the solution interacts with other systems and users). By analyzing the solution from these five different views or categories of models, a business analyst can obtain a complete picture of the product. The models are organized by category in Table 7-2.
Table 7-2. Models Organized by Category
| Category | Example Models | Example Models |
| Scope Models | Models that structure and organize the features, functions, and boundaries of the business domain being analyzed | • Context diagram • Ecosystem map • Event list • Feature model • Goal and business objectives model • Organizational chart (Section 5.1.2.3) • Use case diagram |
| Process Models | Models that describe the business processes and ways in which stakeholders interact with those processes | • Process flow • Use case (Section 7.3.2.8) • User story (Section 7.3.2.9) |
| Rule Models | Models of concepts and behaviors that define or constrain aspects of a business in order to enforce established business policies | • Business rules catalog (Section 7.3.2.1) • Decision table • Decision tree |
| Data Models | Models that document the data used in a process or system and its life cycle | • Data dictionary • Data flow diagram • Entity relationship diagram • State diagram • State table |
| Interface Models | Models that assist in understanding specific systems and their relationships within a solution and with user | • Display-action-response model • Prototype • Report table • System interface table • User interface flow • Wireframe |
There are many modeling languages, and each has its strengths and weaknesses. A few example languages are discussed in Section 4.10.6 of Business Analysis for Practitioners: A Practice Guide.
There is no single model that shows everything that is useful in a portfolio, program, or project. Similarly, no situation ever requires all models to be created. Some models are more useful in certain domains than others. Some models that are useful to complete business analysis might be created by more technical resources on the team. Business analysis involves choosing the models that are most useful given what is known about the situation and determining who best to collaborate with to create and review them. While models can provide clarity over textual descriptions, some analysis models may require that text be used to elaborate upon the visual to help stakeholders understand how to read and interpret the model. In these cases, text and visual elements work nicely together to relay the proper level of information.
The techniques section of this process describes many choices of models that can be used for analysis purposes. In Section 7.2.2.10, there is one technique, modeling elaboration, which is not a model; rather, it describes how to use models together to confirm completeness or find gaps. A few models are described in other locations in this guide; their sections are identified in Table 7-2. There are also models not described in this guide. Business analysts may use different models or even find it necessary to craft a new model in some cases.
7.2.1 CREATE AND ANALYZE MODELS: INPUTS
7.2.1.1 ANALYSIS APPROACH
Described in Section 7.1.3.1. The analysis approach, which defines how to conduct analysis, includes a list of candidate models to be created. As the models are analyzed, new model types might need to be created and the analysis approach may need to be updated. The analysis approach also describes the requirements architecture that describes which models are most likely to relate to one another for modeling elaboration. For information on modeling elaboration, see Section 7.2.2.10.
7.2.1.2 CONFIRMED ELICITATION RESULTS
Described in Section 6.4.3.1. Confirmed elicitation results signify that the product team has reached a common understanding about the elicitation results and agrees on the accuracy of the information elicited. Confirmed elicitation results include notes, requirements, and other outputs from completed elicitation activities. These results include the information that is needed to create first-draft models. As the models are created and analyzed for gaps, the business analyst may discover additional questions about scope, processes, rules, data, or interfaces that will require additional elicitation.
7.2.1.3 REQUIREMENTS AND OTHER PRODUCT INFORMATION
Described in Section 7.3.3.1. Requirements and other product information include all information about a solution and are the culmination of results from elicitation and analysis activities. The subset of this information that is most relevant as an input is any previously defined requirements, acceptance criteria, and other analysis models. As work progresses, the volume of requirements and other product information will grow or be refined, providing additional context to create new models or analyze existing ones.
7.2.2 CREATE AND ANALYZE MODELS: TOOLS AND TECHNIQUES
7.2.2.1 CONTEXT DIAGRAM
A context diagram is a scope model that shows all the direct system and human interfaces to systems within a solution. A context diagram clearly depicts the in-scope systems and any inputs or outputs, including the systems or actors providing or receiving them.
Like ecosystem maps, which are described in Section 7.2.2.5, context diagrams are generally created early to define scope and can be updated as new information is identified. They also help identify interface requirements and data requirements. Figure 7-6 shows a sample format of a context diagram. Context diagrams are further discussed and an example is provided in Section 4.10.7.3 of Business Analysis for Practitioners: A Practice Guide.

7.2.2.2 DATA DICTIONARY
A data dictionary is a data model that lists the data fields and attributes of those fields for a data object. The data fields are additional details for the data objects in an entity relationship diagram, which are described in Section 7.2.2.6. The attributes specify information about the fields, including business rules enforced by data.
Data dictionaries are often created after other data models have first been used to identify the data objects and when those objects need more details specified. Data dictionaries can be pulled from existing systems as a register of all data in the system and used as an input for system enhancements. They are typically created in conjunction with defining the requirements and acceptance criteria. Figure 7-7 shows a sample format of a data dictionary. There are typically many more columns in a data dictionary than are shown in Figure 7-7. Data dictionaries are further discussed and an example is provided in Section 4.10.10.3 of Business Analysis for Practitioners: A Practice Guide.

7.2.2.3 DATA FLOW DIAGRAM
A data flow diagram is a data model that is used to describe the movement of data between external entities, data stores, and processes. External entities can be actors or systems. Data flow diagrams show the data inputs and outputs for each process.
Data flow diagrams are usually created during analysis. Entity relationship diagrams, process flows, and ecosystem maps are usually created first to identify the data objects, processes, and systems to show in a data flow diagram. Figure 7-8 shows a sample format of a data flow diagram. Data flow diagrams are further discussed and an example is provided in Section 4.10.10.2 of Business Analysis for Practitioners: A Practice Guide.

7.2.2.4 DECISION TREE AND DECISION TABLE
A decision tree and decision table are rule models that show a series of decisions and the outcomes to which the decisions lead. Decision trees and tables are often used to model business rules. The two decision models are used in different ways, and both might be needed. Decision trees visually show the flow of decisions and choices that lead to an outcome and can show ordered decisions. Decision tables are useful for ensuring that the business analyst has considered all possible combinations of decision scenarios and related outcomes.
Both decision models can be employed at any point to further analyze decision logic. Decision trees are usually easier for stakeholders to review than decision tables. Both decision trees and decision tables are useful as a foundation for test case creation, with each combination of decisions and outcomes being a test case. Figure 7-9 shows a sample format of a decision tree and Figure 7-10 shows a sample format of a decision table. Decision trees and decision tables and are further discussed and examples are provided in Section 4.10.9.2 of Business Analysis for Practitioners: A Practice Guide.


7.2.2.5 ECOSYSTEM MAP
An ecosystem map is a scope model that shows all the relevant systems, the relationships between systems, and optionally, any data objects passed between them. The systems are logical systems (business view); therefore, they may not match physical systems (implementation view) in architectural diagrams.
Ecosystem maps are most useful when they are created at the beginning of projects to understand all the systems that may be affected by or that will impact the in-scope systems. Ecosystem maps can be created for portfolios or programs to help identify potential dependencies between projects. The ecosystem map allows the business analyst to see where there are possible interface requirements or data requirements for systems directly interfacing to the solution and for those up- or downstream from the solution. Figure 7-11 shows a sample format of an ecosystem map. Ecosystem maps are further discussed and an example is provided in Section 4.10.7.2 of Business Analysis for Practitioners: A Practice Guide.

7.2.2.6 ENTITY RELATIONSHIP DIAGRAM
An entity relationship diagram (ERD), also called a business data diagram, is a data model that shows the business data objects or pieces of information of interest in a product and the cardinality relationship between those objects. Cardinality is the number of times that one entity occurs in relationship to the other entity in the relationship, and whether the relationship is required or optional. The data objects shown in an ERD are not meant to be exact data objects in a database, but rather a conceptual view of the data in the solution from the perspective of the business. The entity relationship diagram helps identify the data that are created in, consumed by, or output from a system. When used alongside process models, ERDs can be used to model the data of importance from a process perspective.
ERDs are typically created relatively early in analysis to understand the scope of the data to be analyzed. This model also helps identify any processes that might create, consume, or manipulate the data, as well as business rules about the data. ERDs are also a likely input for database designers and architects to use in database design. Figure 7-12 shows a sample format of an entity relationship diagram. ERDs are further discussed and an example is provided in Section 4.10.10.1 of Business Analysis for Practitioners: A Practice Guide.

7.2.2.7 EVENT LIST
An event list is a scope model that describes any external events that trigger solution behavior. Event lists help define the in-scope events that the solution has to react to or handle. An event response table is a related model that extends the event list to describe the system's response to any event triggers.
Event lists are created early to ensure that the scope of work is defined and might be updated as work continues and new events are identified. Event response tables are created to help identify likely use cases, user stories, or system flows. Figure 7-13 shows a sample format of an event response table where an event list would be composed of the first two columns.

7.2.2.8 FEATURE MODEL
A feature model is a scope model that visually represents all the features of a solution arranged in a tree or hierarchical structure. Most projects have features at varying levels; the top-level features are called Level 1 (L1) features, followed by Level 2 (L2) features, and so on. Feature models are helpful to show how features are grouped together and which features are subfeatures of other ones. Feature models are useful because they can easily display many features across different levels on a single page, which may represent an entire solution's feature set.
This model is typically started at the beginning of a project to show all the features that are in scope for a program or project, and is updated as additional features are identified during elicitation and analysis. In adaptive projects, features can be labeled for inclusion in different iterations to facilitate release planning. The feature model can be used in combination with a brainstorming technique to help stakeholders identify features by focusing on the groupings, similar to an affinity diagram. Affinity diagrams are described in Section 4.3.2.1. Figure 7-14 shows a sample format of a feature model. Feature models are further discussed and an example is provided in Section 4.10.7.4 of Business Analysis for Practitioners: A Practice Guide.

7.2.2.9 GOAL MODEL AND BUSINESS OBJECTIVES MODEL
A goal model and business objectives model are scope models that organize and reflect the goals and business objectives in relation to other product information. Goal models typically show the stakeholder goals for a solution, with any supporting or conflicting goal relationships indicated. Business objectives models relate the business problems, business objectives, and top-level features. Goal models and business objectives models are typically created at the start of a new program or project or earlier to help prioritize programs and projects within a portfolio. They can be created at any point, for prioritization purposes.
In business objectives models, business problems and business objectives decompose high-level business strategies into lower-level problems and business objectives to visually represent the value of the portfolio, program, or project and how the solution will achieve the business objectives. Whether the value is identified as increasing revenue, decreasing cost, or avoiding penalties, goal models and business objectives models visually represent the value that supports feature prioritization decisions and product scope management.
Figure 7-15 shows a sample format of a business objectives model. Business objectives models are further discussed and an example is provided in Section 4.10.7.1 of Business Analysis for Practitioners: A Practice Guide.

7.2.2.10 MODELING ELABORATION
Modeling elaboration is a technique that uses the collection of models together to further identify gaps, inconsistencies, or redundancies in product information. The requirements architecture, as defined in the analysis approach, will help determine which models are best to use together. Models can be collectively used to help complete one another. For example, a model that shows the steps people take to perform a task, like process flows, can be compared to organizational charts to ensure that all stakeholders are covered in some process flow and all people who perform steps are covered in organizational charts.
- Traceability matrix. A traceability matrix is a table that connects or traces links between items. Most commonly, business analysts use traceability matrices to trace requirements backward to features and business objectives or forward to code or other development artifacts or test cases. However, during the Create and Analyze Models process, the business analyst can repurpose the traceability matrix to analyze models to ensure that they are complete.
Common comparisons to make between models and elements of models include:
- Features in a feature model to features in a business objectives model,
- Process flows to features in a feature model that provide functionality,
- Display-action-response models to steps in user interface flows or process flows,
- Data items in the data flow diagram to objects in an entity relationship diagram,
- System interface tables to systems in an ecosystem map, and
- Transitions in state tables or state diagrams to process flows.
Figure 7-16 shows a sample format of using a traceability matrix to map a few requirements objects to do modeling elaboration. For more information on a traceability matrix, see Section 8.2.2.5. Although traceability matrices can be used to systematically compare some models, models can also be similarly compared to one another less formally, even manually by looking at models side by side.

- Interaction matrix.An interaction matrix is a lightweight version of a traceability matrix that is used to figure out whether requirements are sufficiently detailed or if any entities are missing. The main difference between the two types of traceability matrices is that an interaction matrix represents a specific point in time. As a result, interaction matrices are not maintained and are simply used to evaluate requirements at any given time during a project.
In an interaction matrix, the rows are one type of product information, typically in the form of use cases, user stories, or process flows. The columns of the matrix are the names of a different type of product information, such as a data entity, business rule, or user interface. The matrix is populated by placing an X in the box where the row product information uses the column product information or entity. Figure 7-17 shows a sample format of using an interaction matrix to map a few process flows to entities.
- CRUD matrix.CRUD, defined as create (C), read (R), update (U), and delete (D), represents the operations that can be applied to data or objects. CRUD matrices describe who or what has permission to perform each of the CRUD operations on elements, such as data or user interface screens.

7.2.2.11 ORGANIZATIONAL CHART
An organizational chart, or org chart, is a scope model that shows the reporting structure within an organization or within a part of an organization. Org charts used during analysis might vary from those used in stakeholder analysis. An org chart is used to help identify who might use or be impacted by a solution, not necessarily just those working closely with the portfolio, program, or project. For analysis purposes, org charts might describe departments across the organization, roles within those departments, or individuals in the reporting structure. Org charts are used in conjunction with other models to ensure that all stakeholders who perform process steps, interact with systems, or use data in the solution are identified. Org charts can also help when looking to identify users or groups of users that have security and permissions requirements.
An org chart is created early and updated throughout so that any missing stakeholders or stakeholder groups can be identified for elicitation purposes. Figure 7-18 shows a sample format of an organizational chart. For more information on organizational charts, see Section 5.1.2.3.

7.2.2.12 PROCESS FLOWS
Process flows are in the process model category and are used to visually document the steps or tasks that people perform in their jobs or when they interact with a solution. Typically, process flows describe the steps that people take, although they may describe system steps and could be called system flows. Other names for process flows are swim lane diagrams, process maps, process diagrams, or process flow charts. Process flows can be organized into multiple levels, where a Level 1 (L1) process flow would show an entire end-to-end process at a high level in seven to ten steps. The steps in an L1 process flow are decomposed into the next level of processes that the user would perform and represented as Level 2 (L2) process flows. Process flows might be created as both as-is and to-be representations of the business processes so that the changes or enhancements to current solutions can be shown visually. The process flows might be accompanied by additional details to ensure that stakeholders can understand what occurs with each step.
Value stream maps are a variation of process flows. In addition to information in a traditional process flow, a value stream map shows any delays, queues, or handoffs that occur during the process. The purpose of a value stream map is to identify any time spent in the process that does not add value so it can be streamlined.
Activity diagrams are another version of process flows that can be used for general workflow modeling, but commonly are used to visually show the complex flow of use cases. They are similar to process flows in syntax, but they commonly show user and system interactions in one diagram and mirror the textual description of use cases.
Sequence diagrams are another model that describes how user or system processes interact with one another across any involved users or systems and the order in which the processes or steps are performed. Sequence diagrams are most useful for communicating with technical teams about the flow of information between systems, the delegation of functionality to where it will be performed, and the flow of control from step to step. They are particularly helpful in determining which business objects are needed by showing where the information flows.
Process flows can be created to show how programs or projects can improve processes before projects start and are also created after a project has begun, and continue to be created as product information is progressively elaborated. Figure 7-19 shows a process flow sample format indicative of the level of detail in an L2 process. Process flows are further discussed and an example is provided in Section 4.10.8.1 of Business Analysis for Practitioners: A Practice Guide.

7.2.2.13 PROTOTYPES, WIREFRAMES, AND DISPLAY-ACTION-RESPONSE MODELS
Prototypes, wireframes, and display-action-response models are all interface models. A prototype is a representation of the expected solution before it is built. Prototypes can be low fidelity, such as a sketch of a screen layout, or high fidelity, such as an interactive user interface. A wireframe is a type of prototype, specifically a mockup of a user interface design, used to show what a screen should look like. A wireframe can be low fidelity, like a sketch, or high fidelity, like an actual representation of what the final user interface should look like. A display-action-response model uses a tabular format to describe page elements and the functions attached to each. A display-action-response model is always used in conjunction with a prototype or wireframe to connect the user interface element requirements to a visual representation.
User interface design might be completed by a user experience expert or user interface analyst. However, business analysis is used to determine how the user interfaces should display and behave in different states of the solution, work together, and interact with underlying business logic.
Prototypes and wireframes, particularly low-fidelity versions, might be created just before the screens are constructed, or all of them could be specified in the middle of an analysis phase. Display-action-response models are generally created at the point that functional requirements or acceptance criteria are being specified. Figure 7-20 shows a sample format of a wireframe and Figure 7-21 shows a sample format of a display-action-response model. For more information on prototypes and how they can be used in context outside of user interface analysis, see Section 6.3.2.8. Wireframes and display-action-response models are further discussed and an example of each is provided in Section 4.10.11.4 of Business Analysis for Practitioners: A Practice Guide.


7.2.2.14 REPORT TABLE
A report table is an interface model that describes detailed requirements for a single report. Report tables contain both information about the report as a whole, such as the report name or decisions made from the report, and field-level information, such as which data fields are displayed and any calculations. A report table typically accompanies a prototype of a report to show implementation teams what the report should look like. See Section 7.2.2.13 for more information on how prototypes are used during analysis.
Report tables are usually created any time after an initial list of reports for a solution has been identified and prioritized. Report tables are created for the highest-priority reports first. Figure 7-22 shows a sample format of a report table. Report tables are further discussed and an example is provided in Section 4.10.11.1 of Business Analysis for Practitioners: A Practice Guide.

7.2.2.15 STATE TABLE AND STATE DIAGRAM
The state table and state diagram are data models that show the valid states of an object and any allowed transitions between those states. Objects can be business data items or any piece of information of interest when analyzing a solution. Both models describe all the states within a solution that a single object can hold, as well as how the object transitions between states. State tables model all states as both a column and a row in a table that allows a business analyst to systematically consider each potential state transition (from row to column) to determine if the transition should be allowed or is not capable of being transitioned to from other states. State diagrams, on the other hand, visually depict the states and transitions, but only show valid transitions for the object.
State tables and state diagrams are especially useful for solutions involving workflows, and can help with the discovery of business rules that relate to an object moving from one state to another. State tables are most commonly used for analysis to ensure that all transitions are covered, while state diagrams are easier for stakeholders to visualize the valid transition flow. Figure 7-23 shows a sample format of a state table and Figure 7-24 shows a sample format of a state diagram. State tables and state diagrams are further discussed and an example of each is provided in Section 4.10.10.4 of Business Analysis for Practitioners: A Practice Guide.


7.2.2.16 STORY MAPPING
Story mapping is a technique used to sequence user stories, based upon their business value and the order in which their users typically perform them, so that teams can arrive at a shared understanding of what will be built. Story maps help break capabilities down into user stories and can be used to identify gaps in the users' capabilities.
Story maps include two foundational parts: the backbone and the walking skeleton. The backbone is the minimum set of capabilities that absolutely have to be in the first release for the solution to serve its purpose. That set of capabilities is sometimes called the minimum viable product (MVP). The capabilities are often described as features, epics, or user stories. The walking skeleton is the full set of end-to-end functionality that the stakeholders require for the solution to be accepted or considered functional. This set is usually described by a set of user stories and is sometimes called the minimum marketable features (MMF). Individual additional user stories are added below related user stories in the walking skeleton to make up the vertical groupings. The stories are ranked in order of highest business value at the top to lowest business value at the bottom. Figure 7-25 shows a sample format of a story map. For more information on how story mapping is also used to prioritize user stories to help ensure value is being delivered, see Section 7.7.2.6.

7.2.2.17 SYSTEM INTERFACE TABLE
A system interface table is an interface model that captures all the detailed level requirements for a single system interface. System interface tables are created for each system that interfaces to the solution system. System interface tables include information such as the data fields passed from one system to another, the frequency and volume of the data passed, and any validation rules needed to ensure that the data are passed and stored correctly.
System interface tables are usually created after the ecosystem map and context diagram have been created to identify the interfaces. Their format is conducive to representing interface-related requirements and acceptance criteria. Figure 7-26 shows a sample format of a system interface table. System interface tables are further discussed and an example is provided in Section 4.10.11.2 of Business Analysis for Practitioners: A Practice Guide.

7.2.2.18 USE CASE DIAGRAM
A use case diagram is a scope model that shows all the in-scope use cases for a solution. Creating use case diagrams involves identifying a list of both the users of the solution and the possible scenarios of how each user will use the solution. The use case diagram relates the users to relevant use cases and identifies which ones are in or out of scope for a given solution. For more information on use cases, see Section 7.3.2.8.
Use case diagrams are created early in a portfolio, program, or project and updated as use cases change or are added or cut from scope based on prioritization. Figure 7-27 shows a sample format of a use case diagram. Use case diagrams are further discussed and an example is provided in Section 4.10.7.5 of Business Analysis for Practitioners: A Practice Guide.

7.2.2.19 USER INTERFACE FLOW
A user interface flow is an interface model that displays specific user interfaces and commonly used screens within a functional design and plots out how to navigate between them. They can accompany process flows or use cases to help visually show the users' interactions with the system for a scenario.
User interface flows are typically created after process flows and use cases to ensure that the navigation of the user interface in the system makes sense and is correct. Figure 7-28 shows a sample format of a user interface flow. User interface flows are further discussed and an example is provided in Section 4.10.11.3 of Business Analysis for Practitioners: A Practice Guide.

7.2.3 CREATE AND ANALYZE MODELS: OUTPUTS
7.2.3.1 ANALYSIS MODELS
Analysis models are visual representations of product information. The analysis models might be draft or fully completed models. They might be high-fidelity, semantically correct representations or low-fidelity sketches. Throughout the course of a portfolio, program, or project, it is likely that models from every category will be created, but not all types of models will be needed. Analysis models reflect the total sum of all the models created, even though they might not be created at the same time. Analysis models show the solution from multiple facets and allow the business analyst to identify gaps in the models or requirements.
7.2.4 CREATE AND ANALYZE MODELS: TAILORING CONSIDERATIONS
Adaptive and predictive tailoring considerations for Create and Analyze Models are described in Table 7-3.
Table 7-3. Adaptive and Predictive Tailoring for Create and Analyze Models
| Aspects to Be Tailored | Typical Adaptive Considerations | Typical Predictive Considerations |
| Name | Not a formally named process; performed as part of Backlog Refinement or Elaboration | Create and Analyze Models |
| Approach | Scope models and high-level process models are created and analyzed as part of scoping efforts, before a project starts or in an early iteration. Process, rule, data, and interface models are created and analyzed as needed to support identifying or elaborating user stories. All models can be refined as needed at any point in any iteration. The entire team might whiteboard the models together. | Models are created and analyzed early during an analysis phase. Scope models are typically created first and other models later as product information is elaborated. Models are fairly well refined and approved before design work begins. |
| Deliverables | Models might not follow formal syntax, might not be fully fleshed out, might be informally created as hand-drawn sketches, or can be created and stored in a tool. | Models might follow formal syntax and be complete. They are often maintained in a modeling tool. |
7.2.5 CREATE AND ANALYZE MODELS—COLLABORATION POINT
Any of the analysis models might be created or analyzed with any project team member. In particular, the design and implementation team members might provide detailed knowledge that is helpful in creating data and interface models. Design teams may also be recipients of models to provide context to their work and can also alert the product team to current business or technical constraints and opportunities while modeling is conducted.
7.3 DEFINE AND ELABORATE REQUIREMENTS
Define and Elaborate Requirements is the process of refining and documenting requirements and other types of product information at the appropriate level of detail, format, and level of formality required for various audiences. The key benefits of this process are that it (a) helps clarify details about the product information so the team can work from it effectively, and (b) stores the product information in a manner that can be accessed and processed by all stakeholders. The inputs, tools and techniques, and outputs of the process are depicted in Figure 7-29. Figure 7-30 depicts the data flow diagram for the process.


The process to define and elaborate requirements is complex, thorough, and often the one that business analysts are best known for performing. This process entails understanding and analyzing information discovered during elicitation, model analysis, and relationship and dependency analysis to identify and write the requirements. This process is performed at different times to identify business, stakeholder, solution, and transition requirements on portfolios, programs, and projects. Typically, there is more definition and elaboration performed on programs and projects than on portfolios. In an adaptive approach, this process may be performed to define and elaborate user stories as the format for any of those requirement types. The analysis performed in this process also enables the definition of the requirements' attribute values. In all cases, this process also leads to the creation of the supporting product information, including assumptions, constraints, dependencies, related issues, and product risks.
The Define and Elaborate Requirements process is performed iteratively. Identifying and specifying requirements of any type can highlight relationships, dependencies, or gaps in the information that requires additional elicitation or analysis on models. Similarly, other processes might be performed concurrently with this process, such as Verify Requirements (Section 7.5), Validate Requirements (Section 7.6), Prioritize Requirements and Other Product Information (Section 7.7), and Identify and Analyze Product Risks (Section 7.8). It also might be appropriate to define acceptance criteria at the same time as defining user stories or requirements, so Define Acceptance Criteria (Section 7.4) could be performed in conjunction with this process.
Performing the Define and Elaborate Requirements process, often repeatedly, eventually leads to a reasonably complete set of requirements at whatever level is needed for the project life cycle. In some cases, this analysis results in fleshed-out user stories, and other times, it results in fully detailed functional requirements.
Defining and elaborating requirements includes defining all types of product information, not just requirements. This product information commonly includes the following:
- Assumptions. Any factors about the business problems, business objectives, requirements, design, or solution that are considered true without proof or demonstration. At any point, assumptions could become false, so they should be tracked to accommodate the impact of disproving them. Assumptions may also be proven to be true, in which case they are no longer assumptions and can be removed from the list.
- Constraints. Limiting factors that affect the execution of a portfolio, program, project, or process. In business analysis, constraints are factors that affect the development or implementation of the solution. Business rules are one type of constraint.
- Dependencies. Any product information that requirements are contingent on, supported by, or controlled by. They are further described in Section 8.2.
- Issues. Topics in question or under discussion about the requirements or other product information. Issues are documented and tracked through to their resolution, which is often required before requirements are complete.
- Product risks. Uncertain events or conditions that, if they occur, have positive or negative effects on the product. See Section 7.8 for more information on risk analysis. Risk analysis activities might be performed in conjunction with this process.
The total culmination of all product information forms what is called a requirements package. A requirements package does not have to be, and often is not, a formal document. It could be user stories and related information stored and evolving in a backlog. The package could also include requirements and related information stored in a requirements management tool or other repository. The formality and level of detail in the requirements package is defined by the project life cycle and what the stakeholders need to perform their tasks, both of which are determined during planning activities.
7.3.1 DEFINE AND ELABORATE REQUIREMENTS: INPUTS
7.3.1.1 ANALYSIS APPROACH
Described in Section 7.1.3.1. The analysis approach defines how analysis will be performed for the portfolio, program, or project. Included in the analysis approach is a decision about the types of requirements to be elaborated for the project life cycle and how the requirements and other product information will be stored. It also describes the requirements attributes that need to be captured during the Define and Elaborate Requirements process.
7.3.1.2 ANALYSIS MODELS
Described in Section 7.2.3.1. Analysis models are the cumulative set of draft or final models produced by the iterative analysis process. The analysis models are used to derive and elaborate the requirements by helping identify requirements at any level and by finding gaps, redundancies, and errors in the requirements. Additionally, some analysis models help define the attributes of requirements. Each analysis model can help derive requirements in different ways. Examples of how individual models are related to requirements are discussed in Section 4 of Business Analysis for Practitioners: A Practice Guide.
7.3.1.3 CONFIRMED ELICITATION RESULTS
Described in Section 6.4.3.1. Confirmed elicitation results include notes, ideas of requirements, and other outputs from the elicitation conducted. Confirmed elicitation results signify that the product team has reached a common understanding about the elicitation results and agrees to the accuracy of the information elicited. These results are a common starting point for identifying draft requirements because many were likely described by subject matter experts (SMEs) or found in elicitation source materials during the elicitation activities. However, even though elicitation results were provided by customers, SMEs, and other knowledgeable stakeholders, they are not the final requirements without additional analysis. The elicitation results are used in conjunction with the analysis models to ensure that the entire solution is fully analyzed to avoid missing, inconsistent, or conflicting requirements.
7.3.1.4 RELATIONSHIPS AND DEPENDENCIES
Described in Section 8.2.3.1. Relationships and dependencies define the links between requirements. Relationships can be parent to child, as requirements are progressively elaborated from a high level to a low level of detail, or they can be dependency relationships such as implementation, benefit, or value. Although relationships and dependencies help identify requirements or elaborate attributes, a business analyst might identify additional relationships and dependencies during this process and need to perform the process in Section 8.2 (Establish Relationships and Dependencies) concurrently.
7.3.1.5 STAKEHOLDER ENGAGEMENT AND COMMUNICATION APPROACH
Described in Section 5.3.3.1. The stakeholder engagement and communication approach summarizes all the agreements for governing how stakeholders will be engaged and communicated with across the portfolio, program, or project. This approach defines who will consume the requirements, the proposed mechanism of communication with those stakeholders, and the plan to structure and store the requirements. The approach supports efficient interaction of the business analyst with stakeholders because stakeholder expectations with regard to requirements and communication are considered and followed, although doing so often requires elicitation to be performed again. Because this approach describes the plan for structuring and storing the requirements, it is used to decide the level of formality, level of detail, and form of the deliverables or requirements package.
7.3.2 DEFINE AND ELABORATE REQUIREMENTS: TOOLS AND TECHNIQUES
7.3.2.1 BUSINESS RULES CATALOG
A business rules catalog, a type of rule model, is a table of business rules and related attributes. Business rules are not processes or procedures; rather, they describe how to constrain or support behaviors within the operations of the business. Business rules are important to understand because they will need to be implemented or enforced by the solution. Business stakeholders may often want or need to change business rules to support business operations, so business rules provide justification for creating a highly configurable design.
The business rules catalog is created and updated at any point that business rules are identified. Figure 7-31 shows a sample format of a business rules catalog. Any given portfolio, program, or project might track different attributes about business rules, so this is just one example of a few commonly chosen attributes. Business rule catalogs can also show mappings from each rule to related processes that enforce the rule or data models that apply the rules. Business rule catalogs are further discussed and an example is provided in Section 4.10.9.1 of Business Analysis for Practitioners: A Practice Guide.

7.3.2.2 DEFINITION OF READY
The definition of ready is a series of conditions that the entire team agrees to complete before a user story is considered sufficiently understood so that work can begin to construct it. The definition of ready helps the project team know that the user story is sufficiently elaborated and ready to be brought into an iteration, designed, constructed, and delivered. For more information on the definition of done to describe when an item is complete, see Section 7.4.2.2.
7.3.2.3 GLOSSARY
The glossary is a list of all definitions for terms and acronyms about a product. Glossaries include terms that may be unfamiliar to an organization and terms that an organization defines differently from its industry. A glossary ensures that the entire team is aligned as to how specific terms will be used, any synonymous terms, and what various acronyms mean. While defining and elaborating requirements, the business analyst makes sure that all requirements use terminology as defined in the glossary and keeps the glossary up to date as new information is identified. Product teams may choose to develop one glossary that is shared across the entire portfolio, program, or project.
7.3.2.4 PRODUCT BACKLOG
The product backlog is the list of all product backlog items, typically user stories, requirements, or features, that need to be delivered for a solution. Most often, the items in a backlog are written as user stories, describing the functionality that the business or customer wants to see in the final product. The items can be requirements for the solution to be built, as well as any issues or defects that have to be resolved from previous iterations. Projects that utilize adaptive approaches use the product backlog as part of the requirements package.
The product backlog can be stored in a requirements management tool or spreadsheet, or may simply reside in a list and be tacked to a wall. The items in the product backlog are ranked in order of business value or importance to the customer and are continuously updated throughout a product's life cycle or a project's duration.
As new backlog items are added, the product backlog should be repeatedly refined. The acronym DEEP describes the characteristics that a product backlog needs to demonstrate to be considered well refined. DEEP stands for detailed appropriately, estimated, emergent, and prioritized:
- Detailed appropriately. The level of detail to describe a user story is dependent on the story's priority. The higher the priority, the more detailed the story needs to be. A product backlog is detailed appropriately when the highest-priority stories contain the most detail as compared to the lowest-priority items. Prioritizing which user stories have more detail specified will ensure that the items likely to be worked on in the next iteration are ready when needed.
- Estimated. The items in a product backlog should all be estimated. The higher-priority items should have more precise estimates than lower-priority items. Estimates might be expressed in story points or units of time to complete the work. All items should have a rough estimate at minimum to help prioritize and track progress.
- Emergent. Product backlogs are a constantly changing list of product backlog items. As inputs change, new information is discovered, or priorities change, product backlog items might be added, adjusted, removed, or reprioritized within a product backlog.
- Prioritized. All items within a product backlog should be prioritized in a rank-ordered manner, with the highest-priority items being at the top. As the priority of items changes, the backlog is reordered to reflect those changes. As items are added or removed, prioritization is adjusted as necessary to accommodate the newly added items.
For more information on backlog management, see Section 7.7.2.1. Product backlogs are further discussed in Section 4.11.10 of Business Analysis for Practitioners: A Practice Guide.
7.3.2.5 REQUIREMENTS MANAGEMENT TOOL
A requirements management tool allows requirements and other product information to be captured and stored in a repository. When defining and elaborating requirements, the requirements are often stored in a requirements management tool, including a status, any known attribute values, and related models. A requirements management tool might serve as the repository for the contents of a requirements package, depending on the project life cycle approach. For more information on requirements management tools, see Section 8.2.2.2.
7.3.2.6 STORY ELABORATION
Story elaboration is the process by which user stories are further detailed with additional information until they are ready for development. Story elaboration is known as backlog refinement. In adaptive approaches, user stories are at a higher level of detail than functional and nonfunctional requirements. Story elaboration is the technique used to add additional details to each story before construction of the solution. User stories are commonly treated as a promise to have a conversation about the details, rather than as rigorous requirement statements. Story elaboration can occur verbally, with very few details of the conversation being documented, as long as the knowledge is transferred to those team members who need to understand it. For more information on story elaboration, see Section 7.4.2.3.
7.3.2.7 STORY SLICING
Story slicing is a technique used to split epics or user stories from a higher level to a lower level. An epic, user story, or requirement could be split in a variety of ways, including by type of interface, user or persona, functionality, data, business rules, constraints, or any combination thereof. Whichever mechanism is used to decide how to slice the user stories, the slices are then prioritized by the value that each slice delivers. In predictive approaches, creating multiple scenarios from a broad requirement is similar to story slicing.
The reason to split stories is that sometimes stories are too big to construct in an iteration. Large stories are commonly called epics. The epics are sliced into smaller increments of value as determined by the user and are of a size that can be constructed within one iteration. Occasionally, it is necessary to reverse this thinking and take stories to a higher level of detail to ensure that the story achieves the users' goals.
There are many ways to decide how to slice stories. The different scenarios covered in one story, such as a common path and alternative paths, may each be covered by its own story, once sliced. Sometimes, parts of stories are separated out if they are more complex, riskier, or deliver higher business value than other parts. Doing so allows the implementation team to focus on those complex, high-risk, or higher-value areas separately and early.
7.3.2.8 USE CASE
A use case is a process model that uses textual narrative to describe the system-user interactions to achieve successful completion of a goal. The goal represents what the primary actor is trying to accomplish in the use case and usually is part of the use case name. Each use case contains a normal flow, which is the most common scenario of interactions between the system and user, as well as alternative and exception flows, where the scenario diverges from the normal flow. This model is frequently used to identify and elaborate requirements, especially when moving from business requirements to stakeholder requirements or solution requirements.
Use cases are typically created after process flows to provide additional details for specific steps in the process flows, particularly if there are complex interactions between users and systems. Use cases might also be created instead of process flows. They are used to identify the functional or nonfunctional requirements or acceptance criteria. Use cases can be used as the form to represent solution requirements. Figure 7-32 shows a sample format of a use case. Use cases are further discussed and an example is provided in Section 4.10.8.2 of Business Analysis for Practitioners: A Practice Guide.

7.3.2.9 USER STORY
User stories are a method to document stakeholder requirements from the users' point of view with a focus on the value or benefit achieved by the user with the completion of that story. User stories help bridge from business requirements to solution requirements.
User stories can be used to map requirements or acceptance criteria back to process models that reflect overall business user tasks. In adaptive approaches, user stories are commonly the method used to represent requirements. A user story may contain many requirements. Acceptance criteria typically capture more details about the users' needs and are further described in Section 7.4. Figure 7-33 shows a sample format of a user story and acceptance criteria. User stories are further discussed and an example is provided in Section 4.10.8.3 of Business Analysis for Practitioners: A Practice Guide.

7.3.3 DEFINE AND ELABORATE REQUIREMENTS: OUTPUTS
7.3.3.1 REQUIREMENTS AND OTHER PRODUCT INFORMATION
The output of Define and Elaborate Requirements is the requirements themselves. These requirements can be of any type: business, stakeholder, solution, or transition. The requirements can be stored in any type of repository, such as a backlog, document, or a requirements management tool. In addition to requirements, other product information that is documented as part of this process includes assumptions, dependencies, constraints, issues, and risks. For more information on risks, see Section 7.8.
7.3.4 DEFINE AND ELABORATE REQUIREMENTS: TAILORING CONSIDERATIONS
Adaptive and predictive tailoring considerations for Define and Elaborate Requirements are described in Table 7-4.
Table 7-4. Adaptive and Predictive Tailoring for Define and Elaborate Requirements
| Aspects to Be Tailored | Typical Adaptive Considerations | Typical Predictive Considerations |
| Name | User Story Definition, Story Refinement, Backlog Refinement, or Elaboration | Define and Elaborate Requirements or Specify Requirements |
| Approach | Requirements are represented as a combination of user stories and acceptance criteria in a product backlog. Although anyone can write a user story, the product owner decides whether and where to place the story in the backlog. User stories may be identified in a user story writing workshop, so elicitation and user story definition occur concurrently. User stories are progressively elaborated via backlog refinement sessions. User stories evolve within a product backlog because new stories can be added at any time, prioritization might change story order, and just-in-time elaboration will provide additional details. | Significant portions of elicitation might be completed before requirements are specified, though the two activities will typically be iterative with each other. Individual requirement statements, business rules, and use cases are written based on elicitation results and analysis of the models. Requirements are typically written at three levels: business, stakeholder, and solution requirements. Drafted requirements are reviewed with stakeholders and are refined or elaborated based on the feedback. |
| Deliverables | Deliverables are created using the principle of lightweight documentation and stored in a backlog. User stories or product backlog items need to meet the definition of ready. | Completed requirements are delivered in a document or requirements management tool. |
7.3.5 DEFINE AND ELABORATE REQUIREMENTS: COLLABORATION POINT
Portfolio, program, or project managers might participate in discovering business requirements and typically own defining project requirements. Business analysts are responsible for eliciting and documenting the business requirements with other stakeholders and may be asked to support the project manager in eliciting and documenting project requirements.
7.4 DEFINE ACCEPTANCE CRITERIA
Define Acceptance Criteria is the process of obtaining agreement as to what would constitute proof that one or more aspects of a solution have been developed successfully. The key benefit of this process is that it provides complementary insights that can help refine requirements while providing the basis of a shared understanding for what is to be delivered. The inputs, tools and techniques, and outputs of the process are depicted in Figure 7-34. Figure 7-35 depicts the data flow diagram for the process.


Acceptance criteria are the conditions that need to be met before a solution is accepted. They are used to measure whether a customer is satisfied with the solution built. Acceptance criteria form the basis of acceptance tests and are important in evaluating the solution during product review sessions, where product owners or business stakeholders decide whether to accept and release the developed solution. Determining the acceptance criteria involves reviewing requirements and analysis models with business stakeholders to identify how the business stakeholder would approve something as done.
Acceptance criteria can be created at different levels, including requirement, iteration, release, and product levels. In adaptive approaches, acceptance criteria might be written at the level of a user story, where multiple acceptance criteria need to be met for the user story to be accepted. Also in adaptive approaches, acceptance criteria are a succinct way to write requirements. Acceptance criteria can be written at the level of the overall solution or business objectives. Acceptance criteria defined as part of a portfolio or program are likely to be high level and related to the desired overarching objectives. As described in Section 6.5.3 of Business Analysis for Practitioners: A Practice Guide, acceptance criteria might be set based on the goals, objectives, key performance indicators, project metrics, customer metrics, sales and marketing metrics, or operational metrics.
Often, the acceptance criteria in adaptive approaches follow a behavior-driven development format, as described in Section 7.4.2.1, but they can follow any format that both the stakeholders and the developers agree upon. In all cases, acceptance criteria are used in Section 9.3 (Evaluate Acceptance Results and Address Defects) whenever it is performed, dependent on the project life cycle.
7.4.1 DEFINE ACCEPTANCE CRITERIA: INPUTS
7.4.1.1 ANALYSIS APPROACH
Described in Section 7.1.3.1. The analysis approach defines how analysis will be performed for the portfolio, program, or project. Included in the analysis approach is a decision about how and when in the project life cycle the acceptance criteria will be defined. The analysis approach describes how acceptance criteria will relate to user stories, requirements, releases, and solution definitions of acceptance and the level at which they are written.
7.4.1.2 ANALYSIS MODELS
Described in Section 7.2.3.1. Analysis models are the culmination of creating and analyzing draft or final models. The models in any state can be used to elaborate the requirements or user stories to identify acceptance criteria. This iterative derivation process is similar to using analysis models to identify requirements, as described in Section 7.3. In some cases, the acceptance criteria will be defined in analysis models. Some models, such as the business objectives model, can be used to define acceptance criteria at the product level.
7.4.1.3 REQUIREMENTS AND OTHER PRODUCT INFORMATION
Described in Section 7.3.3.1. Requirements and other product information are a starting point to define the acceptance criteria. This input is useful, whether it is used for writing acceptance criteria based on user stories, requirements, or business objectives. Stakeholders use this input to decide whether to accept or reject the solution based on how well it met the requirements.
7.4.1.4 SOLUTION EVALUATION APPROACH
Described in Section 9.2.3.1. The solution evaluation approach defines what types of metrics will be used to measure the performance of a solution. Acceptance criteria are defined to set acceptable ranges on the metrics identified.
7.4.2 DEFINE ACCEPTANCE CRITERIA: TOOLS AND TECHNIQUES
7.4.2.1 BEHAVIOR-DRIVEN DEVELOPMENT
Behavior-driven development (BDD) is an approach that suggests that the team should begin with understanding how the user will use a product (its behavior), write tests for that behavior, and then construct solutions against the tests. Behavior-driven development encourages a conversation between the user or customer who needs to be satisfied with the solution and those who are implementing the solution. The conversation often leads to examples of real-life scenarios that the team uses to build a shared understanding. This approach is a continuation of test-driven development, which suggests that writing tests first will create better products with fewer defects. While this technique is popular in adaptive approaches, it can be applied in any life cycle approach.
The behavior-driven development approach includes a commonly accepted syntax to write acceptance criteria for user stories, the given-when-then format. The given-when-then format ensures that the business stakeholders should consider the preconditions of the user in the product, the triggers, and how the product should react in these conditions. Acceptance criteria are generally written as “Given <the preconditions>, when <the user does something within the product>, then <the product reaction>.” Alternatively, any format can be used for acceptance criteria as long as the criteria include the preconditions and information necessary to test the criteria, the function being tested, and the expected post conditions or results after the function is being performed.
7.4.2.2 DEFINITION OF DONE
The definition of done (DoD) is a series of conditions that the entire team agrees to complete before an item is considered sufficiently developed to be accepted by the business stakeholders. The definition of done for a user story or iteration helps the project team know that the work is complete so the team can move on to the next user story or iteration. Once an item meets the definition of done criteria, it is marked appropriately in any planning tools, such as project plans, requirements management tools, or kanban boards. Definitions of done can be created at many levels of detail. They can be closely related to acceptance criteria, including using acceptance criteria in the definition of done. They are often defined at the user story level, the iteration level, the release level, and the product level. The definition of done might include items such as:
- Acceptance criteria are met;
- Development, test, and defect standards are conformed to; and
- High-level nonfunctional and usability requirements are met.
Definitions of done are written early in a portfolio, program, or project. The definition of done for any given user story, iteration, release, or solution is usually similar across the product or portfolio of products, or it can be specific to a low-level entity. For example, some user stories might warrant specific definitions of done. Definitions of done can evolve over time. The definition of done, as part of acceptance criteria, is an input to evaluating a solution for release, and therefore, can be used in Section 9.4 (Obtain Solution Acceptance for Release).
7.4.2.3 STORY ELABORATION
Story elaboration is the process by which user stories are supplemented with additional information from conversations with business stakeholders, until they are sufficiently detailed for product development to begin work.
In adaptive approaches, user stories are commonly written at a higher level of detail than functional and nonfunctional requirements, so story elaboration is the technique used to add the extra details for each story so that development teams have enough information to build the solution. Adaptive life cycles explicitly define acceptance criteria with concrete examples as part of the elaboration of a user story. Together, these details establish mutual agreement between business stakeholders and those responsible for developing the solution regarding what is required and how to know that the requirement has been met.
Story elaboration is primarily used in adaptive methodologies because too much information about a user story too early in the project can hinder the development team's ability to negotiate priorities with the business and adapt to changes in the requirements. Design information and customer decisions are only added to the user story “just in time” for development to work on the user story. Story elaboration can take the form of further conversations or writing narratives around the user story, making design decisions, drafting wireframes or other analysis models, writing acceptance criteria, and documenting business rules, issues, constraints, and dependencies.
7.4.3 DEFINE ACCEPTANCE CRITERIA: OUTPUTS
7.4.3.1 ACCEPTANCE CRITERIA
Acceptance criteria are concrete and demonstrable conditions about an item that need to be met for the business stakeholders or customers to accept the item. This output can take the form of lists of acceptance criteria for each user story in an adaptive approach, or may be a list of higher-level acceptance criteria for a release or solution in a predictive approach. Regardless of the level at which they are defined, the acceptance criteria should align to the requirements and other product information because acceptance testing or evaluation of the solution will be based on the acceptance criteria. The definition of done is part of this output. An example of acceptance criteria can be found in Section 4.10.8.3 of Business Analysis for Practitioners: A Practice Guide.
7.4.4 DEFINE ACCEPTANCE CRITERIA: TAILORING CONSIDERATIONS
Adaptive and predictive tailoring considerations for Define Acceptance Criteria are described in Table 7-5.
Table 7-5. Adaptive and Predictive Tailoring for Define Acceptance Criteria
| Aspects to Be Tailored | Typical Adaptive Considerations | Typical Predictive Considerations |
| Name | Define Acceptance Criteria, Backlog Refinement, or Elaboration | Define Acceptance Criteria or Define Evaluation Metrics |
| Approach | Written as part of user stories, typically with more than one acceptance criterion per user story. Often used to define the details from which teams develop and test solutions and are often at the level of solution requirements. They are created, reviewed, and refined throughout all iterations of a project for each user story, just in time for development. | Acceptance criteria are defined and might map to requirements, business objectives, or other success metrics. Acceptance criteria at the requirement level are defined together with requirements or after requirements are defined. They are used to help refine requirements by pointing out any lack of clarity. Acceptance criteria defined at the release or product level are defined early in a project once the goals and objectives are understood. |
| Deliverables | Acceptance criteria are defined and sometimes documented in a tool. | |
7.4.5 DEFINE ACCEPTANCE CRITERIA: COLLABORATION POINT
Quality control team members lend assistance to business analysts to provide an understanding about how acceptance criteria will be evaluated and whether there are any standards that need to be followed when writing acceptance criteria. Quality control team members can also help write acceptance criteria.
7.5 VERIFY REQUIREMENTS
Verify Requirements is the process of checking that requirements are of sufficient quality. The key benefit of this process is that it increases the likelihood that the requirements are stated and/or understood in a way that meets the defined standards for the organization, which, in turn, enables communication of the requirements to all interested parties and contributes to the quality of the final product. The inputs, tools and techniques, and outputs of the process are depicted in Figure 7-36. Figure 7-37 depicts the data flow diagram for the process.


Verification is the process of reviewing the requirements and other product information for errors, conflicts, and adherence to quality standards. Verification also involves evaluating whether requirements and other product information comply with a regulation, specification, or imposed condition. In contrast, validation is the assurance that a product meets the needs of the customer and other identified stakeholders. Validation is covered in Section 7.6. Verification can be conducted iteratively and can be done formally or informally, depending on the techniques used. Requirements and associated analysis models are both verified and validated.
Verification can be performed on product information at the portfolio, program, or project levels. It can be conducted on a single requirement, a single model, or a set of product information. Verification is performed to ensure that the requirements and other product information are constructed properly and that models are clear enough to be used effectively. Verification of nonfunctional requirements or acceptance criteria includes evaluating whether these items are sufficiently measurable. Verification leads to a higher likelihood of success because team members who will implement the requirements are more likely to be able to understand the verified requirements than if they were not verified.
To a certain degree, the author of the materials can do some verification. However, verification is also performed by someone else, such as a business analyst who is not on the project or other members of the project team. The person performing verification reviews the requirements and other product information against any analysis, compliance, or regulatory standards for the organization for accuracy and conformance to the applicable standards. Product information that does not pass the verification step needs to be elaborated or rewritten so that it can be deemed of sufficient quality to continue its life cycle. A measure of quality, in the absence of standards or in addition to them, at a basic level includes evaluating the information for the 3Cs: correct, complete, and consistent. Analysis models can also be verified against syntax or modeling standards.
7.5.1 VERIFY REQUIREMENTS: INPUTS
7.5.1.1 ANALYSIS APPROACH
Described in Section 7.1.3.1. The analysis approach defines how analysis will be performed for the portfolio, program, or project. Included in the analysis approach is a decision about when verification of the product information will be performed. It also describes the verification techniques and which, if any, standards should be used.
7.5.1.2 BUSINESS ANALYSIS ORGANIZATIONAL STANDARDS
Described in Section 2.3. Business analysis organizational standards describe any expected quality characteristics, formatting rules, syntax rules, and requirements structure imposed by the organization on all business analysis deliverables. These standards define what a good requirement or requirements set is and may be based on industry standards. Examples of quality characteristics include feasible, concise, measurable, testable, traceable, unambiguous, precise, consistent, correct, complete, and prioritized. Characteristics of high-quality requirements are described in more detail in Section 4.11.5.1 of Business Analysis for Practitioners: A Practice Guide. Analysis models may be verified against syntax or predefined modeling standards. Verification standards for predictive approaches may also define what level of requirements quality is necessary before proceeding from one phase to another.
7.5.1.3 COMPLIANCE OR REGULATORY STANDARDS
Described in Section 2.2. Compliance or regulatory standards are imposed by external organizations, commonly for reasons related to security, protecting personal information, legal considerations, or safety reasons. Most often, they are government or industry regulations. Some standards take the form of what the documentation for a project should include, while others may list actual requirements that the project has to include in its requirements set. When using external standards as an input, the reviewer needs to ensure that the requirements or documentation produced meets the standards so that the project can pass an external or internal audit.
7.5.1.4 REQUIREMENTS AND OTHER PRODUCT INFORMATION
Described in Section 7.3.3.1. Requirements and other product information accumulated throughout the portfolio, program, or project provide the information for verification. The person performing verification reviews the materials using the appropriate techniques or standards. If the reviewer is someone other than the author, the reviewer provides feedback to the author about any changes that need to be made to the requirements and other product information to make the information clearer or so that it better conforms to the chosen standards.
7.5.2 VERIFY REQUIREMENTS: TOOLS AND TECHNIQUES
7.5.2.1 INVEST
The term INVEST describes the characteristics that user stories need to demonstrate to be considered “good” and “ready” for development in adaptive approaches. This is the primary verification technique used in adaptive approaches. INVEST is an acronym for independent, negotiable, valuable, estimable, small, and testable:
- Independent. The characteristic that breaks as many dependencies between user stories as possible so that any user story can be built by itself in any order by the development team. Adhering to this characteristic facilitates planning because planning can be based purely on value and size, rather than on complex ordering of user stories.
- Negotiable. The characteristic in adaptive methodologies that ensures that too much information is not captured up front, because all user stories and the details surrounding them should be negotiable between the development team and the business stakeholders until a story is accepted for development.
- Valuable. A characteristic where each story has value to the business or the customer and the backlog is ranked based on that value.
- Estimable. The characteristic that balances against the negotiable characteristic to ensure that user stories have enough detail for the development team to provide a rough estimate of size. If the development team cannot size the story, then there is not enough information known and the business analyst needs to elaborate further.
- Small. In the adaptive sense, small means that the story is small enough for the development team to complete it within a single time-boxed iteration.
- Testable. The characteristic that determines whether a story can be finitely tested by a test team and if the customer understands how to accept the final requirement as done. It is usually written in the form of acceptance criteria.
These six characteristics together are a way to assess if the user stories are elaborated sufficiently enough to be taken into an iteration to be worked on. Additional details about the INVEST criteria are described in Section 4.10.8.3 of Business Analysis for Practitioners: A Practice Guide.
7.5.2.2 PEER REVIEWS
Peer reviews involve one or more coworkers reviewing the work completed by the business analyst. Commonly, the peer who performs the review is another business analyst, team lead, or quality control team member. Reviewers focus on reviewing the logic and readability of the requirements, along with adherence to internal organizational standards for quality characteristics, format, and syntax. Peer reviews may not always cover external standards but instead involve looking for internal consistency within the requirements to avoid contradictions, gaps, or faulty logic.
Peer reviews can be either informal or formal. Many times, business analysts will ask for an informal peer review before reviewing requirements with stakeholders to ensure that there are no glaring mistakes or issues that could be raised during stakeholder reviews and validation sessions. Formal peer reviews are typically performed prior to approval and involve either written feedback or verbal feedback during a walkthrough. Written feedback can be tracked in a problem or issue tracking repository. Three common types of peer reviews, in order of least to most formal, are as follows:
- Peer desk check. An informal peer review completed by one or multiple peers simultaneously to look over the materials. Desk checking is a way to review any logic in a set of requirements, analysis models, or other product information, and often involves working through an example to check logic. A peer reviewer walks through an analysis model or set of requirements with an objective eye to catch any issues or inconsistencies. Desk checking is also useful for checking the logic in a set of business rules. This is similar to a developer debugging code as it is written. Peer reviews are further described in Section 4.13.1 of Business Analysis for Practitioners: A Practice Guide.
- Walkthrough. A peer review in which the author of the materials walks the peer reviewers through the authored information. These reviews are often held using an elicitation workshop technique. Feedback is typically given verbally during the session. For more information on walkthroughs, see Section 7.6.2.4.
- Inspection. A formal and rigorous form of review in which practitioners close to the work (usually other business analysts, developers, test team members, or quality team members) inspect the work for completeness, consistency, and conformance to internal and external standards, often referring to a checklist. The inspector uses the checklist and the inspection process to review a set of requirements and provide feedback to the authoring business analyst. Inspections and suggestions for checklists are further detailed in Section 4.13.2 of Business Analysis for Practitioners: A Practice Guide.
7.5.3 VERIFY REQUIREMENTS: OUTPUTS
7.5.3.1 VERIFIED REQUIREMENTS AND OTHER PRODUCT INFORMATION
Verified requirements and other product information include product information that has been evaluated to ensure that it is free from errors and addresses the quality standards to which the information will be held. Verified requirements are not a guarantee that those same requirements address the business needs. The requirements also have to be validated, prioritized, and approved. When requirements and other product information are used as inputs into other processes, the inputs might include product information that has been verified.
7.5.4 VERIFY REQUIREMENTS: TAILORING CONSIDERATIONS
Adaptive and predictive tailoring considerations for Verify Requirements are described in Table 7-6.
Table 7-6. Adaptive and Predictive Tailoring for Verify Requirements
| Aspects to Be Tailored | Typical Adaptive Considerations | Typical Predictive Considerations |
| Name | User Story Reviews, Story Elaboration, or Backlog Refinement | Verify Requirements or Requirements Reviews |
| Approach | User stories and acceptance criteria are checked against the INVEST criteria and any internal or external standards prior to pulling a user story into an iteration. Models can also be verified. The process is performed incrementally, just in time for each user story to be built. | Requirements and analysis models are often formally verified and completed after the requirements have been defined and elaborated. Requirements and models can be validated before, after, or while they are verified. Requirements are verified before being approved. |
| Deliverables | Refined user stories are updated in the backlog. | Reviewed requirements documents with feedback and sometimes audit trails of the documents. |
7.5.5 VERIFY REQUIREMENTS: COLLABORATION POINT
On adaptive projects, all members of the product team can participate in reviewing user stories during backlog refinement and sprint planning. On predictive life cycle projects, business analysts might engage quality control team members to perform verification activities or other business analysts who did not create the materials.
7.6 VALIDATE REQUIREMENTS
Validate Requirements is the process of checking that the requirements meet business goals and objectives. The key benefit of this process is that it minimizes the risks of missing stakeholder expectations or delivering the wrong solution. The inputs, tools and techniques, and outputs of the process are depicted in Figure 7-38. Figure 7-39 depicts the data flow diagram for the process.


Validation is the process of ensuring that all requirements and other product information accurately reflect the intent of the stakeholders and that each requirement aligns to one or more business requirements. While verification ensures that the product information meets the necessary standards and is well written, validation ensures that the right solution is being built.
The main goal of validating the product information is to come to a common understanding with the business stakeholders that the solution will address and support the business goals and objectives of key performance indicators (KPIs). This process is important to avoid a situation in which the solution doesn't meet the business goals and objectives because the business or customer needs were misunderstood. Validation can be performed on product information at the portfolio, program, or project levels.
Validation can be conducted iteratively or on a set of final information all at once. As business goals or objectives change, requirements may need to be updated and revalidated to reflect those changes. If any assumptions about how the requirements or solution will meet the business goals and objectives are proven false, then the requirements may need to change to meet the business goals and objectives. Validation can be conducted on a single requirement, a single model, or on a set of product information. Requirements and associated requirements models are both verified and validated.
Some requirements validation can be performed by the business analyst alone, using appropriate analysis models. This level of validation is primarily performed by mapping requirements and other product information to business objectives to identify gaps, inconsistencies, or duplication. However, most validation requires participation from stakeholders. Stakeholders have to review the requirements and other product information to ensure that the information provided is sufficient to allow the desired solution to be built. Validation can be iterative and may require additional elicitation if new items are identified that need to be elicited, modeled, analyzed, and elaborated.
7.6.1 VALIDATE REQUIREMENTS: INPUTS
7.6.1.1 ACCEPTANCE CRITERIA
Described in Section 7.4.3.1. Acceptance criteria define concrete and demonstrable conditions about an item that have to be met for the business stakeholders or customers to accept the item. An item can be a requirement, iteration, release, or solution. While performing validation activities, acceptance criteria are used to ensure that all requirements and other product information are mapped to the agreed-upon acceptance criteria. If not, the user story, iteration, release, or solution is not on track to be accepted.
Acceptance criteria can be created at different levels, including the requirement, iteration, release, and product levels. Acceptance criteria can be written at the level of the overall product or business objectives. In adaptive approaches, acceptance criteria might be written at the level of a user story, where multiple acceptance criteria need to be met for the user story to be accepted. In adaptive approaches, acceptance criteria provide a succinct way to write the requirements.
7.6.1.2 ANALYSIS APPROACH
Described in Section 7.1.3.1. The analysis approach defines how analysis will be performed for the portfolio, program, or project. Included in the analysis approach is a decision about when validation of the product information will be performed. It also describes which validation techniques are appropriate to use.
7.6.1.3 BUSINESS GOALS AND OBJECTIVES
Described in Section 4.3.3.1. Business goals and objectives define the results the business is expecting a portfolio, program, or project to deliver. Validation involves ensuring that all requirements trace back to the business goals and objectives so what is proposed to be built will actually meet the stated goals and objectives.
7.6.1.4 REQUIREMENTS AND OTHER PRODUCT INFORMATION
Described in Section 7.3.3.1. Requirements and other product information resulting from 7.3 Define and Elaborate Requirements and accumulated throughout the portfolio, program, or project provide the information for validation. The person performing validation reviews the materials and either fixes the issues or provides feedback to the author about any changes that need to be made. Often, this input will change as a result of validation because requirements or product information will be discovered to be missing, unnecessary, or incorrect. Verification and validation can occur concurrently or iteratively as more information is needed or as levels of formality for both validation and verification occur.
7.6.2 VALIDATE REQUIREMENTS: TOOLS AND TECHNIQUES
7.6.2.1 DELPHI
Delphi is a consensus-building method that consolidates anonymous input from subject matter experts (SMEs) using rounds of voting. During Validate Requirements, each SME provides feedback on whether he or she finds the requirements valid and sufficient. The team comes together to discuss the survey results and continues voting until consensus is reached. This method reduces peer pressure or groupthink in the validation process and avoids having the team give in to a voice of authority with which they might disagree. Delphi can be used on requirements or any other product information, such as features, user stories, and acceptance criteria. For more information on Delphi, see Section 8.3.2.4.
7.6.2.2 GOAL MODEL AND BUSINESS OBJECTIVES MODEL
The goal and business objectives models describe the business objectives the solution is meant to achieve, along with the high-level features for the solution. Either model can be helpful for mapping requirements or user stories through features or other models back to business objectives to ensure that requirements are in alignment with business objectives. For more information on the goal model and business objectives model, see Section 7.2.2.9.
7.6.2.3 TRACEABILITY MATRIX
A traceability matrix is a grid that allows for linkages between objects. A traceability matrix can be used to trace requirements to other types of requirements in the hierarchy—for example, from business requirements to solution requirements. It can be used to trace requirements to analysis models or to downstream items such as test cases. During Validate Requirements, a traceability matrix is primarily used to trace the requirements to analysis models and ultimately to the business objectives that each requirement supports. This analysis ensures that each business objective has coverage by the requirements and that each requirement traces directly back to support a business objective. Any requirements that cannot be traced back to business objectives are likely not valid, and can be cut from scope. For more information on the traceability matrix, see Section 8.2.2.5.
7.6.2.4 WALKTHROUGHS
Walkthroughs are used to review the requirements with the stakeholders and to receive confirmation that the requirements as stated are valid. Validated requirements accurately reflect what the stakeholders are asking the development team to build. Walkthroughs entail holding a meeting or meetings to review the requirements as a group, to ensure that there is a common understanding of the requirements and whether they are needed. Typically, a business analyst will send the requirements to the business stakeholders to review individually before the walkthrough takes place. Walkthroughs can be used to review more than just requirements, including analysis models and user stories. Walkthroughs that are specifically focused on reviewing requirements are often called requirements walkthroughs. Requirements walkthroughs are further discussed in Section 4.12.2 of Business Analysis for Practitioners: A Practice Guide.
7.6.3 VALIDATE REQUIREMENTS: OUTPUTS
7.6.3.1 VALIDATED REQUIREMENTS AND OTHER PRODUCT INFORMATION
Validated requirements and other product information include product information that the stakeholders agree meets the business goals and objectives. Validated requirements are not a guarantee that those same requirements are well written and address the standards to which the project will be held. The requirements also have to be verified, prioritized, and approved. When requirements and other product information are used as inputs into other processes, the inputs might include product information that has been validated.
7.6.4 VALIDATE REQUIREMENTS: TAILORING CONSIDERATIONS
Adaptive and predictive tailoring considerations for Validate Requirements are described in Table 7-7.
Table 7-7. Adaptive and Predictive Tailoring for Validate Requirements
| Aspects to Be Tailored | Typical Adaptive Considerations | Typical Predictive Considerations |
| Name | User Story Reviews, Story Elaboration, or Backlog Refinement | Validate Requirements or Requirements Reviews |
| Approach | User stories and acceptance criteria are reviewed in real time with the business stakeholders or during backlog refinement and traced back to the business goals. Models are also validated. This is a continuous activity, because any user stories that are no longer valid should be removed from the product backlog immediately. | Requirements and analysis models are often formally validated. Walkthroughs can be a formal process and are completed after the requirements have been defined and elaborated. Requirements can be validated before, after, or while they are verified. Requirements are often validated before being approved. |
| Deliverables | Refined user stories are updated in the backlog. | Traced requirements. |
7.6.5 VALIDATE REQUIREMENTS: COLLABORATION POINT
Functional managers and subject matter experts (SMEs) participate in validation activities because they will understand if the requirements meet the business goals or objectives and whether the requirements as stated present a true picture of what needs to be built.
7.7 PRIORITIZE REQUIREMENTS AND OTHER PRODUCT INFORMATION
Prioritize Requirements and Other Product Information is the process of understanding how individual pieces of product information achieve stakeholder objectives, and using that information, along with other agreed-upon prioritization factors, to facilitate ranking of the work. The key benefits of this process are that it aligns all stakeholders with how the requirements achieve the goals and objectives and determines how to allocate the requirements to iterations or releases accordingly. The inputs, tools and techniques, and outputs of the process are depicted in Figure 7-40. Figure 7-41 depicts the data flow diagram for the process.


Prioritizing requirements is an important step in managing product scope. Prioritization determines what should be worked on first or next so that business objectives are achieved in an order that best meets the needs of the organization. Prioritization is about focusing on what adds the most value. Product information at any level, from business needs to functional requirements, can be prioritized. Prioritization also supports the allocation of requirements to iterations or releases for release planning purposes. Requirements and other product information, such as issues or defects, are prioritized using factors such as value, cost, difficulty, regulations, and risk. Although business analysis does not typically involve estimating development costs, technical risks, and technical difficulty, these are all things that need to be analyzed to prioritize effectively.
A business analyst might recommend prioritization, but it is necessary for accountable stakeholders who have authority to prioritize requirements to be involved in this process. Business analysts help facilitate and negotiate prioritization decisions. Setting expectations about how prioritization will be performed with stakeholders early in the business analysis process helps minimize situations where stakeholders become unhappy when their requirements are prioritized to the bottom of the list. Negotiation, conflict management, and facilitation skills are used heavily during prioritization discussions.
Prioritization might happen iteratively or all at once on a portfolio, program, or project. The project life cycle influences the prioritization process and often dictates the frequency, timing, and techniques for performing prioritization. For example, the business analysis work to complete processes, use cases, or reports may be prioritized. Once product information such as requirements exists, those items are prioritized for development and testing. A project might initially require prioritization of high-level items such as business objectives, processes, or features, and later of requirements or user stories. A portfolio or program can use techniques similar to those for project prioritization, but the techniques used on portfolios and programs are applied to the prioritization of business objectives and projects or cross-project features and requirements.
Prioritization of any item at any level commonly involves two efforts and they do not have to be sequentially ordered. The first effort is when the business stakeholders, subject matter experts, or product owners prioritize requirements based on their estimated business value. The second effort is to understand the project team's estimates of effort and the risk of each requirement. The business analyst facilitates the prioritization discussions and works with the team to ensure that the high-priority requirements can be completed within the boundaries of the portfolio, program, or project.
Prioritization results are not necessarily final. Prioritization factors can change, and so can requirements. A requirement thought to be a high priority at the beginning of a project may be changed to a lower priority as the project progresses. On the other hand, a stakeholder could elevate the priority of other requirements that were originally thought to be unimportant. The project life cycle will determine how to handle changes in priority. As requirements are added to the product backlog or changes in priority result in the movement of requirements from one release or iteration to another, the changes are tracked and communicated to the appropriate stakeholders. Validation is usually complete before prioritization, but the processes could be performed simultaneously. In adaptive approaches, a list of high-level features might be prioritized initially, and later user stories can be prioritized. In predictive approaches, the full set of requirements will likely be complete and validated before prioritization.
7.7.1 PRIORITIZE REQUIREMENTS AND OTHER PRODUCT INFORMATION: INPUTS
7.7.1.1 ANALYSIS APPROACH
Described in Section 7.1.3.1. The analysis approach defines how analysis will be performed for the portfolio, program, or project. Included in the analysis approach is a decision about the approach for prioritization, including which techniques will be used, when prioritization is performed, and who will participate in and make prioritization decisions.
7.7.1.2 BUSINESS GOALS AND OBJECTIVES
Described in Section 4.3.3.1. Business goals and objectives define what results the business is expecting a portfolio, program, or project to deliver. The desired outcomes specified by the business objectives are the primary consideration in prioritizing which requirements and related work should be completed first. A key purpose of the prioritization process is ensuring that what the team builds actually meets the business goals and objectives.
7.7.1.3 CHANGE REQUESTS
Described in Section 8.4.1.3. Change requests are appeals to make a change to a requirement or other suggestions for changes to product information that are raised by the business stakeholders or project team after a set of requirements is baselined. Change requests are prioritized along with other work, including any undeveloped requirements. Sometimes a change request is of higher priority than existing work. Some change requests may require items to be removed from scope, to accommodate the change.
In adaptive approaches, there may not be a formal change request process. When a stakeholder requests a change, it is typically written in the form of a user story, and added to the backlog. In adaptive approaches, new product backlog items are prioritized against the backlog items that are already present. That reprioritization usually occurs during the planning session for the next iteration.
7.7.1.4 RELATIONSHIPS AND DEPENDENCIES
Described in Section 8.2.3.1. Relationships and dependencies define the links between requirements. Relationships can be parent to child, as requirements are progressively elaborated from a high level to a low level of detail, or they can be dependency relationships such as implementation, benefit, or value. Relationships and dependencies can affect prioritization choices.
7.7.1.5 REQUIREMENTS AND OTHER PRODUCT INFORMATION
Described in Section 7.3.3.1. Requirements and other product information include all the information about a solution and are the culmination of results from elicitation and analysis activities. The requirements and other product information accumulated throughout the portfolio, program, or project comprise the information prioritized.
7.7.2 PRIORITIZE REQUIREMENTS AND OTHER PRODUCT INFORMATION: TOOLS AND TECHNIQUES
7.7.2.1 BACKLOG MANAGEMENT
A product backlog is the list of all the work that needs to be completed to produce the solution. A backlog can contain high-level product information such as projects or features to be managed at a portfolio or program level. Backlog management is primarily used in adaptive approaches to maintain the list of backlog items to be worked on during a project.
Backlog management refers to the process by which the owner of the backlog, commonly a product owner, assists in keeping the backlog up to date. If roles are separate, the business analyst often helps the product owner refine the product backlog, which involves adding and removing backlog items, elaborating backlog items, and reprioritizing based on changing requirements or business conditions and priorities.
The product backlog needs to be organized by priority at all times. The list is ranked in order of business value or importance to the customer and sized by the development team so that the team can pull in the highest-value items that can be delivered over a duration; most commonly, it is based on a time-boxed development iteration. Dependencies and constraints are also taken into account, which might impact the order of the items in the backlog. For more information on product backlog, see Section 7.3.2.4.
7.7.2.2 GOAL MODEL AND BUSINESS OBJECTIVES MODEL
The goal model and business objectives model describe the business objectives that the solution is meant to achieve, along with the high-level features for the solution. Either model can be used as a tool to help prioritize the requirements according to how much they support or achieve the objectives. Any requirements that do not trace back to and support the business objectives can be cut from scope or assigned a low priority. Any remaining in-scope requirements are weighted by how much they help achieve the business objectives. This model can also be used to prioritize programs or projects based on the business objectives each one is expected to deliver. For example, a project might be prioritized over another project if it is expected to deliver a higher net benefit based on the business objectives. For more information on goal models and business objectives models, see Section 7.2.2.9.
7.7.2.3 ITERATION PLANNING
In adaptive approaches, iteration planning or sprint planning is the activity used to identify the subset of product backlog items that the product development team will work on for the current iteration or sprint. The entire team collaborates just before or at the beginning of the iteration to select the backlog items that should be part of an iteration backlog. Business analysis activities ensure that product backlog items are ready to be developed. The business analysis responsibilities entail choosing items for the iteration backlog that are sufficiently elaborated upon and most important in terms of delivering business value.
7.7.2.4 KANBAN BOARD
A kanban board is used in adaptive approaches to track work that is in progress by the project team. It is a visual representation of what work is in progress, whereas the product backlog is the prioritized list of all possible work. The kanban board shows the steps in a workflow, such as the project life cycle phases, and work in progress (WIP) limits for each phase. WIP limits specify how many items (typically user stories or tasks) can be in one workflow step at a time. These limits maximize the productivity of the team by ensuring that it never takes on more work than it can handle. The project team pulls items from the product backlog (usually in priority order) into the kanban board and moves them across each workflow step as each is completed, assuming there is room in the next workflow step. This technique also shows clearly what is or is not complete for any given user story. If bottlenecks emerge, the kanban board and the WIP limits become input into prioritization decisions for work in the product backlog and to manage the progress of items allocated to releases.
7.7.2.5 PRIORITIZATION SCHEMES
Prioritization schemes are different methods used to prioritize portfolio components, programs, projects, requirements, features, or any other product information. The analysis approach identifies which prioritization schemes the team has agreed to use and when. Section 4.11.6.1 of Business Analysis for Practitioners: A Practice Guide provides more information and examples of prioritization schemes. The following are some commonly used schemes:
- Buy a feature. A type of collaborative game used to enable a group of stakeholders to agree on prioritization by providing each stakeholder with an amount of pretend money to buy his or her choice of features, splitting the money received across features, however desired. The features are prioritized by counting the total money spent per feature by all stakeholders. The features that receive the most money from the participants are considered the most valuable and highest-prioritized features. For more information on collaborative games, see Section 6.3.2.2.
- Delphi. A consensus-building technique that conducts a survey to take anonymous input from subject matter experts (SMEs) and consolidates that input through a facilitator. Each round of input is discussed by the team to gain understanding, and then the survey is performed again. In this technique, each stakeholder provides a prioritization for the requirements set using the prioritization scheme chosen, and then the stakeholders meet together to discuss until the group agrees on the prioritization. This method is intended to reduce peer pressure or groupthink in the prioritization process or to avoid the team giving in to a voice of authority with whom they may disagree. For more information on Delphi, see Section 8.3.2.4.
- Minimum viable product (MVP). A prioritization mechanism used to define the scope of the first release of a solution to customers by identifying the fewest number of features or requirements that would constitute a solution from which the customer would obtain value. The minimum viable product may not include the items that bring the most quantifiable value to the business, but rather a set of items that accelerates time to market for solutions by focusing on releasing the fundamental pieces of a product. Additional features are added in future releases that deliver additional business value. The point of using this technique is to realize some business value faster than waiting for a full product to be built and to learn about the product early on to guide future development. Minimum marketable features (MMF) is a related prioritization mechanism in which the smallest piece of functionality that still delivers value to the customer is identified.
- MoSCoW. A technique that categorizes each requirement into one of the following groups:
- Must have (fundamental to solution success),
- Should have (important, but the solution's success does not rely on the requirement),
- Could have (can easily be left out without impacting the solution), or
- Won't have (not delivered this time around).
- Multivoting. A method also called dot voting because it can be performed by providing stakeholders with a prescribed number of colored dots and allowing them to vote by placing their dots on the requirements that they feel are the most important. All votes are aggregated and requirements are ranked by the number of dots/votes received. This method is similar to “buy a feature.” Multivoting is further discussed in Section 4.11.6.1 of Business Analysis for Practitioners: A Practice Guide.
- Purpose alignment model. A technique that provides a framework for categorizing business options by their purpose. It supports aligning business decisions with business purposes. The purpose of each option is identified by considering how mission critical it is and how much competitive advantage each will provide to the organization. While this technique is primarily intended as a basis for making strategic or high-level product decisions, some organizations also use it to analyze and facilitate discussions about product requirements and the value each provides, which, in turn, becomes a springboard for prioritization discussions about product features and requirements. For more information on the purpose alignment model, see Section 4.3.2.9.
- Timeboxing. An estimation or planning technique that can be used during prioritization by setting a strict time limit and prioritizing only the work that the team can complete in that duration of time. Timeboxing is usually used in conjunction with a second prioritization scheme to understand the highest-prioritized requirements to pull into the time-box.
- Weighted ranking. A method that first requires decision criteria to be identified and weighted. Then each item is rated by scoring how well the option meets the criteria independent of other options. Ratings are multiplied by the weights and summed to arrive at the score for each item and the overall rankings. For more information on weighted ranking, see Section 4.4.2.8.
- Weighted shortest job first (WSJF). A method used primarily in adaptive frameworks to rank user stories based on more dimensions than just business value and effort. WSJF works by having business value, time criticality, risk reduction or opportunity enablement, and effort all sized using something similar to a Fibonacci sequence used in estimation poker. A formula is used to calculate a weighted value for each user story:
WSJF = [business value + time criticality + (risk reduction/opportunity enablement)] / effort
7.7.2.6 STORY MAPPING
Story mapping is a technique used to arrange user stories in the order they will likely be developed and released to customers. Story maps help communicate the features and solution components that the product team will be responsible for delivering. The technique supports a product team with release allocation where features or product components are assigned to different product releases. Although it can be used as a prioritization technique by itself, other prioritization techniques can be used to help prioritize the user stories in the story map. This technique is primarily used when following an adaptive delivery approach.
Releases can be shown on a story map as horizontal lines, dividing and grouping functionality based on the capacity of the development team and the release dates. Each horizontal grouping is a release, and each vertical grouping can be thought of as a functional grouping. Figure 7-42 shows a sample format of a story map, with releases labeled. For more information on story mapping, see Section 7.2.2.16.

7.7.2.7 TRACEABILITY MATRIX
The traceability matrix maps requirements backward to analysis models and business objectives and forward to business rules, designs, implementation details, and tests. For prioritization purposes, a traceability matrix can be used to help prioritize requirements using the business objectives to which they are traced. If the business objectives are quantified and ranked accordingly, then the requirements that trace to the highest-value objectives might be the highest-ranked requirements. Any requirements that are not traced to the business objectives are out of scope. For more information on the traceability matrix, see Section 8.2.2.5.
7.7.3 PRIORITIZE REQUIREMENTS AND OTHER PRODUCT INFORMATION: OUTPUTS
7.7.3.1 PRIORITIZED REQUIREMENTS AND OTHER PRODUCT INFORMATION
Prioritized requirements and other product information are a representation of which requirements and other product information the stakeholders agree are most important to address first to achieve the business goals and objectives. The result of prioritization might describe what work should be completed next, or it might be a full ordering of all work, with items allocated to iterations or releases. The prioritization output can take the form of a backlog ordered by business value and risk in adaptive approaches or a prioritization attribute set on each requirement in predictive approaches. Prioritization also indicates which items are of low priority and might be reasonable to cut from scope if change requests come in and are prioritized higher or if the team runs out of time or budget for a release. When requirements and other product information are used as input into other processes, they might include product information that has been prioritized.
7.7.4 PRIORITIZE REQUIREMENTS AND OTHER PRODUCT INFORMATION: TAILORING CONSIDERATIONS
Adaptive and predictive tailoring considerations for Prioritize Requirements and Other Product Information are described in Table 7-8.
Table 7-8. Adaptive and Predictive Tailoring for Prioritize Requirements and Other Product Information
| Aspects to Be Tailored | Typical Adaptive Considerations | Typical Predictive Considerations |
| Name | Backlog Management, Prioritize Backlog, or Backlog Ranking | Prioritize Requirements and Other Product Information |
| Approach | Features or user stories are the most commonly prioritized product information, but any items in the backlog can be prioritized. Product information is continuously prioritized and reprioritized in the product backlog by the product owner or the business analyst. The product backlog is a living prioritized list of requirements, so it needs to always reflect the top priorities of the business. Prioritization techniques are used for each iteration to determine the features to be provided in the next release of the solution. | Features, requirements, and change requests are prioritized commonly after they are verified and validated and either before or after they are approved. Prioritization results are reflected on each requirement in the requirements set. Prioritization occurs before any solution construction begins. Priorities may still shift throughout the project, but incorporating such changes is more difficult than just reordering things, often requiring a change control process to be executed |
| Deliverables | Prioritized backlog, ordered by business value or a combination of business value and business risk. | Each requirement in the requirements set will have a priority based on whatever prioritization scheme was chosen. |
7.7.5 PRIORITIZE REQUIREMENTS AND OTHER PRODUCT INFORMATION: COLLABORATION POINT
Product team members contribute to prioritization efforts by providing the size and risk estimates for building the solution to the specified requirements. Product owners and product managers are typically two of the most influential roles in establishing priorities for the portfolio, program, or project. Product sponsors can set and approve priorities, too, and may be consulted when prioritization efforts do not result in consensus among the team.
7.8 IDENTIFY AND ANALYZE PRODUCT RISKS
Identify and Analyze Product Risks is the process of uncovering and examining assumptions and uncertainties that could positively or negatively affect success in the definition, development, and the expected results of the solution. The key benefits of this process are that it supports proactive management of uncertainties in business analysis activities and it uncovers and proactively addresses areas of potential strengths and weaknesses in the product. The inputs, tools and techniques, and outputs of the process are depicted in Figure 7-43. Figure 7-44 depicts the data flow diagram for the process.


Business analysis supports the portfolio, program, or project risk management processes through the identification and analysis of risks that impact business analysis activities and/or the product, otherwise known as product risks. Product risks are uncertainties that can affect success in definition, development, and expected results of the product or solution. Product risks that have an adverse impact can lead to failures in the product if they are not addressed.
Identifying and analyzing product risks includes the following activities:
- Identifying product risks. Determining risks and documenting their characteristics, which may affect business analysis activities and/or the product.
- Performing qualitative risk analysis. Prioritizing product risks for further analysis or action by assessing and considering their probability of occurrence and impact.
- Performing quantitative risk analysis. Numerically analyzing the effect of identified product risks on the business objectives.
- Planning risk responses. Developing options and actions to address product risks. Product risk responses may include modifying or identifying additional product requirements and/or additional project activities to take advantage of opportunities or address potential failure points. Product risk management thus leads to identifying and proactively resolving gaps in requirements and other product information.
Strategies for negative risks or threats include the following:
- Avoid. Eliminate the threat.
- Transfer. Shift the impact of the threat to a third party.
- Mitigate. Reduce the probability and/or impact of the threat.
- Accept. Acknowledge the threat, but do not take any action unless the risk occurs.
Strategies for positive risks or opportunities include the following:
- Exploit. Ensure that the opportunity is realized.
- Enhance. Increase the probability and/or positive impacts of the opportunity.
- Share. Allocate some or all of the ownership of the opportunity to a third party.
- Accept. Take advantage of the opportunity if it arises, but do not actively pursue it.
- Implementing risk responses. Implementing agreed-upon risk responses.
- Monitoring risks. Monitoring the implementation of agreed-upon risk responses, tracking identified product risks, monitoring residual product risks, identifying new product risks, and evaluating risk process effectiveness.
When identifying and analyzing product risks, consideration is provided to any applicable assumptions, constraints, dependencies, or issues as follows:
- Assumptions. Factors that are considered true, real, or certain, without actual proof or demonstration. There is an element of risk with every assumption that is made. The risk is associated with the event or condition that would occur if the factor turns out not to be true, real, or certain.
- Constraints. Limiting factors that affect the execution of a portfolio, program, project, or process and may be business or technical factors. In business analysis, constraints are limiting factors that affect the development or implementation of the solution. Risks can be identified for situations if limits are reached.
- Dependencies. Logical relationships that exist between two or more entities. Risks can be identified for situations if dependencies are not met.
- Issues. Points or matters in question, in dispute, or not settled and under discussion. If a risk event occurs and the response plan is inadequate, the risk may be converted into an issue. Conversely, new risks may be introduced for unresolved issues.
Converting assumptions, constraints, dependencies, or unresolved issues into risks allows product teams to be more proactive in the management of these items, as risks tend to be analyzed in more frequent intervals.
7.8.1 IDENTIFY AND ANALYZE PRODUCT RISKS: INPUTS
7.8.1.1 ANALYSIS APPROACH
Described in Section 7.1.3.1. The analysis approach defines how analysis will be performed for the portfolio, program, or project. Included in the analysis approach is a decision about how to conduct risk analysis, including details regarding the product risk management process, the risk categories, and how risks will be documented.
7.8.1.2 BUSINESS GOALS AND OBJECTIVES
Described in Section 4.3.3.1. Business goals and objectives identify what the business is expecting a portfolio, program, or project to deliver. Product risks are evaluated and rated on whether and how much they may impact the business goals and objectives. Evaluating assumptions that were made in defining business goals and objectives might also lead to identifying additional risks.
7.8.1.3 ENTERPRISE ENVIRONMENTAL FACTORS (EEFS)
Described in Sections 2.2.1 and 2.2.2. EEFs are conditions that influence, constrain, or direct how business analysis is conducted. Analysis of EEFs can uncover product risk factors, such as when a legal or contractual restriction impacts how business analysis processes are conducted. EEFs also include stakeholder risk appetite, which may influence risk responses.
7.8.1.4 PRODUCT SCOPE
Described in Section 4.6.3.2. Product scope is defined as the features and functions that characterize a solution. Product risks are evaluated and rated on whether and how they may impact the product represented by the product scope statement.
7.8.1.5 REQUIREMENTS AND OTHER PRODUCT INFORMATION
Described in Section 7.3.3.1. Requirements and other product information include all the information about a solution and are the culmination of results from elicitation and analysis activities. Product information can be evaluated to identify product risks. For instance, assessing assumptions, constraints, dependencies, and the requirements may help uncover product risk factors. Product risk responses may trigger modifications or additions to requirements and other product information.
7.8.2 IDENTIFY AND ANALYZE PRODUCT RISKS: TOOLS AND TECHNIQUES
7.8.2.1 CONTEXT DIAGRAM
A context diagram is a scope model that shows all the direct system and human interfaces to systems within a solution. A context diagram clearly depicts the in-scope systems and any inputs or outputs, including the systems or actors providing or receiving them. These models can be used to identify product risks or failure points by analyzing the interfaces. For more information on context diagrams, see Section 7.2.2.1.
7.8.2.2 ECOSYSTEM MAP
An ecosystem map is a scope model that shows all the relevant systems, the relationships between each system, and optionally, any data objects passed between them. A business analyst would use an ecosystem map for product risk analysis in the same way that a context diagram would be used. Ecosystem maps may be used to identify product risks or potential failure points, through analyzing the interfaces and objects passed between the systems. For more information on ecosystem maps, see Section 7.2.2.5.
7.8.2.3 ELICITATION TECHNIQUES
Elicitation techniques are used to draw information from sources. Product risks are uncovered through elicitation; thus, any of the elicitation techniques can be used to identify and analyze product risks. For more information on elicitation techniques, see Section 6.3.2.
7.8.2.4 ESTIMATION TECHNIQUES
Estimation techniques are used to provide a quantitative assessment of likely amounts or outcomes. Various estimation techniques can be used to quantify the probability and impact of product risks. For more information on estimation techniques, see Section 5.4.2.3.
7.8.2.5 ORGANIZATIONAL CHART
Organizational charts are models that depict the reporting structure within an organization or within a part of an organization. These models can be used to identify risks related to stakeholder groups—for example, when there are stakeholder groups identified that may impact business analysis activities. Organizational charts can also be used to identify who should own the product risk response plans. For more information on organizational charts, see Section 5.1.2.3.
7.8.2.6 PROCESS FLOWS
Process flows visually document the steps or tasks that people perform in their jobs or when they interact with a product. These models may be used to identify product risks or potential failure points by analyzing process steps, decision points, and handoffs between different actors in a process. For more information on process flows, see Section 7.2.2.12.
7.8.2.7 PRODUCT BACKLOG
The product backlog is the list of all product backlog items, typically user stories, requirements, or features, that need to be delivered for a solution. Projects that employ adaptive approaches use the product backlog as part of the requirements package. When needed, tasks called spikes or risk spikes can be added to the product backlog to evaluate risks. The items in the product backlog are ranked in order of business value or importance to the customer and are continuously updated throughout a product's life cycle or a project's duration. For more information on the product backlog, see Section 7.3.2.4. For more information on backlog management, see Section 7.7.2.1.
7.8.2.8 RISK BURNDOWN CHART
Burndown charts are used to communicate progress over time. On adaptive projects, risk burndown charts can be used to show the status of risks across iterations. The sum of exposures (probability multiplied by impact) across all product risks is mapped for each iteration. Ideally, the burndown chart should show a downward slope when connecting the data points to indicate that product risk exposures are decreasing as iterations progress. Figure 7-45 shows a sample format of a risk burndown chart. For more information on burndown charts, see Section 5.4.2.1.

7.8.2.9 RISK REGISTER
The risk register is a tool used to support analysis of product risks. Product risks are logged with corresponding details, which may include the following:
- Risk ID. Unique number used to identify the risk.
- Risk description. Textual description of the risk.
- Date logged. Date when the risk was identified.
- Risk owner. Person responsible for monitoring the risk.
- Status. State of the risk—for example, open or closed.
- Updates. Progress information on the risk.
- Impact rating. Numerical rating representing the severity if the risk event were to occur.
- Probability rating. Numerical rating representing the probability of the risk event occurring.
- Exposure. Impact multiplied by probability.
- Trigger. Signs that warn that the risk is about to occur or has already occurred.
- Risk response. Actions that can be taken to proactively address the risk.
- Risk response owner. Person responsible for executing the risk response.
- Workaround. Actions to be performed if the risk were to occur.
The business analyst and portfolio, program, or project manager may opt to produce a consolidated risk register. Risks can be identified during iteration or daily planning.
7.8.2.10 ROOT CAUSE AND OPPORTUNITY ANALYSIS
Root cause analysis is used to determine the basic underlying reason that causes a variance, defect, or risk. Opportunity analysis is used to study the major facets of a potential opportunity to determine the possible changes in products offered to enable its achievement. Root cause and opportunity analysis can be used to develop response plans to proactively address negative product risks or take advantage of potential opportunities. For more information on root cause and opportunity analysis, see Section 4.2.2.9.
7.8.2.11 SWOT ANALYSIS
A SWOT analysis is a technique for analyzing the (S) strengths and (W) weaknesses of an organization, project, or option, and the (O) opportunities and (T) threats that exist externally. SWOT analysis can be used to identify potential product risks in the form of positive risks (opportunities) or negative risks (threats). For more information on SWOT analysis, see Section 4.2.2.10.
7.8.3 IDENTIFY AND ANALYZE PRODUCT RISKS: OUTPUTS
7.8.3.1 PRODUCT RISK ANALYSIS
The product risk analysis includes the consolidated results from identifying and analyzing product risks. The product risk analysis may consist of:
- Identified product risks,
- List of potential responses,
- Relative rating or priority list of risks,
- Symptoms and warning signs,
- Risks requiring responses in the near term,
- Risks for additional analysis and response,
- Trends in qualitative analysis results,
- Total risk exposure, and
- Watch list of low-priority risks.
7.8.4 IDENTIFY AND ANALYZE PRODUCT RISKS: TAILORING CONSIDERATIONS
Adaptive and predictive tailoring considerations for Identify and Analyze Product Risks are described in Table 7-9.
Table 7-9. Adaptive and Predictive Tailoring for Identify and Analyze Product Risks
| Aspects to Be Tailored | Typical Adaptive Considerations | Typical Predictive Considerations |
| Name | Not a formally named process | Identify and Analyze Product Risk |
| Approach | Risks are discussed and addressed in iteration 0, iteration planning, and/or daily stand-ups and considered when determining the value of backlog items. Assumptions, constraints, dependencies, issues, and risks may be discussed at the same time. Teams focus on short iterations that minimize risk. | Integrated with portfolio, program, or project risk management processes that are performed throughout the portfolio, program, or project, respectively. Assumptions, constraints, dependencies, issues, and risks may be discussed at the same time. |
| Deliverables | Risk spikes are added to the backlog. | Robust risk register. Sometimes assumptions, constraints, dependencies, issues, and risks are combined into a single register. |
7.8.5 IDENTIFY AND ANALYZE PRODUCT RISKS: COLLABORATION POINT
Portfolio, program, and project managers work together on the identification, analysis, and management of product risks because collectively they are a subset of portfolio, program, or project risks. Risk response plans that modify or add requirements or project activities may have portfolio, program, or project implications; therefore, collaboration on risk activities is essential.
7.9 ASSESS PRODUCT DESIGN OPTIONS
Assess Product Design Options is the process of identifying, analyzing, and comparing solution design options based on the business goals and objectives, expected costs of implementation, feasibility, and associated risks, and using the results of this assessment to provide recommendations regarding the design options presented. The key benefit of this process is that it allows for informed recommendations of design options. The inputs, tools and techniques, and outputs of the process are depicted in Figure 7-46. Figure 7-47 depicts the data flow diagram for the process.


Assessing product design goes beyond what the product should do and starts to focus on how it should be built or how it should look. There are multiple options for how a solution can be built, and business analysis is used to evaluate them. This process entails understanding which design options are available and analyzing the details about how those designs would evolve into a solution. Each option's analysis results provide relevant information to articulate the pros and cons, risks, and costs of the option. Each option is compared against the others to determine which option best achieves the overall product goals and objectives and adheres to limitations, budget, and/or time constraints. Designs that are not viable are removed from consideration.
Design discussions need to take place before construction begins for any given solution or component of a solution, even if it is only a small piece of the solution. Avoiding these discussions may result in missed objectives or products that are unintuitive to use. Also, product development might take more time if the teams are trying to make up design choices as they go.
Product teams do not have to wait to assess product designs until after all the requirements are complete. This work can be completed as increments of requirements are ready for design. The requirements need to be prioritized so that the design can best address the most important requirements. If this process is performed iteratively and incrementally, the designs might change from iteration to iteration, causing some rework. In adaptive life cycles, the rework is accounted for during planning. With a predictive life cycle, requirements work is completed in its entirety before design; therefore, design changes have a much larger impact and tend to be costlier than with adaptive methods, especially if pursued as a result of discoveries made during product development.
Design can be identified and analyzed on portfolios, programs, or projects. Designs are most detailed on projects, where they are used to implement some or all of the solution. On a portfolio or program, design analysis can be done to sufficient levels of detail to ensure consistency across multiple releases or components of a solution.
7.9.1 ASSESS PRODUCT DESIGN OPTIONS: INPUTS
7.9.1.1 BUSINESS GOALS AND OBJECTIVES
Described in Section 4.3.3.1. Business goals and objectives define the results the business is expecting a portfolio, program, or project to deliver. Designs need to be aimed at achieving these goals and objectives. Poorly designed solutions that meet the requirements can keep the solution from achieving the desired goals and objectives.
7.9.1.2 ENTERPRISE AND BUSINESS ARCHITECTURES
Described in Section 4.2.1.1. Enterprise and business architectures are the aggregate of technology, business functions, organizational structures, locations, and processes of an organization. The architectures are used to ensure that the proposed designs can operate within the existing architectures or to understand how those architectures might change with proposed designs. The design options might be constrained by either architecture.
Business architecture can help identify design elements that need to be incorporated for different regions, languages, users, and organizational customs, as well as any opportunities to reuse capabilities. In some cases, a single design might not work for all components of the business architecture. Enterprise architecture can help identify any system or data limitations or reuse opportunities for consideration in choosing design options. Some designs may not be feasible with existing technologies. Some design options might need more resources than the current architecture can support.
7.9.1.3 PRIORITIZED REQUIREMENTS AND OTHER PRODUCT INFORMATION
Described in Section 7.7.3.1. Designs are created to reflect how a solution will meet the requirements. Prioritized requirements represent the stakeholders' agreement about which requirements need to be addressed first in the solution and therefore also represent which requirements are most important to account for in the designs.
Requirements sometimes contain legitimate design constraints. Some organizations have certain branding or look-and-feel requirements or capability or technical limitations that lead to design choices or limitations. However, well-written requirements avoid unnecessarily constraining or biasing design. Designs need to be created while considering known risks and should address the impact of those risks on the design. Additional risks uncovered during design also need to be analyzed.
7.9.2 ASSESS PRODUCT DESIGN OPTIONS: TOOLS AND TECHNIQUES
7.9.2.1 AFFINITY DIAGRAM
Affinity diagrams display categories and subcategories of ideas that cluster or have an affinity to one another. Affinity diagrams can be used to help identify design options by organizing user stories, features, or requirements. Similarly, design options can be organized in an affinity diagram for grouping similar designs and aiding in the decision process when trying to make a choice from among different design options. Organizing design information into categories can also facilitate brainstorming new design ideas. For more information on affinity diagrams, see Section 4.3.2.1.
7.9.2.2 BRAINSTORMING
Brainstorming is an elicitation technique that can be used to identify a list of ideas in a short period of time. Brainstorming can be used to identify design options and any risks associated with them. For more information on brainstorming, see Section 5.1.2.1.
7.9.2.3 COMPETITIVE ANALYSIS
Competitive analysis is a technique for obtaining and analyzing information about an organization's external environment. Competitive analysis is used when identifying and comparing design options to create an advantage for the product in the marketplace as compared to competitors. It is useful to understand if a proposed design is far more than what a competitor offers. For more information on competitive analysis, see Section 4.1.2.2.
7.9.2.4 FOCUS GROUPS
Focus groups bring together prequalified stakeholders and subject matter experts (SMEs) to learn about their expectations and attitudes about a proposed solution. Focus groups can be used to solicit attitudes and ideas about different design options. For more information on focus groups, see Section 6.3.2.5.
7.9.2.5 PRODUCT BACKLOG
The product backlog is the list of all product backlog items, typically user stories, requirements, or features, that need to be delivered for a solution. Product backlog items need to be factored into the design, even if the design is lightweight and not formally documented. In adaptive approaches, tasks are added to the product backlog to evaluate complex design options. These tasks are called spikes. For more information on product backlog, see Section 7.3.2.4.
7.9.2.6 REAL OPTIONS
Real options is a decision-making technique that encourages teams to delay decision making until the latest possible time. Delayed decision making provides an opportunity to obtain as much information as possible regarding the issue or item under discussion. When assessing product design options, delaying a recommendation about a possible design provides time for more information to be discovered and analyzed, answering unknowns and thereby reducing the number of uncertainties that would be present if the design choice had been made earlier. The real options technique also eliminates design options that are not feasible by considering the business objectives and goals, expected costs, and risks. For more information on real options, see Section 4.4.2.6.
7.9.2.7 VENDOR ASSESSMENT
On many projects, vendors may provide the solution that best meets the requirements. When assessing product design options, relevant vendors and their products are evaluated to understand the viability, strengths, weaknesses, and risks of each vendor solution. Performing a vendor assessment entails identifying a set of criteria by which vendors and their products will be evaluated. The criteria used to make this assessment might be a set of requirements, user stories, or features, and can be prioritized or weighted. Some of the criteria used to assess vendor offerings might be qualitative criteria—for example, measures used to evaluate the experience of working with the vendor or solution.
7.9.3 ASSESS PRODUCT DESIGN OPTIONS: OUTPUTS
7.9.3.1 VIABLE PRODUCT DESIGN OPTIONS
Design options are representations of how the solution could be constructed. Viable product design options are those that have been reviewed by stakeholders to ensure that they achieve the business goals and objectives and are feasible. Viable product design options are presented with the pros and cons of each option. Once a design is selected, construction of the solution or component of the solution can begin.
7.9.4 ASSESS PRODUCT DESIGN OPTIONS: TAILORING CONSIDERATIONS
Adaptive and predictive tailoring considerations for Assess Product Design Options are described in Table 7-10.
Table 7-10. Adaptive and Predictive Tailoring for Assess Product Design Options
| Aspects to Be Tailored | Typical Adaptive Considerations | Typical Predictive Considerations |
| Name | Elaboration, Sizing, or Spikes | Assess Product Design Options |
| Approach | User stories and acceptance criteria are the basis for any design work. Design is performed iteratively as part of elaboration, sizing, or as the solution is developed. Typically, design is done just in time before development, though adaptive life cycles often do some initial overarching design early in a project to minimize major redesign efforts. Spikes are tasks used to evaluate multiple design options against one another. | Requirements are completed and are the basis for any design work, and design choices are fed to the team responsible for building the solution. |
| Deliverables | Designs are sketches or ideas and often are not formally documented. | Formally specified or modeled designs, completed in tools or documents. |
7.9.5 ASSESS PRODUCT DESIGN OPTIONS: COLLABORATION POINT
Many product team roles assist with the assessment of design options. Architects provide expertise and recommendations and are engaged to highlight complexities and risks with the design options under discussion. Design teams contribute design ideas, sizing estimates, and any risks associated with different design options. A project sponsor provides decision authority about funding a design based on whether it sufficiently addresses the business needs and known risks; DevOps might participate by contributing infrastructure or operational considerations and risks.