
45
the key frames. e frame numbers for Bellour’s key frames and frame set boundaries were selected
using visual comparison between the photographs from Bellour’s article and the extracted frames.
Frame sets were composed of all the frames between successively identied key frames and tagged
using Bellour’s numbering convention. Bellour grouped frame sets into higherlevel groups. e
frame sets were arranged into higher level groups using Bellour’s description.
2.4.10 RESULTS
Due to the dierences in precision between Bellour’s analysis and the structural analysis, we be-
lieved that visual analysis would be the most appropriate option for the task at hand. Bellour’s
analysis began with shot number 3 of the segment and continued to shot 84. Bellour includes two
groups of shots that have little bearing on his analysis of the sequence: Melanie’s acquisition and
boarding of the boat (3–12) and Melanie’s arrival at the dock following her trip and the gull strike
(84a–84f ). ese sets do not play into Bellour’s analysis and appear to function only to demarcate
the segment within the larger document—the entire lm of e Birds.
Detection of key frames and frame sets. Figure 2.9 shows the absolute value of the dier-
ence between the Gini value of a particular frame of the Bodega Bay sequence of e Birds and
the previous frame. e mean dierence between frames for all frames in the sequence is 0.003826,
which is represented on the graph by the green (lower) horizontal line. e mean dierence be-
tween frames identied as key frames by Bellour was 0.075678. e dierence values fall into a
bimodal distribution. e dierence values of key frames and the proceeding frame were an order of
magnitude higher than the dierence values between frames that were not identied as key frames.
Figure 2.10 shows the Gini coecients for each frame broken down into individual frame sets as
identied by Bellour. Within shots, the Gini coecients remain stable for most shots and trend in
a linear manner. Notable exceptions to this pattern include the group of frame sets that make up
Bellour’s “hinge” sequence (25–43); the gull strike (77); and Melanie’s arrival at the dock following
the gull strike (84a–84f ).
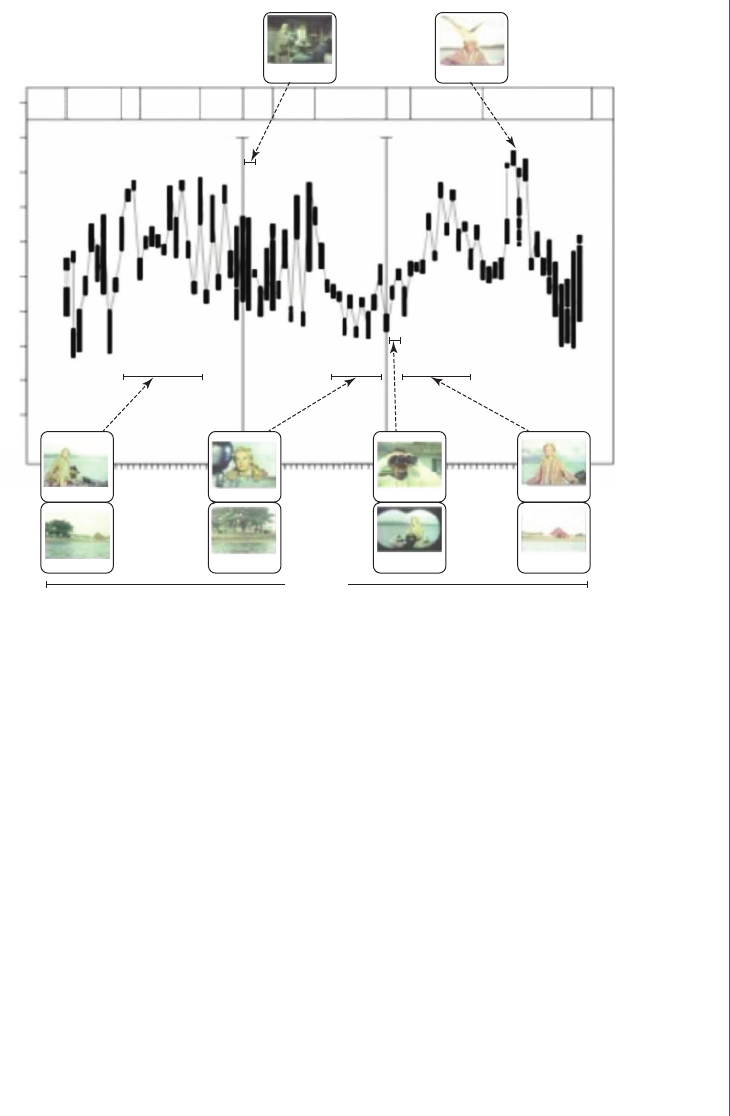
Analysis of frame sets. Figure 2.10 shows the Gini coecients of each frame of the segment
broken down by shot number, presenting the ow of the color distributions across the time of the
lm sequence. We might construct a tact map by overlayering indicators for some of the key el-
ements mapped by the data in Figure 2.10, as in Figure 2.11. Once Melanie is actually underway
on her trip to the Brenner house, we have almost uninterrupted alternation. We are presented with
Melanie in the boat, then the Brenner house as she sees it—Bellour’s shots 15–22. en we are
presented with Melanie paddling the boat and seeing the dock—23–24; then walking on the dock
and seeing the barn—25–31. at is, shots 15–31 present Melanie, what she sees, Melanie, what
she sees, and so on. e latter portion is more distinct in the graph, though the entire sequence of
shots clearly shows alternation.
2.4 STORY FOUR: FUNCTIONAL ONTOLOGY

46 2. FIVE STORIES TO A MODEL OF VIDEO STRUCTURE
1e+00
1e-01
1e-02
1e-03
1e-04
1e-05
1e-06
2,000 4,000 6,000 8,000 10,000 12,000
Frames
Changes in RGB Pallette
Figure 2.9: Dierences in the Gini values between successive frames in the Bodega Bay sequence.
Departure
Center 1
Shot Number
Gini Coefficient
Center 2
A0 A1 A2 A3 A4 A5-B1 B2 B3 Arrival
1.00.90.80.70.60.50.40.30.20.1
12 16 20 40 42 48 52 56 60 66 68 72 76 80 84 8824 28 32 36963
Figure 2.10: Gini coecients of each frame broken down by shot number.
We should note that the RGB graph does not necessarily indicate that there is alternation in
the sense of Melanie/dock/Melanie/dock/Melanie. However, one would still be able to say that there
is alternation of the RGB pallets, regardless of whether a human viewer would say that the same ob-
jects were in front of the lens. Such an RGB alternation might have its own discursive power.
47
Departure
Center 1
Shot Number
Gini Coefficient
Center 2
A0 A1 A2 A3 A4 A5-B1B2B3Arrival
1.00.90.80.70.60.50.40.30.20.1
10 12 16 20 40 42 48 52 68 72 76 2124
Hinge
Melanie
House
Melanie
House
Melanie
Truck
Mitch
Melanie
Gull Strike
Alternation
Figure 2.11: “Tact map” showing Bellour’s hinge sequence and other key features.
Bellour’s hinge sequence runs from frame number 5219 to frame number 6447—Bellour’s
shot numbers 32–36 (A3). Bellour also refers to this sequence as the rst of the two centers. It
would make some sense, then, that it would be in the vicinity of the center and the nal frame
number 6447 is very near the center of 12,803 frames. More signicant is the distribution of the
Gini values—they are clustered more closely to the .5 line and they display much less variation
than we see in most of the rest of the graph. Given the dierent form of the distributions on either
side of the rst center it is not untenable to assert the graphic appearance of a hinge (Figure 2.11).
What is not so immediately evident graphically is the second center—that point in the se-
quence when Mitch sees Melanie—a second center in that it breaks up the rhyme of the trip out and
the trip back for a second time. at is, Melanie has exited the house and heads back to the dock and
the boat. It seems that after having been in the house—the rst center—Melanie will simply head
back; however, Mitch’s discovery of Melanie and the eventual uniting of “hero and heroine for the rst
time in the ironic and ravishing complicity of an exchange” (Bellour, 1969, p. 53) interrupt the return.
Although Bellour suggests that the second center “stands out less starkly,” it does nonetheless
stand out. Shot 43, whose large number of Gini values suggests both its length and the varying
2.4 STORY FOUR: FUNCTIONAL ONTOLOGY
..................Content has been hidden....................
You can't read the all page of ebook, please click here login for view all page.