
Networks of Networks, Metadata, and the Future
Introduction
In this chapter we will take a look at some of the trends that have been going on in industry and government related to the application of metadata, and how those trends might be extrapolated. First, we will look at current systems in use today that take advantage of metadata within the larger marketplace, and then discuss some of the systems that may emerge over time. It is not our intention to forecast the future, but to provide information on how gains that have already been realized might be logically extended to offer benefit for individual organizations as well as their associated industries as a whole.
One of the themes that run throughout this book is the idea that effective application of metadata requires looking at data assets from a higher level. Rather than inspecting how a particular system module operates, we instead look at how the modules within the system communicate and collaborate to get a job done. Instead of looking at particular data items being sent from one system to another, we talk about the overall structure of moving data between arbitrary platforms or applications by using the metadata. In this chapter, we take those same ideas and apply them first to organizations, then to industries, and then between industries.
The concepts presented in this chapter run the gamut of XML technologies. We will discuss XML used as a translation facility, a metadata-representation technology, a communication enabler, and an e-business helper. We will view the automated electronic marketplace from a high level, taking into account what XML has to offer. To start, though, let us take a look at issues of data understanding to frame the discussion.
A Different Understanding of Data and Its Metadata
Human brains think of things and remember things based on ideas that are connected to other ideas. For example, when someone mentions the Internal Revenue Service, it is much more likely that a person’s personal tax return will come to mind than, say, a favorite beach spot, or metadata. This is due to the close connection of those concepts within people’s brains. Artificial-intelligence researchers have known this for some time, and they often use a structure called a “semantic network” to represent human knowledge. Semantic networks are essentially a bunch of nodes in a graph connected by edges that represent relationships. For example, the concept of “travel” might be connected with “airplane,” the concept of “mortgage” connected with “house,” and so on.
People also use these semantic networks as ways of remembering and understanding things. For some, new information can be learned by creating an association between two items that is similar to an association between two other things that they already knew about. As an example, if someone were to tell you that an XML element is only a small and detachable part of a larger document, it might be easier to conceptualize and remember if you understood it in terms of a leaf being only a small and detachable part of a larger tree.
The way people think about concepts and how they organize their understanding affects how they perceive things, and their perceptions of what they can do with them. Some scholars believe that the words available in the language a person speaks dictate in part what they are capable of even thinking about.* Figure 10.1 provides a simple example of how a short list of items can be understood in three completely different ways, according to which method of understanding is used: categorization, abstraction, or pattern recognition. These same conceptual patterns apply* to understanding of data. Each perspective is correct, but they may have relative advantages given the situation.

This idea is important to the realm of data and its management because how we understand the practice in part determines how we actually perform it. This is one reason why earlier chapters took pains to define the various terms related to XML and data management, most notably defining metadata as a use of data rather than a type of data itself. In this section, we want to take a look at an alternate way of understanding plain vanilla relational data. This is certainly not the only or best way to understand the data, but it provides another option and perspective. Alternate ways of thinking of the vital concepts in data management are important, because new advancements in the field will come as a result of new understandings and organizations of data, not simply because of new data.
Figure 10.2 shows the most commonly adopted view of regular tabular data. When we understand data in this way, we tend to see it as a collection of records that have particular attributes. The attributes, or “columns,” in this table are thought of as properties of particular records, and not the other way around, which would be to say that data items in rows “belong” to the columns. This is a hugely useful way of looking at and conceptualizing data, and it has the great side effect of allowing the computer scientists of the world to write efficient applications that store, retrieve, and display data in this format. We are familiar with this understanding from our checkbook registers, paper account statements, and many other data-representation formats well outside the digital world.
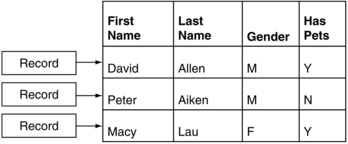
Figure 10.3 provides a different viewpoint on the same data seen in Figure 10.2. Instead of viewing the data by rows, we look at it by the values contained in the various columns of the table, along with the relationships between those data items. The concept of the data “record” in Figure 10.3 simply serves to connect a collection of data items, paired with their metadata. For example, the fact “Peter” is paired with the context “First Name” to give it meaning, just as “Allen” is paired with the context “Last Name.”

In the relational world, ideally a record would correspond to an instance of a particular entity. When entity-relationship diagrams are first created for the system, there are clearly defined entities such as “Customer.” In practical implementations, however, logical entities are sometimes distributed among many tables and records for reasons of performance, accessibility, searchability, and a host of other technical considerations that have nothing to do with the way humans understand the data. The result is a situation where only someone who already knew something about the dataset would have a chance at interpreting what a particular row meant. In addition, it means that the cards are somewhat stacked against the human from the start, as the data is organized for the convenience of the machine, not the user. Logical models, complex CASE tools, and database-querying programs are just the tip of the iceberg of technologies that have been developed specifically to bridge this conceptual gap.
In Figure 10.3, the data is expressed in terms of its column definitions rather than its individual rows. This is not meant as an alternate suggestion for how to organize data inside of computers, but as a suggestion for how to understand what is already there. If the column definitions in Figure 10.2 were removed, one might not understand what was being expressed. On the other hand, if all of the data items in Figure 10.3 were removed, one might still be able to understand what the data structure was attempting to store. The difference between the two figures is simply a matter of perspective, and both perspectives have their pros and cons. Let us take a look at a few more positives to the representation seen in Figure 10.3.
![]() Since only unique values are represented, attached to their respective columns, just by glancing at a particular column definition (for example, “Gender”), we can see what the column’s domain is—namely the values {“M,” “F”} for “male” and “female.” This alone is a tremendous advantage given the number of organizations that may not even know that their Boolean fields store “y,” “1,” and “t” to all mean “true,” while using “n,” “0,” and “f” to mean “false.”
Since only unique values are represented, attached to their respective columns, just by glancing at a particular column definition (for example, “Gender”), we can see what the column’s domain is—namely the values {“M,” “F”} for “male” and “female.” This alone is a tremendous advantage given the number of organizations that may not even know that their Boolean fields store “y,” “1,” and “t” to all mean “true,” while using “n,” “0,” and “f” to mean “false.”
![]() The data must be mentally organized and understood based on its context and metadata. By grouping the data and drawing the diagram as it is, we see that the metadata concepts take precedence over the individual data items. In many ways, this is as it should be, because data structures should have their own meaning, separate from the entity instances they hold. It usually is not advisable to generalize about the possible values of a particular entity based on its instances. For example, if all instances in a human resources database contain ages between 18 and 65, one cannot conclude that employees do not live past 65. On the other hand, some generalizations are possible if the metadata is understood. For example, age instances might range from 18 to 65, but if we understand that the column is storing age, we might generalize it to a wider range of possible values. Age acts as the metadata here because it provides context for our raw data, “18.” If the field is understood to be an age, it might be generalized to allow values greater than 65, for instances where employees are older than 65.
The data must be mentally organized and understood based on its context and metadata. By grouping the data and drawing the diagram as it is, we see that the metadata concepts take precedence over the individual data items. In many ways, this is as it should be, because data structures should have their own meaning, separate from the entity instances they hold. It usually is not advisable to generalize about the possible values of a particular entity based on its instances. For example, if all instances in a human resources database contain ages between 18 and 65, one cannot conclude that employees do not live past 65. On the other hand, some generalizations are possible if the metadata is understood. For example, age instances might range from 18 to 65, but if we understand that the column is storing age, we might generalize it to a wider range of possible values. Age acts as the metadata here because it provides context for our raw data, “18.” If the field is understood to be an age, it might be generalized to allow values greater than 65, for instances where employees are older than 65.
![]() Like data is grouped with like data. From a record-oriented perspective, each record is a set of facts that must be properly associated with the context in order to get meaning. In Figure 10.3, we see data as clusters of similar information, such as “Last Names,” “Genders,” and so on.
Like data is grouped with like data. From a record-oriented perspective, each record is a set of facts that must be properly associated with the context in order to get meaning. In Figure 10.3, we see data as clusters of similar information, such as “Last Names,” “Genders,” and so on.
![]() Records are seen as relationships between facts. Some of the various facts share a common bond—they are all connected to a particular instance, which is different from saying that records share the common bond of all having the same column definitions. It makes further intuitive questions about the data possible, such as, “So if Macy Lau has a ‘Has Pets’ value of ‘Y,’ which other relationships have the same value?” Doesn’t this seem more natural than telling a system to “Show me all records such that the ‘Has Pets’ field value is ‘Y,’ and then further restrict that set to the ‘First Name’ and ‘Last Name’ fields”?
Records are seen as relationships between facts. Some of the various facts share a common bond—they are all connected to a particular instance, which is different from saying that records share the common bond of all having the same column definitions. It makes further intuitive questions about the data possible, such as, “So if Macy Lau has a ‘Has Pets’ value of ‘Y,’ which other relationships have the same value?” Doesn’t this seem more natural than telling a system to “Show me all records such that the ‘Has Pets’ field value is ‘Y,’ and then further restrict that set to the ‘First Name’ and ‘Last Name’ fields”?
![]() Updating data can be viewed as changing row relationships rather than actually modifying data. If Peter Aiken gets a dog, his record can be changed to point to “Y” in the “Has Pets” context rather than actually changing any data.
Updating data can be viewed as changing row relationships rather than actually modifying data. If Peter Aiken gets a dog, his record can be changed to point to “Y” in the “Has Pets” context rather than actually changing any data.
The drawback to the method of understanding data seen in Figure 10.3 is that computer systems are not built to quickly and efficiently dish out data in this manner. This is not to say that it is impossible; in fact, it is relatively straightforward. It just means that computers have been optimized to work with data in a particular way. When computing was young, it was done in this way because information could be quickly cataloged and retrieved in a time when computing resources were at an absolute premium. As prices have dropped and capacities skyrocketed, does it really make sense to understand data strictly in the same way as it was understood 30 years ago? With new computing capabilities comes the freedom to adopt new perspectives that are made possible only because of those new capabilities.
We have discussed at length the need for well-understood and well-architected data structures throughout the book. Since XML can so readily express metadata, the technology to represent data in different terms is already in the hands of data managers. Each data “understanding” and representation format will have its pros and cons, which must be carefully considered for the task at hand—hence the caveat that just because XML provides a method to represent data in alternate ways does not mean that it will do it for you, or that it is a good idea to represent data in that way to begin with.
The purpose here is to get the mental juices flowing and encourage new ways of thinking about challenges that are not new. This is the issue at the crux of human creativity and innovation. In the spirit of understanding new ideas in terms of concepts that we already understand, we will next present the Internet, its structure and growth model, as a metaphor for the understanding of systems communication within organizations.
The Internet Metaphor
The evolution of organizational data systems, and communication between them, is in many ways very similar to the development of the public Internet. There are differences between the two evolutionary paths, but where there are similarities, it is extremely helpful to look at the historical evolution of the Internet and to take lessons from it about what worked and what did not work. Doing this means that we may be able to avoid reinventing a solution to a problem that has already been solved within the context of the Internet. In technology, we should make a constant effort to reuse the experience and knowledge that others have created for us, rather than endlessly reinventing the wheel.
The Internet is often described as a “network of networks,” and can be viewed at many different levels. Often, the average person does not understand just how many layers of complexity are transparently traversed each time a web page is fetched, or an email is successfully delivered. Within each organization, there is a computer network that shuttles information from PC to PC, and allows data to move in and out of the public Internet, usually through some type of firewall or other security provisioning system. Just looking at the organizational level, we can see that there is an entire network that may be either quite simple or enormously complex, depending on the size of the organization and the network topology.
But when information leaves the organizational network, it moves into the network of the organization’s Internet service provider. That provider, too, has its network, which may encompass dozens or hundreds of clients. The purpose of the ISP, which acts as a network capacity provider, is to provide a stable uplink to the wider Internet. Once information moves out of the capacity provider’s network, it may go through yet another larger provider’s network, before moving onto what is referred to as a “backbone”—a high-speed connection that joins major providers with one another. Once across the backbone, information may be routed through a number of other providers’ networks before finally being delivered to the network of the organization whose web page you requested.

In this diagram, we see how the Internet is composed of a “network of networks.” In order for Company B to communicate with Company D, it must send information through Provider A, Regional Provider 1, Regional Provider 2, Provider Y, and finally to Company D. The three dashed boxes in the diagram refer to three levels of networks. The innermost box shows the boundaries of Company B’s network, which might consist of hundreds of PCs, along with a complement of servers and other equipment. Provider A has a larger network, consisting of Company A, Company B, and probably many other clients as well, each of whom has its own internal network. The Regional Provider in turn has a larger network that comprises a number of different providers, as well as all of the networks beneath them.
The point of illustrating this “network of networks” concept is to show the overall architecture of how things connect with one another. The actual public Internet is much larger; it would not be strange for information to jump through 16 different distinct points simply to make a one-way trip to another machine elsewhere. This Internet structure is already in place for organizations. It provides an easy network layer on top of which to build complex applications, and is so ubiquitous at this point that it is frequently taken for granted. The goal here is merely to illustrate how the architecture of the Internet applies to data and metadata interchange between companies and industries.
Internal Organizational Structure
Within organizations of any size, frequently the enterprise actually consists of a number of interrelated subsystems. For example, there might an HR department with a corresponding information system, a sales department, an accounting and finance department, and a manufacturing department.
Figure 10.5 takes a simple example to illustrate how a number of different departments with their own information systems might interoperate and share information critical to the enterprise. The way in which they do it, for the purposes of this discussion, is not very important. Whether the organization uses a hub and spoke model, or more of a point-to-point model (as illustrated in this diagram), the fact remains the same that information is being sent from system to system according to a set of business rules and processes. We can see that Company A clearly has to create and maintain this network within the organization in order to achieve certain goals.

Internal Organizational Data Interchange and the Internet Model
There are several elements of this diagram that relate nicely to the Internet model. Of course, each individual organization will have its own way of organizing its systems, networking them together, and sharing information. This is similar to the low-level networks out there on the public Internet. Some might use Ethernet; others might use token ring networks, or still other types of physical organization. In terms of the way machines on the network are named, there are also differences. Some organizations name each of their servers after cartoon characters, actual department names, or use some other naming convention. Information exchanged internally on the network is of no interest to parties outside of the network, and in fact should remain confidential. In these ways, the data interchange among information systems within organizations is very similar to the organization of local networks within the larger Internet.
These systems of internal data communication within organizations have of course been in place for years. Whether they were implemented as a messy collection of stovepipe interfaces from one system to another, or a more flexible XML-based hub model that utilizes metadata interchange, the need for these types of systems is so great that they have existed in a number of different forms for almost as long as organizations have found themselves dealing with multiple information systems. The technology to address this need is currently in existence, and widely deployed, although different organizations reap varying benefits depending on what type of architecture they have in place, and how well they use it.
The Use of XML-Based Metadata
Generally, when looking at communication between any two arbitrary entities, it makes more sense to inspect the language that the two speakers are using, and the concepts that are considered valid in a “conversation,” rather than the actual specifics of what is being said. In human conversation, we are all aware of which concepts are understandable to the person we are speaking to, and we know what type of language we need to use when we address a particular person. Computer systems do not have the complexity or intelligence of human minds, but still share some common characteristics. If the language spoken among the systems is XML, then we know that most systems will either already be able to speak that language, or can be adapted to speak it. System metadata is roughly the same as a definition of what concepts are considered valid in the conversation. If System A wants to transfer data to System B, it may choose to send the data along with metadata that “explains” what the data means to System B. This is similar to when a human speaker is giving information to another person. Occasionally, the person may stop to explain a particular word or concept used in the conversation, so that both parties understand what is being said. Just as this is done in human conversations, metadata can also be sent back and forth between systems that essentially explains the data being sent—in other words, what is “being said” in the conversation between the two parties.

One of the unique capabilities that humans have in conversation that systems have not had (at least until now) is this ability to explain concepts that are being discussed in the conversation. This means that at the beginning of the conversation, only one party understands the concept, but by the end of the conversation, both people understand the concept and can now use it. This exchange of information about the conversation is what makes humans capable of learning. Machines cannot currently learn in the way that humans do, but systems can be made “smarter” by exchanging metadata. This makes them able to discuss and explain concepts that are being discussed in their system conversations. In this diagram, we see that one person offers the other information about metadata, but needs to first explain what metadata really is. In the system conversation example, the same thing takes place. System A tries to send customer records to System B, but System B needs a bit of clarification as to what exactly System A means when it refers to “CUST_ID.” Because System A is aware of the metadata related to the data it is working with, it can tell System B that “CUST_ID” uniquely identifies a record, or in other words, it acts as a key field for the data being sent.
Looking at system communication from a high level leaves out a lot of details. How exactly will these systems communicate when it gets down to the nitty gritty? The metadata is the answer to this question. Sending metadata along with the data allows the systems to reconcile each of their ideas about what different items are, and what they mean.
Industry Structure
Now that we have taken a look at the internal organizational structure of a particular organization, we will move up to the next level and inspect the interrelationships within a particular industry. For the purpose of this example, we will take a look at the chemical industry. Within industries, a lot of data interchange often takes place. Certainly plenty of competition exists within industries, but there is frequently quite a bit of collaboration as well, depending on the nature of the goods or services being offered.
Industry lines also may blur to include other organizations that may not strictly be considered a part of the industry, but nonetheless provide a given service to many organizations within the industry, and are thus very deeply involved in its functioning. For example, many credit card companies frequently consult the same credit reporting bureaus in order to pull credit reports for applicants, or to build lists of potential customers who will receive solicitations in the mail. In this case, the creditreporting bureaus are not strictly in the credit card business, but provide a service that is used so frequently by the organizations within the industry that any map of the industry would be incomplete without including them.
Regardless of which organizations are considered a part of the industry, the fact remains that within any industry, there are a number of parties that constantly exchange data to the benefit of all of the parties involved. That type of architecture might look similar to Figure 10.7, which lays out a simplified model of the chemical industry.

This is not meant to be an exhaustive list of the relationships that exist among companies in the chemical industry, but a few things are widely known about how companies interrelate:
1. Some companies sell raw chemicals to others in large amounts for processing.
2. Processed chemicals are bought and sold among companies, for subsequent sale.
3. Supply partnerships exist, both among larger and smaller firms, for filling specific orders from customers.
4. Given that chemicals are commodities, companies are interested in the pricing and volume structure of competitors.
Traditionally, the connections between organizations within an industry have almost always been point to point. The different standards and procedures used by each company have made it difficult to consider any other way, since often the only organization that would be able to standardize the interfaces between organizations within an industry would be one with a huge amount of market force and the ability to dictate standards and interfaces to others within the industry. As a result of the typically point to point interfaces that have existed, all of the pitfalls and maintenance burdens of the stovepipe interconnection model have been experienced by organizations that need to communicate with one another. Frequently, any problems that might arise in these communication systems require “out of band” communication—that is, manual human intervention by way of a telephone call, email, or fax from one organization to the other, attempting to iron out a problem due to failure of the automated system. This “out of band” communication causes delays, and costs extra resources.
XML and Intra-Industry Communication
With the advent of XML and a number of standards related to data interchange, the landscape changes quite a bit. Previously, it was difficult for one company within an industry to dictate the intercommunication technology, since a particular technology often implied a potentially huge investment in software and hardware for each of the organizations within the industry that wanted to participate. XML, on the other hand, is a platform-agnostic technology that is implemented by dozens of different software packages in many different arenas. For a company to initiate a policy of communicating externally with XML wherever possible no longer dictates to its communication partner what technology or investment the partner must make in order to participate. This is one of the core benefits of so-called “open standards”: They can be implemented by anyone, anywhere, on any platform.
Since XML standards are publicly created and modified, organizations within industries also do not have to worry about one particular company seizing control of the standard and manipulating it to its own benefit. XML technology puts all organizations, small and large, on equal footing with regard to intercommunication.
As we’ve seen earlier, a communication hub for the chemical industry using XML is not a pipe dream; it is a reality, as are the sizeable benefits being derived by the member organizations. These systems are not in place for all industries, however. As with the early stages of the Internet, the investment for the first few industries that go down this road is potentially quite large. Consequently, the industries that have adopted this type of organization are typically those in which the amount of communication between organizations is quite large, or has traditionally been quite costly. Given the way these systems have been built, they also initially required large buy-ins from potential subscribers or members. This is similar to the beginnings of the Internet where the investment required to buy a data link was quite major.
The way that the Internet grew and evolved from this point is relevant to this discussion. When the Internet was quite small, data links were expensive and rare. As the Internet began to grow, two things happened to the investment that was required for organizations and individuals to connect. First, as the network grew, the price of data links dropped as more companies entered the market and began to compete to provide links to organizations. Second, the ISP, or “Internet Service Provider,” arose—since individuals were requiring data links to their own homes, companies called ISPs would buy a data link themselves, and would sell their capacity to individual users over slower lines. At first, this was in the form of dial-up modem access; later it morphed and grew into the broadband industry. So the cost of connection to the Internet decreased over time because the mean cost of capacity decreased, and because of the creation and growth of companies who subdivided and resold Internet access.
Industry-wide communication mechanisms may likely evolve in a similar way. For example, right now the number of different options that organizations have for connecting to industry-wide networks is somewhat limited, but will probably grow dramatically as organizational interest and recognition of the benefits of these networks increase. This is analogous to the mean cost of access to the Internet decreasing with time. In addition, there have already been efforts made by providers of industry communication solutions (such as Envera mentioned earlier) to create web front-ends for smaller companies to communicate on the networks, when they may not have an entire back-office system dedicated to industry communication. This is analogous to the subdivision of network access—in this case, data interchange capabilities are increasingly being provided to the lower end of the market.
One of the interesting aspects of the Internet and industry communications is the relationship between growth and value of the network—the larger the number of participants on the network, the greater the value of the network for all parties involved. This fascinating point means that much to the luck of the early adopters, the value of their initial and ongoing investments increases with each subsequent addition to the network, since the number of potential clients and partners that they can communicate with in a standard way is enhanced with each new participant. Also, at some point, these industry networks may reach “critical mass,” much as the public Internet has. Critical mass is the point at which the benefits of participation in the network are large enough that buying into the network becomes almost required in order to keep pace within the industry. Can you imagine what your organization would be like if it had no network connectivity internally or externally? The potential benefits of having an industry-wide automated system for data interchange are almost as large.
Inter-Industry Structure
We’ve inspected two different levels so far. First, we took a look at the intercommunication of data and metadata going on within organizations. Then we looked at how industries as a whole often communicate, how XML fits into that communication, and how hubs are currently being built and used that enable this communication. Finally, we will look at one more level of architecture—the exchange of data between industries. Internal organizational communication is like a network. Communication within an industry can be equated to a network of networks. Given this pattern, it is easy to look at inter-industry structure as yet another network of networks, namely, a network that connects all of the different networks comprising various industries. This is the last level that we will look at, and completes the analogy of organizational data interchange systems to the Internet architecture. Looking back at the original figure laying out the organization of the Internet, industry networks can be thought of as providers, while regional providers represent networks of industries.
It is easy to see the potential utility of interindustry data exchange networks. Just as organizations need to communicate with others in their industry, they must also be able to communicate with other industries. The financial department might like to set up an automated payment system that ultimately needs to communicate not only with the company’s bank, but with a supplier in another industry as well. Maybe the sales department needs regular data extracts from a marketing company that creates targeted lists of customers for companies. The manufacturing division needs to communicate with shipping companies to ensure timely delivery of goods to the market. Organizations are not islands in a stream, but interdependent members of a larger economic network. More efficient communication within that network benefits everyone involved and allows enterprises to focus more resources on their mission and business.
In Figure 10.8, we can see that any company listed can communicate with any other company via the network connections that are in place. Chemical companies can fill their shipping needs by communicating automatically with shipping companies via metadata interchange, and at the same time negotiate and deliver payment for shipping through the financial services companies in yet another related industry network. Similarly, banks can attend to customer needs automatically, and shipping companies can work to get the right goods to the right place at the right time.

This discussion of connecting industries with automated systems is one interesting exception to the ongoing comparison of data interchange systems architecture to the Internet architecture. The Internet strangely grew from the inside out; in its early days, it was a research project sponsored by the government that connected a number of universities around the nation. As the Internet grew, networks were added on the outer edges of the system. It certainly is true that portions of the Internet were created by connecting local networks that had existed previously, but for the most part, the core of the Internet was created first and later grew outward. This happened as sites individually recognized the benefit of being part of the entire network. On the other hand, organizational networks have existed for some time, and industry networks are currently growing. This means that inter-industry connectivity is a process of networks growing from the outside in, which is the opposite of how the Internet grew.
Challenges Related to Connecting Industries
Of the three levels that we have looked at so far, two already have concrete implementations in the marketplace. Industry-wide networks exist, and though in their infancy, are growing. Automated communication facilities have existed within organizations for a long time. In contrast to these two levels, the level of automated inter-industry communication has not really been determined. There are some partial and limited examples of data-interchange facilities between industries, but generally they are just that—partial and limited. In practice, these are legacy communication systems not built around XML, but often constructed using arcane, binary-only representations of data that are only understandable with the aid of a 30-pound reference manual, and a few months of spare time. Here we will briefly address some of the challenges that stand in the way of creating inter-industry communication mechanisms, as well as potential solutions to these issues where possible.
Who Drives the Process?
When discussing the creation of industry-wide data interchange networks, we talked about the issue of deciding which organization will specify the data interchange standard. This problem can be best resolved by adopting XML as the core standard for interchange, rather than one organization’s binary-only proprietary format. But the issue gets amplified between industries, because not only must an interchange standard be agreed upon, someone actually has to drive the process.
Industry trade groups exist that partially guide this process, to the extent that a trade group is able to delve into issues of data management on behalf of its constituents. Looking back, we know that networks generally are organized in either a point to point fashion, or in a hub and spoke architectural model. If industry communication were to be organized in a point to point fashion, there would have to be broad industry consensus on how exactly that industry would network with other industries. On the other hand, if a hub and spoke model is used (as illustrated in the earlier inter-industry communication figure), the hub operator is in a position of being able to come to an agreement with the operator of a different industry’s hub about how data interchange will take place. Once those agreements are put into place, the hub operator need only notify its members of the required metadata and XML format to communicate with the foreign industry and its members; the hub manages the rest of the complexity. There certainly are architectural trade-offs associated with using a hub and spoke model as opposed to a point-to-point model, and these tradeoffs will inevitably be examined in detail by each industry as the need arises.
How Do Messages Move Between Industry Networks?
Different industries are separated by quite a bit of distance in terms of the way they do business, and how their practices differ. In order for them to communicate effectively, it is critical that effort be put in on the front end toward creating a flexible metadata model for information interchange. What types of metadata are required on either end of the connection?
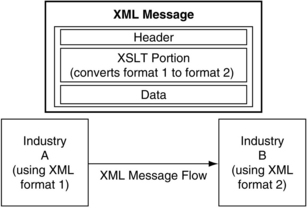
Once the metadata requirements are determined, there is still the matter of actually converting XML messages flowing through the network into the appropriate format. Fortunately, the XML component architecture provides a number of tools for accomplishing this. Specifically, XSLT documents can be embedded inside of larger XML “exchange units” that outline methods by which one format of XML can be converted into another. This allows each industry hub to speak its own version of XML, while remaining interoperable with other hubs that prefer different “dialects” of XML. All that is required is that both hubs are aware of the message format, and how to apply XSLT documents to other XML documents. Hub operators then publish the descriptions of the required metadata elements to each of their network participants, and once implemented, each of the participants will then be able to communicate with anyone in the foreign industry (Figure 10.9).
Bringing It Together: Observations About the Internet Metaphor
To recap several points that have been made at various levels in this chapter, there are a number of similarities between data interchange systems and the Internet.
1. At the local level, these systems are heterogeneous. On the Internet, the topology of your local network is irrelevant. As long as it is built on open protocols that are well understood, data interchange is possible.
2. Given XML architectural components (including, but not limited to, XSLT) it is possible to reconcile different XML formats to enable communication. Just like on the Internet, however, information cannot be added as it moves through the network, only modified. This necessitates prior agreement on metadata items that will be exchanged, just as Internet communication requires agreement on certain metadata parameters.
3. The Internet functions as a network of networks, and provides a pathway between systems. Organizational data interchange networks and industry networks do the same. As with the Internet, the complexity of the various steps from machine to machine—the “hops” that happen in the middle—should be hidden from the end-user systems.
4. The cost of entry into the Internet was high at first, and dropped as more participants came onto the network, and as the technology became more common. The initial cost of entry into industry networks was also high, and is currently decreasing for the same reasons.
5. The benefit to participants of both data exchange systems and the Internet is proportional to the number of participants in the network.
The primary difference between the Internet and the growth of these systems is that the Internet for the most part grew from the inside out, while current systems seem to be following the trend of growing from the outside in. The main architectural implication of this difference is that when things grow from the outside in, they often contain a number of different standards that must be reconciled before networks can be connected, while systems that grow from the inside out often standardize on one system (in the case of the Internet, TCP/IP) and require all new entrants to at least be conversant in that standard before they can initially connect.
Conclusion
There are certainly no guarantees in terms of how systems will evolve in the future. “Essentially everyone claiming to predict the future is lying (the honest ones write science fiction).?”* This chapter is not meant to act as a roadmap for the way data interchange systems will grow and change. It does, however, offer a series of ideas that represent the underpinnings of how current systems work, and how new systems might grow around them in order to extend architectural ideas that are already implemented on smaller scales (such as within organizations or industries). The similarities between the architectural principles that go into the creation of automated data exchange networks and the public Internet should not be overlooked. Wherever possible, practitioners should look to other systems to extract knowledge and experience from the successes and failures of others.
Another point to take from this chapter is that the way in which a challenge is understood heavily affects how you will attack the problem. By comparing a new problem to one that is similar and has already been solved successfully, techniques and architectural ideas that worked once may be effectively recycled. As for these successful techniques, the saying goes, “If it ain’t broke, then don’t fix it.” Why reinvent the wheel?
The investments that would be required to put admittedly elaborate systems such as these in place are substantial, but so are the potential benefits. All organizations, regardless of their industry or business, are constantly under pressure to streamline and to minimize the resources that are allocated to business processes that are not part of their core mission. Standardized, flexible, automated data interchange systems are a potential boon for any organizations that move toward implementing them for internal and external communication.
*This is referred to as the Sapir-Whorf hypothesis. For more information, see http://en.wikipedia.org/wiki/Sapir-Whorf_hypothesis
*Eric Allman, creator of the popular email server software ‘Sendmail’.