
CORPORATE GOVERNANCE AND MANAGERIAL COMPENSATION
INTRODUCTION
Amajor responsibility of the board of directors is to determine managerial compensation systems. How should managers be compensated? Should pay be tied to performance? How should performance be measured? What evidence is there about the relation between managerial pay and performance? What pay, performance evaluation, and compensation systems are likely to mitigate and not exacerbate conflicts of interests between managers and shareholders?
THE PROBLEM
Consider a New Hampshire ski resort, SkiTrails, that is publicly owned. Ownership is dispersed, and the resort is run by a manager. In this arrangement, the manager is the agent of the owners, who want the manager to maximize the market value of SkiTrails. If the owners could directly observe the manager’s day-to-day effort and had as much information as the manager about why the financial performance of SkiTrails was good or bad, they could simply pay the manager a fixed wage and fire him if he shirked, consumed perquisites, or lacked the necessary skills for successfully managing the enterprise. The problem, however, is that the owners cannot directly observe the manager’s efforts and that the manager typically has more information than the owners about why SkiTrails is or is not profitable. So, what can the owners do to solve this informational asymmetry problem and get information about whether the manager is putting out adequate effort, where adequate means managing effectively, not shirking, and adding value to the company.
One way to deal with this problem is to tie the manager’s compensation entirely to an output measure—let’s say profits. For example, the SkiTrails manager could be paid 10 percent of the resort’s yearly profits. But this pay scheme creates an additional problem.
Should the manager’s pay be affected by events beyond his control? Suppose that a record heat wave hits New Hampshire during November and December, making it impossible to blow snow and operate the mountain. Then, suppose that a dearth of snow is accompanied by a stretch of bitterly cold weather, with wind chills in the minus thirties. As a result of these acts of nature, SkiTrails loses money that year and the manager earns no income, even though, without his efforts, SkiTrails would have gone bankrupt. (For a real example, substitute the dismal performance of technology stocks in 2000 and 2001 for the ski resort.)
Alternatively, suppose the entire ski season is one of sunny, thirty-degree days with six inches of snow every night. Should the manager share in the extraordinary profits of this season? Let’s call this weather risk uncontrollable risk.
Perhaps some managers might be willing to take on this uncontrollable risk with respect to their entire pay. But in that case, the manager is in pretty much the same position as the owners of the company, so why wouldn’t he start his own company?
Most likely, the manager is risk-averse and wants some way to avoid bearing the uncontrollable risk of the firm, which means passing it on to the owners of the company. How do we escape from this dilemma?
MEASURING EFFORT AND PERFORMANCE
To the extent that managerial effort can be measured indirectly, the opportunities for managers to shirk can be minimized. Both input and output can be measured.
A typical input measure would be the number of hours the manager spends on the job. Other input measures would include the cost of items used in the production process. For our SkiTrails manager, such input measures could include the number of hours spent at the resort, the cost of snowmaking, expenditures on advertising, and so on. The assumption is that the quality of whatever input is being measured is constant and that there is a recognizable relationship between input and output. From an accounting perspective, organizing the firm into cost centers and evaluating managers on the basis of costs alone is essentially an input-based monitoring system.
For managers, though, output measures are more likely to be used than input measures. These measures are not direct measures of effort but, instead, are what are called instrumental measures. They either measure something that is thought to be closely related to effort or compare outputs to inputs. Historically, such measures have included net income, profit margins, return on assets and return on equity (both measures that compare outputs to inputs), and growth in earnings and sales. In terms of maximizing the wealth of the existing owners of the company, the company’s stock price is also assumed to be related to these measures. So, increasingly, more and more companies are using the stock price itself or some compensation scheme that ties rewards to the stock price to finesse the ever-present problem of measuring effort. Still, the problem of separating the contributions management makes to performance from factors that are not under management control (luck, noise) remains. How do we get out of this box?
Measures of relative performance may be one answer. Owners can measure managerial performance relative to the performance of other firms in the industry or some other benchmark. For example, managerial performance can be benchmarked against such industrywide financial ratios as profit margins, return on assets, return on shareholders’ equity, and rates of growth in sales and net income. As we will discover, many companies do use such relative performance measures and measure performance against ‘‘peer groups.’’
With respect to the stock price, managerial performance can be evaluated by adjusting the change in the company’s stock price for what happened to the market in general—all companies—during the same period. Suppose the per share price of XYZ Corporation fell by 8 percent over the year. Was the decline in the share price due to poor management or to factors beyond the control of management, such as an economywide recession? Some insights into this question can be gained by looking at what happened to a broad-based market index such as the Standard & Poor’s 500. If the index fell by 20 percent, perhaps the managers of XYZ Corporation should be paid a substantial bonus because they were able to guide the company through the recession far better than the managers of other companies. However, if the index rose by 20 percent during the period, a different story emerges.
COMMON PAY AND PERFORMANCE SCHEMES
In the United States, senior managers’ pay typically has three components: a fixed or base salary, a short-term or annual bonus payment, and a long-term bonus or performance payment. Both the short-term and long-term bonus payments are tied to performance measures, with the long-term bonus often taking the form of stock options. In 1996, the median CEO pay, inclusive of all forms of compensation, was $3.2 million in mining and manufacturing, $4.6 million in financial services, and, $1.5 million in utilities.1
For U.S. CEOs, the fixed base cash salary represents between 20 and 40 percent of total compensation, with the fixed salary percentage being lowest among large manufacturing firms and financial services companies (a category that includes investment banks) and highest among utilities. Furthermore, the CEO’s base salary as a percentage of total compensation has been dropping since 1990. However, one explanation for the reduction in fixed salaries as a percentage of compensation may be a 1993 change in the U.S. tax code that prohibited firms from deducting as business expenses nonperformance pay over $1 million to executives. Consequently, any compensation in excess of $1 million is likely to be disguised in one form or another as incentive-based pay.
Base Salary Examples
Base salaries for senior managers are set by the compensation committee of the board of directors. At Genuine Parts Company (GPS), the compensation committee sets the base salary of the CEO based on (1) the CEO’s base salary the previous year, (2) increases in the cost of living, (3) increased responsibilities, (4) compensation of CEOs in the company’s Peer Index, and (5) the CEO’s past performance. The Peer Index for GPS is a company-constructed index of firms in similar lines of business; it includes firms in the automotive parts, industrial parts, office products, and electrical materials industries. Base compensation for other executive officers of GPS is then set by the CEO and the compensation committee using the same criteria.
The compensation committee of First Virginia Banks sets the base salary of executives as a function of (1) the degree of responsibility the officer has and the officer’s experience and service and (2) the compensation levels of corresponding positions at other banking companies that make up what First Virginia calls a local peer group. The committee uses the median salaries of the local peer group as a target. This procedure produced a base salary of $600,000 for the CEO in 1999, which was 101.5 percent of median salaries for his counterparts.
Note, though, that using peer-group averages may tend to ratchet up everyone’s pay over time. This outcome occurs because of a tendency to raise the pay of everyone who is below the average to the average, causing the average to move up (unless, of course, everyone is above average, as in Lake Wobegon).
Short-Term Incentive Plans
Short-term (annual) incentive pay plans tie a portion of managerial pay to the performance of the company over the past year; hence the term annual incentive plans. These plans consist of performance measures, individual and group standards or goals, and a system for relating managerial pay to the goals. In the 1990s, these plans made up about 20 percent of CEOs’ total pay.
Performance measures for short-term incentive plans almost always include one or more financial statement metrics. Typically, some measure of accounting income is used, such as earnings before interest and taxes (EBIT), net income before taxes, net income after taxes, and/or earnings per share. In addition to levels of income, rates of return on assets, stockholders’ equity, or sales may also be used. Occasionally, rates of growth in sales or income may be included as well.
Individual and group performance is measured against standards. These standards may be the previous year’s actual performance, a budget, or some absolute standard that remains the same from one year to the next. The typical plan sets a minimum standard that must be reached before any bonus is paid, and also sets a cap on the maximum bonus that will be paid regardless of how well the manager performs.
For example, the manager’s performance may be measured against last year’s net income after taxes. The minimum or threshold level may be achieving at least the same net income as in the previous year. Once this threshold is reached, an increasing bonus is paid up to, say, a 20 percent increase in net income over the previous year. Increases in net income beyond 20 percent, however, do not generate additional payments. If a budget is used, the manager’s performance is measured against the budget and not the prior year’s performance. An example of an absolute standard would be earning a return on assets of, say, at least 10 percent.
Group incentive pay plans create a pool of dollars conditional on group performance that are distributed to the individual managers within the group in accordance with some scheme. Individual managerial performance may affect the way the group pool of dollars is ultimately divided among the managers.
Short-Term Incentive Examples
In 2001, First Virginia Banks had a short-term incentive program that granted bonuses to executive officers and the CEO if First Virginia achieved a return on total average assets (ROA) of at least 1 percent. An ROA of 1 percent was used because the compensation committee believed that ROA is the most important single factor in measuring the performance of a banking company, and that a 1 percent ROA is the minimum for a good-performing banking company.
First Virginia awarded a bonus of up to 50 percent of an executive’s salary if the bank achieved an ROA equivalent to 80 percent or more of the ROA target amount for the year. For the CEO, First Virginia would also have to achieve 80 percent of the targeted amounts for return on equity, asset quality as determined by the ratio of nonperforming loans to total assets, and capital strength based on the average equity-to-asset ratio and the Tier 1 risk-based capital ratio. Also, a bonus was paid based on the degree to which First Virginia’s earnings, asset quality, and capital ratios exceeded the average for other major banking companies in the Southeast. Note again that this latter bonus was tied to relative and not absolute performance, as performance was measured against competitors.
In 1999, Genuine Parts Company (GPC) had a short-term incentive plan that provided approximately 48 percent of its executives’ total annual compensation but could rise as high as 62 percent. GPC’s annual incentive plan was based on goals set by the company. A projected pretax return expressed as a percentage of shareholders’ equity at the beginning of the year—a budget-based performance standard—was deemed the most important measure, but GPC also set sales targets and return on assets targets. In 1999, the CEO of GPC earned an annual bonus equal to 61 percent of his total annual compensation. The annual bonus was determined 90 percent by meeting the return on equity goal, 5 percent by meeting the sales goal, and 5 percent by meeting the return on assets goal.
Problems with Short-Term Incentive Plans
Short-term incentive plans do not always align the interests of managers with those of the public shareholders. Problems arise because accounting measures are used, because performance standards can be manipulated, and because managers can game the system by transferring effort from one period to another.
Problems with Accounting Measures
The use of accounting measures such as net income, earnings per share, and return on assets or equity assumes that these measures are highly correlated with stock prices. They often are, but not in quite the way that is often supposed, especially because they can be manipulated. Stock prices are correlated with future earnings, not past earnings—there is a lead-lag correlation, with stock prices predicting future earnings.
One important fact to remember about accounting-based performance measures is that they look backward, not forward. Net income, for example, measures the difference between past revenues and past expenses. Therefore, managers can manipulate net income by reducing expenditures on such things as advertising, research and development, and employee training programs in order to ‘‘earn’’ higher bonuses under a short-term accounting-based incentive scheme. But, the consequences of such actions are likely to be reduced cash inflows and earnings in the future, which will be bad for the stock price because the stock price is determined by expectations of future cash flows.
Problems with Budgets
A second important fact to remember about accounting profits is that managers can manipulate them to move profits from one accounting period to the next. Examples would include the choice of depreciation schedules for assets, accruals of expenses, and booking of revenues. Indeed, managers commonly use discretionary accounting rules to smooth earnings from one year to the next in order to avoid reporting large one-time gains or losses in income. Thus, managers can game bonus plans through manipulating accounting earnings.
Another major problem with short-term bonus plan performance standards is that managers are usually involved in setting the standards, especially if the standard is a consensus budget. Hence, managers can influence the standards that are set and, therefore, performance outcomes. Knowing that their pay will be affected by how they perform relative to a budget, managers may be inclined to underestimate budgeted revenues and overestimate budgeted expenses.
Absolute performance standards such as a 10 percent return on equity are less susceptible to such gaming, but only if the managers do not exert influence over the standard. A classic example of managers gaming the bonus system by setting their own absolute performance standard is a Deutsche Bank stock option plan in the early 1990s. Deutsche Bank managers implemented a pay scheme that would give them bonuses if the return on Deutsche Bank common stock merely equaled the return on default-free German government bonds!
Potential Gaming Behavior
Finally, the thresholds and caps on short-term plans can also induce managerial gaming. Suppose a manager faces the following incentive plan: She receives a bonus of 20 percent of base salary if net income for the year is greater than $100 million, and the bonus rises to 25 percent if net income is $150 million. No additional bonus is paid if net income exceeds $150 million. If the likelihood that net income for the year will reach $100 million is nil, she has no incentive to exert additional effort for that year and every incentive to incur expenses this year and push revenue into next year. She faces the same incentive if net income is likely to be above $150 million. She receives no additional bonus this year for income over $150 million, so, again, why not book expenses this year and delay sales until next year?
Okay, so if there are all these problems with short-term incentive plans based on accounting income and related accounting measures, why are the plans so common? The answer is that accounting numbers are verifiable and are calculated according to a set of generally accepted rules. Managers know the rules and can predict the effects of their behavior on their pay. This predictability means that managers can focus their attention on those metrics that those who design the plans believe are important for maximizing shareholder wealth and not worry about after-the-fact reinterpretations of performance being used to change the rules of the game.
In summary, the problems of short-term incentive plans can be mitigated if multiple performance measures that are more difficult for managers to game than a single metric are used, if standards are set externally, and if absolute standards are used instead of budgets or comparisons to prior year performance. Still, these plans may result in managers making short-term decisions that are not in the best interests of the shareholders, so, long-term incentive plans are also used to compensate managers.
Long-Term Incentive Plans
Long-term incentive plans tie a portion of managerial pay to some long-term performance measure. The measure(s) can be the same accounting-based measures described earlier or the stock price of the company. When accounting measures are used, performance is evaluated over more than one year. Typically, the manager must remain with the firm for a specified length of time in order to receive bonuses earned under long-term incentive plans. The bonuses may be paid in cash, restricted stock, or stock options. Restricted stock is a grant of shares in the company that may not be sold or disposed of prior to a future date and that may be forfeited if the manager leaves before the end of the restricted period.
Increasingly, stock options are the preferred form of payment in the United States, with over 30 percent of CEO compensation coming in the form of stock options in all industries except utilities in the mid-1990s. The typical stock option traded in financial markets is a financial contract that gives the owner the right but not the obligation to buy or sell stock at a specified price, called the strike or exercise price, through a specified period of time, called the option’s expiration date. A call option is the right to buy stock; a put option is the right to sell the stock at the strike price.
The value of the option can be calculated with the Black-Scholes option pricing model. For a detailed description of this model, you should consult a book on investments. For our purposes, the two important determinants of an option’s value are the difference between the strike price and the market price of the stock and the volatility of the underlying stock. For a call option (which is what managers receive), the option becomes more valuable as the market price of the stock rises above the strike price. So, when a manager receives options to buy common stock in her company at, say, $40 a share, the options increase in value as the company’s stock price rises above $40 a share. Should the stock price fall to $20 a share, the options would be worthless.
The other important determinant is the volatility of the stock price. The more volatile the stock price, the more valuable the option. Look at it this way: Why would anyone buy an option on a stock selling for, say, $60 a share today if they knew that the price of the stock would always be $60? Contrast this situation with one in which the stock price could be $100 or $10 a year from today. Under these circumstances an option to buy at $60 would be worth money. If the stock rises to $100, exercise the option and make $40; if it falls to $10, let the option expire. And contrast this situation to one in which the stock price could be $500 or $5 a year from today. Now the option to buy the stock is worth even more than when the stock price could range between $10 and $100 a share.
The options given to managers under long-term incentive programs usually have some restrictions attached to them. Most often, the options cannot be exercised immediately but must be held for a specified number of years—a process called vesting. Furthermore, the options cannot be sold, and if the manager leaves the firm before the vesting period, the options are voided. Other conditions can also be placed on the stock option grants, such as mandating that the stock price must reach a certain level before the options are given to the manager.
Examples of Long-Term Incentive Plans
GPC’s restricted stock plan is typical of many such plans. During 1999, GPC agreed to make future grants of restricted stock based upon increases in the company’s stock price and the achievement of certain earnings per share targets between 1999 and 2003. GPC also has a stock option plan. In 2000, GPC granted options to purchase 2,408,000 shares of common stock at fair market value (set as the market price on the granting date) to 357 employees.
First Virginia granted options covering a total of 220,500 shares of First Virginia stock to executives in 2000. These options vested over a five-year period in equal installments.
Brush Wellman had a long-term incentive plan in effect from 1995 through 1999 that granted restricted stock awards based on management objectives measured over three years. The awards were based on achieving a target level of return on invested capital. The target was not met, and the CEO forfeited the 19,639 performance restricted shares that had been granted him in 1996.
In 1998, Brush Wellman set up a new restricted stock performance award with objectives based solely on stock price appreciation between 1998 and 2000. Under this plan, the CEO was granted 11,606 performance restricted shares, which would be forfeited—as happened under the 1995 plan—if the stock price goal was not met.
Problems with Stock Option and Restricted Stock Plans
The theory behind granting managers stock options is that those who receive stock options will make decisions that lead to share price appreciation because the value of the stock option is tied to the share price. And at first glance, stock options appear to have no drawbacks associated with them. However, problems do exist, and many of them have come to light with the decline in stock prices in 2000 and 2001, the collapse of many ‘‘new-economy’’ stocks, and the failure of telecommunications companies and Enron.
Let’s start with cash dividends. Executives who hold stock options do not receive cash dividends. Therefore, these executives may be inclined to retain earnings rather than return them to the public shareholders. Recall from our discussion of the stock price valuation model that reinvested earnings are the fundamental cause of growth in stock prices, and it is this growth—capital gains—that is captured by managers who hold options.
Alternatively, managers may prefer to repurchase the company’s stock rather than distribute the cash to shareholders as cash dividends. If there are fewer shares outstanding, per share earnings will increase, leading to an increase in the per share stock price. Empirical evidence supporting reduced cash dividend payouts and increased share repurchases by managers whose compensation is strongly tied to stock options does exist.2
Another potential problem with stock options and restricted stock is that managers may take on very risky investments if the stock price has fallen or if the stock price goals under a restricted stock plan appear unlikely to be met. As we noted earlier in this chapter, a major determinant of the value of stock options is the volatility of the underlying stock. An increase in stock price volatility causes an increase in the value of the option. And the way to increase stock price volatility is to make more risky investments. However, while this is a valid theoretical argument, we suspect that the losses a manager would incur if the firm failed more than outweigh the potential gains from taking on risky negative net present value investments just to increase the value of the option.
Reported Earnings and Paying Managers with Stock or Stock Options
The most visible problems with using options to compensate managers that have surfaced involve earnings and earnings manipulation. Consider this question: Should the value of the options granted management be recorded as an expense—in the same way that salaries are an expense—and thereby result in a lowered net income and earnings per share? Put it a bit differently: Does the failure to deduct the value of the options given management understate expenses and overstate net income? And, whether it does or doesn’t overstate net income, does it affect the way investors value the company’s common stock?
The argument for recording options and restricted stock as an expense is that these grants, if exercised or vested, will cause the claims of existing shareholders on the assets, cash flows, and earnings of the company to be diluted. For example, take two companies that are identical with regard to everything except how they pay their CEO. The data are given in Figure 8-1. Each company has 10 million shares of stock outstanding with a share price of $200 a share, for a total market value of $2 billion. A public shareholder, JQP, who owns 1 million shares owns 10 percent of the company and is entitled to 10 percent of any dividends and earnings. Before paying and accounting for the CEO’s compensation, the earnings and cash flows available to the shareholders of both companies are $300 million.
Now, Company A pays its CEO $10 million, resulting in net income of $290 million being reported on the company’s income statement. The $10 million salary paid to the CEO leaves the company, so the market value of the company falls to $1.99 billion. The company can either retain the $290 million in earnings or distribute them as cash dividends. In either case, our public investor has a claim on 10 percent of the earnings or dividends, for a total claim of $29,000,000, and, the value of his holdings would be $199 million.
FIGURE 8-1 THE EFFECTS OF PAYING MANAGERS IN STOCK ON THE MARKET VALUE, REPORTED EARNINGS, AND CASH FLOWS OF A COMPANY
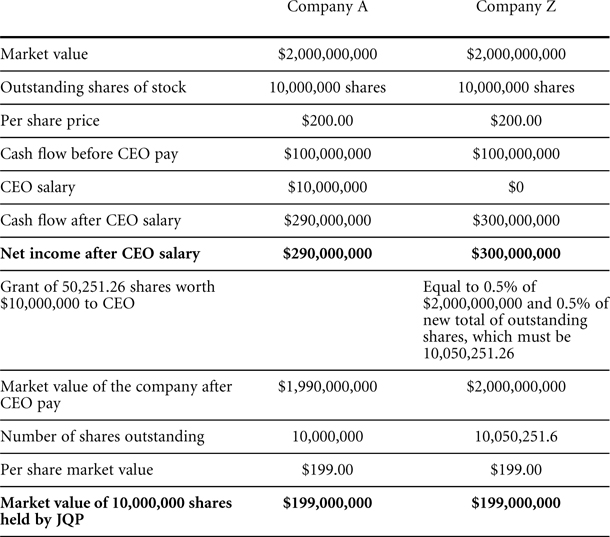
In contrast, Company Z pays its CEO in restricted stock. So, at the end of the year, the CEO receives a conditional stock grant worth $10 million. But, how much stock should she receive? Well, the total market value of the company will still be $2 billion because no cash has left the company to pay the CEO. Instead, the CEO will be given stock with a market value equal to $10 million. Whatever the number of shares given the CEO, they must represent 0.5 percent of the new number of shares outstanding after the CEO has received these shares. The old public shareholders will now own only 99.5 percent of the post-stock award number of shares. Thus, the new total number of shares outstanding must be 10,000,000 shares divided by 0.995, or 10,050,251.6, and the CEO must receive 50,251.6 shares if she is to own 0.5 percent of the company.
Now we can continue our story. Look at the net income that would have been reported had the CEO been paid with a restricted stock grant. The net income would have been $300 million, as compared to $290 million if a pure salary compensation scheme had been used. It looks as if the earnings are higher under the stock compensation plan. But, in reality, JQP, our public investor, finds himself in exactly the same position under either plan. In both cases he ends up with $199 million, despite the fact that Company Z reported higher earnings. What happened?
Well, in the case of Company Z, the CEO was given potential ownership in the company for ‘‘free.’’ She did not have to invest any cash. So, instead of being divvied up among 10,000,000 shares, the $300 million in earnings must now be divvied up among 10,050,251.6 shares. Each old shareholder gets a smaller percentage of the pie. This is called dilution of shareholders’ equity. So, yes, compensating managers with restricted stock and with stock options (which are treated similarly with respect to expenses and net income) is, effectively, a cost that isn’t presently recognized on the income statements of publicly held corporations.
But we still haven’t answered the question of whether investors are fooled by this accounting convention. Will the stock of Company Z have a higher price than that of Company A because of the apparent higher earnings? Not in efficient markets.
Abusive Manipulation of Earnings
More of a problem than whether stock options are recorded as an expense and a reduction in net income is what we will call abusive earnings manipulations—legal and illegal.
You are the CEO of NewEconomyTech, otherwise known as NETECH. Your pay is tied to the stock price of NETECH, and you also hold a substantial number of options on NETECH stock. You firmly believe that NETECH’s stock price is tied to its reported earnings, and especially to the rate of growth in earnings. Furthermore, your stock has been touted by many Wall Street analysts, who have predicted double-digit earnings growth for NETECH. These analysts meet with you quarterly and ask for your assessment of whether NETECH will meet its earnings targets (forecasts). Your assessments are called ‘‘earnings guidance’’ in Wall Street jargon, and coming in under these targets can cause NETECH’s stock price to tank. So, what do you do?
Well, as long as things are going well for NETECH, you don’t have a problem. But, sooner or later, NETECH will no longer be able to grow at 60 percent a year without becoming larger than the entire world’s economy. So, as NETECH’s growth slows down, you look for ways to conceal this through the use of aggressive accounting conventions. Eventually, you and your auditors, who are also your management consultants, run out of legal aggressive accounting conventions, and you find yourself on the edge of legality with respect to booking revenues, recognizing expenses, and reporting the company’s debt obligations. Do you step over the line? Does your auditor help you step over the line in order to keep your consulting business? Or, do you ‘‘fess up,’’ tell the analysts that earnings will not come anywhere near what they forecasted, and take the hit on the stock price?
For someone who wants a corporate governance system that makes it possible for firms to finance investments as cheaply as possible (to create jobs and income) and to allocate capital efficiently, abusive manipulations of earnings, often achieved at the expense of the long-run health of the firm and, more importantly, the economy, are not what is wanted. So, how do you prevent this?
One way is to simply prohibit pay schemes such as stock options so as to remove the temptations of managers to manipulate earnings. But then the benefits of these schemes are also lost. Another way is to reform the rules and institutions for auditing the books of publicly held corporations, including the responsibilities and legal accountability of managers and auditors. We return to these questions in the closing chapter.
EVA® : A VERY POPULAR COMPENSATION PLAN AND CORPORATE GOVERNANCE METRIC
EVA® or some variation of it is widely used among U.S. corporations. For example, Georgia-Pacific says in its 2000 Annual Review, ‘‘We use EVA® metrics … to improve our understanding of risk and return tradeoffs.’’ EVA is also used by investment bankers, including Goldman Sachs and Credit Suisse First Boston, for valuing companies around the world. Furthermore, according to Stern Stewart, major institutional investors use EVA to select companies to include in investment portfolios. And the California Public Employee Retirement System uses EVA to identify companies that need corporate governance reforms. So what is it?
EVA stands for Economic Value Added and is a trademarked product of Stern Stewart & Company. Although other similar products exist, we use EVA as a vehicle for explaining how corporate boards are trying to connect managerial pay to performance and align the interests of managers with those of public shareholders. Also, EVA has come under extensive scrutiny by financial economists, so there is an ever-growing body of empirical work evaluating its effectiveness.
Earlier in the book, we defined NPV as the difference between the present value of the expected after-tax cash flows from an investment project and the present value of the cash outflows invested in the project, both discounted at the project’s cost of capital. The greater the NPV, the better the project with respect to creating shareholder wealth and increasing the stock price. We also showed the connection between a project’s NPV and its market-to-book ratio: The greater the NPV, the greater the market-to-book ratio. EVA is simply a way of measuring whether managers have been able to undertake positive NPV projects and earn a return for the shareholders that is greater than the investors’ required rate of return on the stock.
A manager adds economic value when she can earn a return over and above the company’s cost of capital. The result will be a company that has a market value greater than its book value. We draw extensively on an explanation of EVA put forth by G. Bennett Stewart, III, a member of Stern Stewart and an advocate of EVA.3
A STYLIZED EVA EXAMPLE
Consider an all-equity company, Value-Gain, with a market value (MV) of $900 million and a book value (BV) of $600 million. Book value is the dollar value of its shareholders’ equity. Figure 8-2 contains stylized financial statements for Value-Gain. Value-Gain has 10 million shares of common stock outstanding, so its book value per share is $60 and its market value per share is $90. The investors’ required rate of return on Value-Gain stock is 10 percent.
The difference between the market value and the book value is $300 million; under EVA, this is called the market value added (MVA). MVA corresponds to NPV for a single investment for which the present value of the cash inflows would be $900 million, the present value of the cash outflows would be $600 million, and the NPV would be $300 million.
FIGURE 8-2 VALUE-GAIN MARKET AND FINANCIAL DATA (ALL DOLLAR AMOUNTS EXCEPT PER SHARE DATA IN MILLIONS)

Recall that back in Chapter 5 we calculated the present value of Snail Fish as $427,181, subtracted from this amount its cost of $300,000, and said that Snail Fish has a NPV of $127,181. We then said that this positive NPV meant that the returns that Lamprey Products shareholders could earn on Snail Fish were greater than both the 14 percent cost of capital for the project and the returns that Lamprey Products’s shareholders could earn on the $300,000 anywhere else. Well, in the Snail Fish example, the MVA for the Snail Fish investment is its $127,181 NPV, with $300,000 being the book value for Snail Fish and $427,181 being its market value. In other words, the managements of Lamprey Products and Value-Gain are creating value for shareholders by earning returns in excess of investors’ required rates of return—the company’s cost of capital.
To continue, suppose that the $900 million market value ($90 a share) of Value-Gain came from investors’ expectations that this company would generate after-tax net income in cash of $90 million a year ($9 a share) for ever and ever and that all earnings would be paid out as cash dividends ($9). Given the investors’ required rate of return k on this company of 10 percent, the market value of the equity of one share of stock would be $90, calculated as:

The market value of the company, of course, is $90 per share times 10 million shares, or $900 million.
Now, think about the $90 million of net income (NI) in Figure 8-2 that is reported each year on the company’s income statement. Suppose we make one more adjustment to net income and call it the cost of equity capital (or equity capital financing charge), which is simply our investors’ required rate of return on the common stock. This charge should be 10 percent of the capital that the shareholders have provided to management to generate the earnings. The capital for our all-equity firm, shareholders’ equity, is $600 million and the equity capital financing charge is $60 million.
So, let’s subtract the equity capital financing charge of $60 million from the $90 million net income. We end up with $30 million. This $30 million is called EVA, or the economic value added by management. When we capitalize this $30 million annual EVA at the 10 percent cost of equity capital, we have $300 million, an amount that is exactly equal to the MVA, the difference between market value and book value.
Relating the EVA framework to our presentation on investment analysis, then, the market value MV of a company is the analog of the present value of an investment project. The book value BV of a company is the analog of the cash outflows needed to make that investment. And the EVA is the value of the cash flows the project earns over and above its cost of capital, discounted at the project’s cost of capital.
Using EVA to Set Compensation
Okay, what does this mean for a management compensation scheme that aligns the interests of managers with those of shareholders? Well, again to keep it simple, executive short-term incentive plan bonuses can be tied to EVA. The compensation committee calculates the company’s cost of equity capital k and applies it to the assets (shareholders’ equity) under the control of the manager. Then the accounting net income of the company or division under the control of the manager is reduced by this equity capital financing charge. The annual bonus then becomes a function of the remainder, called EVA. Positive EVAs are good news for the manager’s bonus; negative EVAs are bad news—not only for bonuses but for the likelihood that the division will remain part of the company.
A specific example of how EVA has been implemented is the case of SPX, a large U.S. auto parts and industrial company. SPX was an underperformer in the 1990s in terms of both profitability and share price. With the arrival of a new CEO in 1995, SPX adopted an EVA bonus plan for its senior managers, and eventually for 4,700 other managers. The stock price of SPX subsequently rose from $16 to $180 a share—an outcome that the company attributed to the mindset created by the EVA plan’s focus on value added. SPX also experienced improvements in asset efficiency, led by a reduction in inventories. The EVA plan, by focusing managerial attention on the capital costs of holding inventory and, more important, tying managerial bonuses to earnings in excess of capital costs, motivated managers to monitor and reduce inventories, which translated into a reduction in the amount of capital (book value) needed to support a given level of net income.
Our description of EVA is very basic. Many modifications are made to fit the plan to each company’s special needs and circumstances. For detailed descriptions of EVA, contact Stern Stewart Management Services.
THE EVIDENCE ABOUT PAY AND PERFORMANCE
Okay, let’s ask the really important question: What is the evidence concerning managerial pay and performance? Well, it’s mixed.
Some early studies by financial economists found that the stock prices of companies that announced stock-based compensation plans went up on the announcement day, indicating that investors saw such plans as good news. But these are one-time events, and so the question becomes whether any additional investor benefits were forthcoming.
What about the relationship between market value and book value, a relationship that is at the core of EVA? Well, here again the findings are mixed. There is some evidence that companies in which managers own more stock exhibit higher market-to-book ratios than companies in which managers own less stock. Furthermore, some studies show that market-to-book ratios are also positively related to the percentage of executive compensation that is tied to stock options and restricted stock. But what is the cause and effect? Does stock-based compensation for managers lead to higher market-to-book ratios, or do managers of companies with high market-to-book ratios demand stock-based compensation and managers of mature companies with low market-to-book ratios simply ask for other forms of compensation? We don’t really know.
What we do know is that whatever connection exists between pay and stock prices or shareholder returns is explained by annual and long-term incentive compensation, not by the base or fixed salary. We also know that that executive pay is most sensitive to performance in the manufacturing and financial industries and least sensitive among public utilities. And we have evidence that suggests that executive pay is more sensitive to performance in smaller than in larger firms. Finally, it seems that pay became more sensitive to stock price performance in the latter half of the 1990s. But is this merely a statistical artifact, given that equity prices rose through the 1990s, or is there really a cause-and-effect relationship? We are about to find out.
PAY AND PERFORMANCE IN 2000
In March 2000, the NASDAQ peaked at a little over 5000; in June 2001, it hovered at around 2000, for a loss of over 50 percent. Over the same period, the S&P 500 index fell from over 1500 to 1200, for a decline of 20 percent. During this same period, corporate profits fell, and many financial and economic observers worried that we either were in or were about to enter a recession. So, what happened to executive compensation, and especially to performance-based compensation involving stock options?
Well, in absolute terms, executive compensation continued to increase. Cash compensation for CEOs of large U.S. companies increased by 10 percent in 2000, compared to 5.2 percent in 1999 and 5.2 percent in 1998.4 With stock prices off by 20 to 50 percent, is this what is meant by ‘‘pay for performance’’?
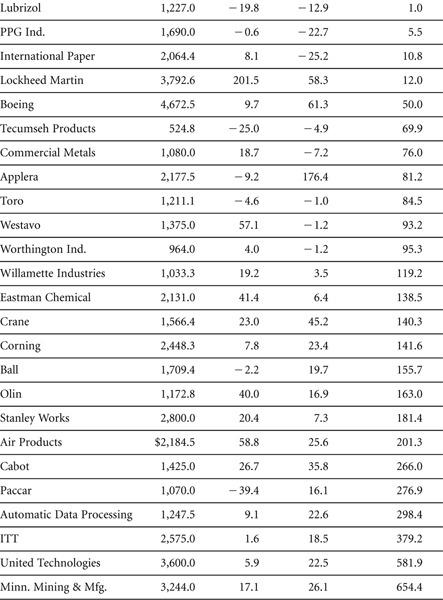
Take a look at Figure 8-3. Panel A contains information about CEO compensation in 2000 for forty-five large industrial and basic material companies whose stock underperformed industry peers. Absolute one-year shareholder returns are also included in the figure, and only five of the companies showed shareholder gains and not losses. The CEOs of thirty of these companies (67 percent) saw their salary and bonus increase over 1999.
Panel B contains comparable data for the companies whose one-year stock price performance was better than that of their industry peers. Here, as expected, twenty-one of the twenty-eight CEOs were awarded increases in salary and bonuses. Interestingly, though, six of the eight CEOs who saw a reduction in compensation led companies whose absolute shareholder returns were negative.
Given the limited sample size, both in numbers and in years, one must be very careful about generalizations. However, the early returns from 2001 suggest that executive pay did fall in response to the declining fortunes of many companies. A survey of 100 companies conducted by William M. Mercer, Inc., for the Wall Street Journal found that salaries and bonuses of CEOs dropped by 2.9 percent to $1.24 million in the face of a 13 percent drop in profits.5
However, evidence to the contrary also exists. There were some very-high-profile cases in 2001. For example, Richard McGinn, a former CEO of Lucent Technologies, was granted $12.5 million in severance pay when he was ousted in October 2000 after Lucent missed financial targets and the SEC began to look into potential accounting irregularities. Former Enron CEO Kenneth Lay sold $70.1 million of stock back to Enron between February and October 2001. Then, in mid-October, Enron reported very large losses attributable to partnerships run by Enron executives. And in January 2002, Kmart directors dismissed Charles Conaway as chairman five days before Kmart filed for bankruptcy. However, the directors left him in charge of the company as CEO, paid him a bonus of $6.6 million, and forgave a loan of $5 million that the company had made to him for as long as he worked for the company.6
FIGURE 8-3 CEO COMPENSATION IN 2000


Critics further point to the frequency with which managerial stock options that were ‘‘under water’’ were repriced as stock prices fell. By under water, we mean that the exercise price was so far above the current market price that the likelihood of the market price ever exceeding the exercise price was almost nil. For example, suppose NewEconChip awarded its managers stock options with an exercise price of $75 a share when the market price was $75 a share. As the market price rose to, say, $100 a share, these managers were holding valuable options permitting them to buy stock at $75 that was selling for $100. But, suppose the stock price of NewEconChip, like the stock prices of many technology companies in 2000 and 2001, fell, going to $30. Now the options had no value. And if the prospects were such that the company was not likely to again see a stock price of $75 before the options expired, how much use were they for aligning the interests of managers with shareholders?
What many companies did was to effectively reprice the options; in effect, the exercise price was lowered from $75 to $30 a share. (But this was disguised through a variety of legal devices so that it did not violate Internal Revenue Service regulations.) The rationale was that this was necessary in order to motivate the managers. But the critics asked the following question: If repricing is appropriate when stock prices fall, why not when stock prices rise as well?