
10
Using Traffic Analytics
In the previous chapter, we covered recipes for effectively using Microsoft Sentinel.
In this chapter, you will learn how to collect NSG flow logs from virtual machines (VMs) to monitor and analyze network traffic.
By the end of this chapter, you will have learned the skills required to carry out the following recipe in secure Azure AD:
- Implementing traffic analytics
Technical requirements
This chapter assumes that you have an Azure AD tenancy and an Azure subscription from completing the recipes in previous chapters of this cookbook. If you skipped straight to this section, the information needed to create a new Azure AD tenancy and an Azure subscription for these recipes is included in the following list of requirements.
For this chapter, the following are required:
- A device with a browser, such as Edge or Chrome, to access the Azure portal: https://portal.azure.com
- An Azure AD tenancy and Azure subscription; you may use existing or sign up for free: https://azure.microsoft.com/en-us/free
- An Owner role for the Azure subscription
Terminology reference
We will start with some of the terminology used in traffic analytics:
- Network security group (NSG): This controls network traffic flow into and out of a VM via a network interface
- NSG flow logs: We can capture information about every packet that flows into and out of the VM (ingress and egress)
- Log Analytics: This service allows us to perform analytics on data sent to Azure Monitor and stored in a Log Analytics workspace
- Network Watcher: This is a network health service that allows us to monitor, view metrics, and diagnose network-level traffic
Now that we have covered some related terminology, we will move on to our first recipe for this section.
Implementing traffic analytics
Traffic analytics provides rich visual representations of network packet information made available by NSG flow logs. The NSG flow logs capture network traffic information, such as IP address source and destination, and the packet’s port and protocol used.
This recipe will teach you how to implement traffic analytics with NSG flow logs.
Getting ready
This recipe requires the following to be in place:
- A device with a browser, such as Edge or Chrome, to access the Azure portal: https://portal.azure.com
- Access to an Azure subscription, where you have access to the Owner role
- A Windows Server Azure VM with an NSG to use with this recipe; we will step through creating this VM and NSG as a getting-ready task
Continue with the following getting-ready tasks for this recipe:
- Creating a VM
- Creating a Log Analytics workspace
A getting-ready task – creating a VM
- In the search bar in the Azure portal, type virtual machines and select Virtual machines from the listed Services results.
- Click Create from the top-left menu bar on the Virtual machine screen and select Azure virtual machine.
- On the Basics tab, under the Project details section, set the Subscription as required.
- Click Create new for Resource group.
- Enter a Name and click OK.
- Under Instance details, set the following:
- Virtual machine name: Type a name
- Region: Select a region
- Availability options: Select No infrastructure redundancy required
- Security type: Select Standard
- Image: Select Windows Server 2019 Datacenter – X64 Gen2
- Size: Leave the default (or set it as required to reduce recipe costs.
- Under Administrator account, set Username and Password as required.
- Under Inbound port rules, set Public inbound ports to Allow selected ports.
- Set Select inbound ports to HTTP (80), HTTPS (443), and RDP (3389).
- Click Next : Disks, leave the default values, then click Next : Networking.
- Under Network interface, leave the default values for Virtual Network, Subnet, and Public IP.
- Ensure NIC network security group is set to Basic.
- Leave Select inbound ports to the settings set in step 9: HTTP (80), HTTPS (443), and RDP (3389).
- Tick the Delete public IP and NIC when VM is deleted box.
- Click Review + create.
- Click Create on the Review + create tab once validation has passed.
- A notification will display that the resource deployment succeeded
The first getting-ready task for this recipe is complete.
Getting-ready task – creating a Log Analytics workspace
- In the search bar in the Azure portal, type log analytics workspaces and select Log Analytics workspaces from the listed Services results.

Figure 10.1 – Search for the resource
- On the Log Analytics workspaces screen, click Create from the top-left menu bar.
- On the Basics tab of the Create Log Analytics workspace screen, select a value in the Subscription and Resource group fields as required in the Project details section.

Figure 10.2 – Create Log Analytics workspace
- In the Instance details section, enter a value for Name, select a value in the Region drop-down menu, and then click Review + Create.

Figure 10.3 – Set Instance details

Figure 10.4 – Create a workspace
- You will be notified that the deployment was successful.
The getting ready task for this recipe is complete.
You are now ready to continue the main tasks for this recipe of implementing Traffic Analytics.
How to do it…
This task consists of the following step:
- Implementing Traffic Analytics
Task – implementing Traffic Analytics
- Sign in to the Azure portal: https://portal.azure.com.
- In the search bar, type network watcher; click Network Watcher from the list of services shown.

Figure 10.5 – Search for the resource
- On the Network Watcher page, click NSG flow logs in the Logs section of the left-hand menu.
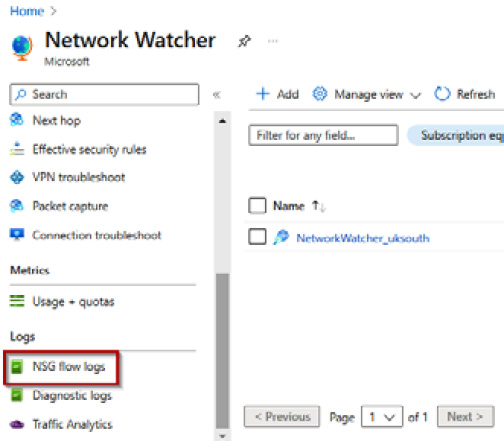
Figure 10.6 – NSG flow logs

Figure 10.7 – Create NSG flow logs
- Select a value in the Subscription drop-down menu as required from the Basics tab on the Create a flow log page, and then click Select NSG.

Figure 10.8 – Select NSG
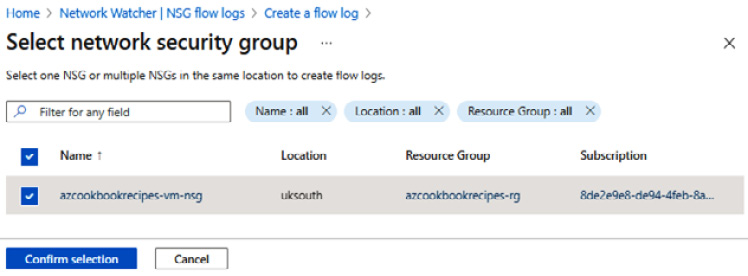
Figure 10.9 – Confirm selection of NSG
- In the Instance details section, click Create a new storage account.

Figure 10.10 – Instance details settings
- On the Create storage account blade, enter a value in the Name field, select a value from the Resource group drop-down menu, and then click OK.

Figure 10.11 – Create storage account
- Click Next : Configuration.
- On the Configuration tab, in the Traffic Analytics section, check the Enable Traffic Analytics box. Set the Traffic Analytics processing interval to Every 10 mins; select the name of the Log Analytics workspace we created in the getting-ready task if not already selected in the Log Analytics Workspace drop-down menu, and then click Review + create.

Figure 10.12 – Review and create a storage account
- On the Review + Create tab, click Create.
- You will be notified that the deployment was successful.
- When you navigate back to the Traffic Analytics page, you will notice that you have to wait for some time for data to be logged.
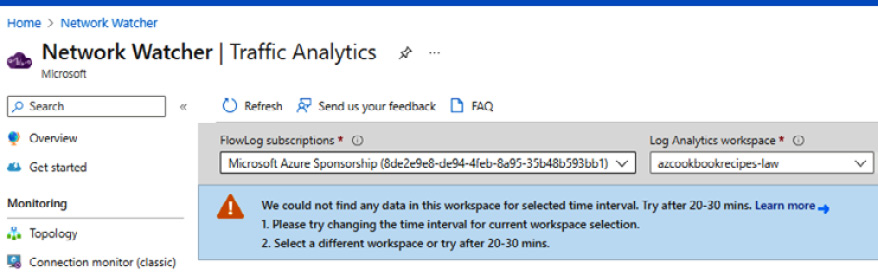
Figure 10.13 – Traffic Analytics blade
This task is completed. In the next task, we will clean up the resources created in this recipe.
Task – clean up resources
Perform the following steps:
- In the search bar in the Azure portal, type resource groups, and select Resource Groups from the listed Services results.
- On the Resource groups page, select the resource group we created for this recipe, and click Delete resource group; this will delete all the resources created as part of this recipe.

Figure 10.14 – Delete resource group
This task to clean up the resources created in this recipe is complete.
How it works…
For this recipe, we looked at implementing Traffic Analytics. The raw Network Watcher NSG flow logs are aggregated and stored in a Log Analytics workspace. These reduced stored logs then have geography, security, and topology enhancements added and then passed for analysis, allowing visualization of traffic patterns.
To perform NSG traffic analysis, you must have a Network Watcher enabled in each region where you have NSGs. We created a VM as a getting ready task that enabled a Network Watcher in our environment; an existing Network Watcher could be used if one already existed.
The following are usage scenarios and insights that can be gained with Traffic Analytics implemented:
- Find traffic hotspots
- Visualize traffic distribution by geography
- Visualize traffic distribution by virtual networks
- View ports and VMs receiving traffic from the internet
See also
Should you wish to learn more about this and related topics, you can refer to the following Microsoft Learn articles:
- Traffic analytics: https://learn.microsoft.com/en-us/azure/network-watcher/traffic-analytics
- Usage scenarios: https://learn.microsoft.com/en-us/azure/network-watcher/usage-scenarios-traffic-analytics
- Traffic Analytics – frequently asked questions: https://learn.microsoft.com/en-us/azure/network-watcher/traffic-analytics-faq
- Azure Network Watcher documentation: https://learn.microsoft.com/en-us/azure/network-watcher/
- Introduction to flow logging for network security groups: https://learn.microsoft.com/en-us/azure/network-watcher/network-watcher-nsg-flow-logging-overview