IN THIS CHAPTER
Determining Working Capital
Tracking Changes in Working Capital
Tracking Cash Flow
We all like cash. Cash is liquid — you can spend it. As distinct from, say, a barrel of oil or a bushel of wheat, you know pretty closely how much it will be worth next week or next month. Stashed into the right money market instrument, it can even earn some interest, enough to slow, even if just slightly, the erosion of inflation.
But cash isn't really working for you. It just sits there, ready to meet upcoming obligations, perhaps newly converted from accounts receivable or deposited from an investor's capital infusion or a creditor's loan. Cash isn't really pulling its weight.
But it is a current asset and obviously it has value. Other current assets have value, and they are invested in creating income. Inventory, if you're regularly turning it over, contributes to your profits. Accounts receivable, if you're collecting them regularly, turn your older investments into cash you can use to make new investments. Prepaid expenses are viewed as unexpired assets: that is, assets that have not yet been used, such as the remaining coverage on a 12-month fire insurance policy.
Of course, you normally have liabilities that make claims on those assets. Accounts payable, salaries payable, and so on are typical current liabilities, those that are coming due within the next year. Because these liabilities already exist as claims on your assets, any accurate assessment of the company's resources has to take account of those obligations. A $500,000 balance in a bank account means less when you consider that you have $490,000 in accounts payable.
This sort of consideration leads to the notion of working capital, a concept that's much broader than just cash on hand. It encompasses all the assets that the company could, in the normal course of business, convert to cash in the near future, and takes account of the liabilities that must be met in the same time frame.
Working capital is a realistic view of the extent of the resources you have available. Examining how and why its value changes over time can give you a good sense of how a company has been managing its assets.
Working capital has a deceptively simple definition: current assets minus current liabilities. That is, working capital is the amount of a company's assets that can be converted to cash in the near future, taking into account the payments that have to be made. The result is the amount of funds available for investment to generate new business.
QuickBooks makes it easy to calculate a company's current assets and current liabilities, and therefore its working capital, as of any date that the company has been in business.
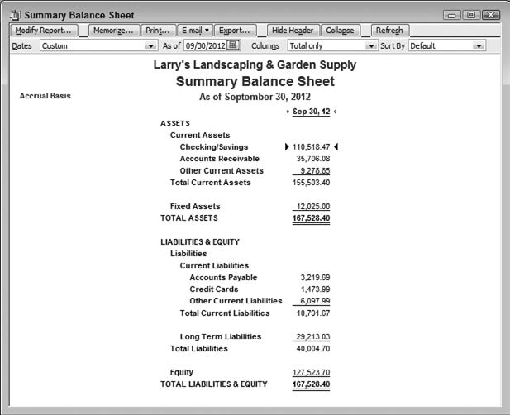
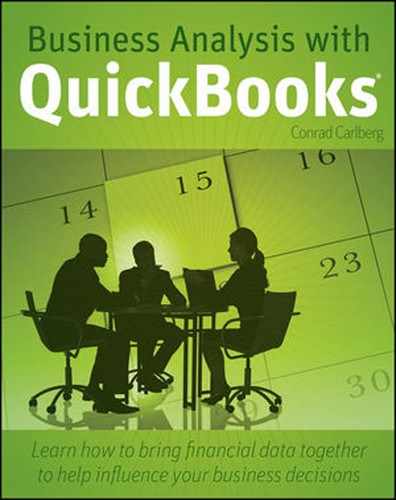
Figure 5.1. The Balance Sheet Summary is a handy way to get balances for the major account categories.
Figure 5.1 shows a summary balance sheet as of the end of the company's fiscal year for Larry's Landscaping, a sample company included with the QuickBooks software. It will be necessary to use a more complex version of the balance sheet later in this chapter, but the information in Figure 5.1 is all that's needed to calculate the company's amount of working capital.
With the definition of working capital in mind, it's easy to see that the company has $155,503.40 in current assets, $10,791.67 in current liabilities, and therefore $155,503.40 – $10,791.67 = $144,711.73 in working capital.
It's helpful to get a sense of what does and doesn't have an effect on the amount of working capital available, because that can clarify the concept.
The first aspect to notice is that any change involving only current accounts has no net effect on working capital (Figure 5.2 shows an example).
Paying a $100 bill on October 4 reduces a bank account — and therefore current assets — by $100. That also reduces accounts payable by $100, so there is no net effect on working capital. But, obviously, the components of working capital are changing constantly.
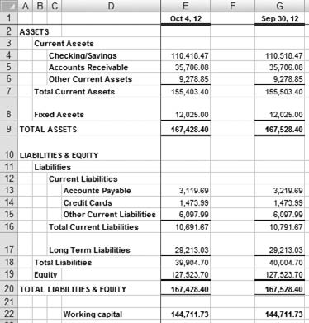
Figure 5.2. Satisfying an account payable involves only current accounts, and there is no effect on working capital.
Similarly, when a customer sends a check for $200 to pay an invoice, you reduce accounts receivable by $200 and increase a bank account (even if only eventually via undeposited funds, another current asset) by $200. No change to total current assets, so no change to working capital.
If you have an algebraic turn of mind, you might consider the following sequence, beginning with the fundamental accounting equation Assets = Liabilities + Equity.
Now, using these abbreviations,
CA = Current Assets
NCA = Noncurrent Assets, including both fixed and other assets
CL = Current Liabilities
NCL = Noncurrent Liabilities, including long-term and other liabilities
we can get to an algebraic definition of working capital:
CA + NCA = CL + NCL + Equity
CA - CL + NCA = NCL + Equity
Working Capital + NCA = NCL + Equity
Working Capital = NCL + Equity - NCA
Figure 5.3. A change in the balance of a noncurrent account often, but not always, changes the amount of working capital.
So, as distinct from changes involving only current accounts, a change to a noncurrent account (a noncurrent asset, a noncurrent liability, or an equity account) can change the amount of working capital. If Rock Castle Construction takes out a three-year loan for $15,000 and deposits the funds in a bank account, working capital increases by $15,000. The liability account that records the loan is a long-term liability, not a current liability. So current liabilities remain unchanged and both current assets and working capital increase by $15,000 (see Figure 5.3).
Of course, a company's primary source of working capital in the long run is net income, the excess of revenues over expenses, and that's the principal financial reason for being in business at all. From an accounting perspective, how do current assets such as inventory and accounts receivable get to be noncurrent, so that they affect working capital?
Don Lenney starts a new company called Goleta Floors, a sole proprietorship, at the end of April and provides it with startup funds by depositing $25,000 in its bank account. At this point, the company has no liabilities, current or otherwise, and a current asset (and owner's equity) of $25,000. The company's working capital is therefore $25,000 at the outset. Lenney then records the following transactions:
A deposit of another $15,000 from his personal funds into the company's checking account, and also recorded as paid-in equity.
The purchase of $28,000 in inventory for resale.
The sale of $21,000 worth of inventory for $33,000.
The receipt of $15,000 in payments from customers for their $33,000 worth of purchases. Those payments post first into Undeposited Funds, and then post into the company's checking account. The total of the customers' outstanding balances, $18,000, remains in accounts payable.
The receipt of bills for the $28,000 worth of inventory from his vendors, and the payment of $18,000, leaving $10,000 in accounts payable.
Lenney pays $8,500 in various operating expenses such as travel and communications.
Lenney also purchases a small, two-room office in a shopette for $22,000, paying for it with $15,000 in cash and $7,000 from a six-month bank loan.
The withdrawal of $1,000 for his personal use, as an owner's draw.
Figure 5.4 shows a P&L report for Goleta Floors as of the end of May.
The net income of $3,500 during May acts as a source of working capital. To see how it gets there, first see Figure 5.5. There, the assets portion of the balance sheet shows that the current assets, including cash, accounts receivable, and inventory, total $37,500.
Figure 5.6 shows the Liabilities and Equity section of the balance sheet. The current liabilities entry provides the other number you need to find the working capital.


Figure 5.5. $22,000 of current assets have been converted to fixed assets by the purchase of the office space.
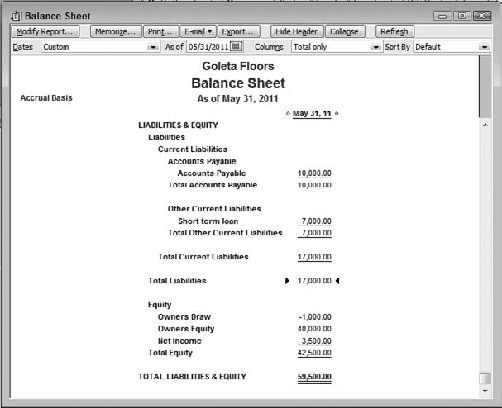
Figure 5.6. Notice that the net income shown on the P&L in Figure 5.4 flows to the Balance Sheet Equity section.
Current assets of $37,500 less current liabilities of $17,000 result in working capital of $20,500. Goleta Floors started out with $25,000 in working capital. It has earned $3,500 in net income. But its cash account has fallen to $12,500 and its working capital is down from $25,000 to $20,500.
How does this come about? Looking into the matter helps you get a clearer understanding of how the company does business. Each transaction listed later has an effect on the amount of working capital available, subsequent to Lenney's initial $25,000 investment. Be sure you see that none of the transactions involves solely current accounts. Other activities the company undertakes, such as purchasing inventory, are not listed because they involve only current accounts and therefore have no net effect on working capital.
Lenney's second investment increases working capital by $15,000 to $40,000.
Product sales bring in $12,000 in gross profit, increasing working capital to $52,000.
The company pays $8,500 in operating expenses, decreasing working capital to $43,500.
A check for $15,000 is written as a partial payment for the office space. Working capital is now $28,500.
Accounts payable is increased by $7,000 as a result of the short-term loan to pay the remaining balance owed on the office space. Working capital is $21,500.
Lenney withdraws $1,000 for his personal use, decreasing both his equity and working capital by $1,000, leaving working capital at $20,500.
So, after the initial investment of $25,000, various purchases, sales, and other transactions reduce the company's working capital to $20,500. This amount agrees with the result of subtracting, on May 31, current liabilities from current assets. It's obviously a lot quicker to do one simple subtraction than it is to trace every transaction during the period, particularly when a company typically has many more transactions than the six listed earlier.
This simple subtraction is informative, certainly — it's the quickest way to determine working capital and therefore how it varies over time. But it doesn't give you any real insight into how the company is carrying out the process of investing and disinvesting that creates profit (or loses it).
The first step in that direction is to put together a statement of changes in financial position. This is usually done by categorizing the components, not according to when they occurred — as in the preceding list — but according to whether transactions constitute sources of working capital, or uses of working capital. In the current example, you can categorize the transactions as shown in Figure 5.7.
Any transaction that involves changes to both a current and a noncurrent account is either a source or use of working capital: It causes funds to flow into or from the company. These transactions either increase or reduce working capital. The transactions shown in Figure 5.7 conform to that condition. Lenney's second investment of $15,000 increases Owner's Equity (noncurrent) as well as the Cash account (current) and is therefore a source of working capital.
Similarly, the net income of $3,500 for the month is the excess of sales (current account) over costs and expenses (current accounts). At the close of an accounting period, these funds are transferred as net income to the retained earnings account (a noncurrent, equity account). At that point, the net income becomes a source of working capital, involving the transfer from current accounts to the noncurrent account.
Figure 5.7 also shows the usage of working capital. The office, a fixed asset, was acquired with the use of cash (a current account) and a short-term note (another current account). The funds left the company, so this transaction was a use of working capital. Last, when Lenney withdrew $1,000 for his personal use, both the current account Cash and the noncurrent Owner's Equity were decreased, establishing the transaction as a use of working capital.
Notice the agreement between the two approaches to calculating the change in working capital shown in Figure 5.7. You can subtract the uses of working capital (cell E5) from the sources (cell E2) and find that the change in the company's working capital is negative, a decrease of $4,500. You can also subtract the working capital at the end of April from that at the end of May, and get the same decrease of $4,500.

Figure 5.7. A review of noncurrent accounts explains the reasons behind changes in working capital, not the amount of working capital itself.
Looking at changes in financial condition from the point of view of sources and uses is more informative than merely calculating the overall change, and these sources and uses appear perfectly reasonable for a newly established company. Working capital did drop during the first month, and that situation cannot continue — if it does, the company will run out of resources and be forced to suspend operations or close entirely. But the principal use of working capital, the purchase of office space, is very likely a nonrecurring cost. And the secondary investment by the owner is probably also a nonrecurring event. If you take those two transactions out of the mix, the company's working capital would have increased by $2,500 instead of falling by $4,500.
The notion of working capital focuses on assets that are available for use in the near term as well as liabilities that must be satisfied in the near term. It is the difference between the two amounts, so the amount of working capital is the company's accessible assets less the near-term liabilities that it has already incurred. It is the amount of resources available to invest in new business, by converting cash to equipment, hiring additional staff, purchasing additional inventory, and so on.
Earlier in this chapter, I noted that transactions involving only current accounts have no net effect on the amount of working capital. That sort of transaction affects the components of working capital, of course, but not the result of subtracting current liabilities from current assets.
The same is true of noncurrent accounts. A transaction that does not involve a current account does not change the amount of working capital. An example is depreciation.
Suppose your business owns a truck that it bought for $20,000. You keep it on your books as a fixed asset worth $20,000. But the truck loses value over time — that is, it depreciates — and you record that amount of loss periodically. The amount of loss you record is determined by which one of several methods for determining depreciation you and your accountant decide on.
That method might tell you to record $300 in depreciation for the first month your company owned the truck. You record $300 as a debit to an expense account, perhaps named Depreciation, and also as a credit to a fixed asset account, perhaps named Truck:Accumulated Depreciation. Neither account is a current asset account, therefore the transaction has no effect on working capital.
Note
Although depreciation is recorded in expense and in fixed asset accounts, and thus does not affect working capital, it still needs to be accounted for when you're calculating working capital. This issue is explained in the "Tracking changes in working capital" section of this chapter.
There are some transactions that are typical in the increase and decrease of working capital. Among them are the following:
Net income. The sale of product for more than it cost to acquire the product is a typical source of working capital. But net income often must be adjusted before adding it in with other sources. The reason is that some expenses that are subtracted from gross profit to arrive at net income do not involve current accounts. In fact, one of the purposes of analyzing the sources and uses of working capital is to clarify the reasons for a difference between net income and working capital provided by a company's operations.
Acquisition of fixed assets. Buying equipment with cash, including cash obtained via borrowing, is a typical use of working capital. Acquiring the asset in exchange for stock involves no current account and has no effect on working capital.
Paying off long-term debt. Assuming, as is usually the case, that a company uses current assets to retire a long-term debt, paying off the debt is a use of working capital. A long-term debt is not carried in the current accounts payable liability account.
Acquiring long-term debt. When a company takes out a long-term loan, the money borrowed goes into a current asset, usually a cash account. The company also acquires a noncurrent liability, the debt itself. This transaction involves a current asset and a noncurrent liability, and is therefore a source of working capital.
Selling a fixed asset. A company might occasionally sell equipment, a building, or even land in return for cash, because the company no longer has use for the asset or is in desperate need of funds. This involves a current and a noncurrent account and is therefore a source of working capital. Suppose the asset is sold at a loss: A building purchased for $200,000 in 2005 is sold for $150,000 in 2009. Even though the sale represents a loss, it nevertheless increases working capital by $150,000.
It's helpful to know that a company has increased — or decreased — its working capital from one period to the next. Knowing that is often more helpful than knowing the change in cash assets, or net sales, or even net income. But merely knowing that a company's working capital increased by $103,355.59 during 2011 doesn't help you to understand how it's being managed. It's good to know that the company has over a hundred thousand dollars more to work with, but whether you're a potential employee, a manager, a stockholder, or creditor, you should want to know more.
What's the main source of the increase in working capital?
Long-term debt? Then maybe you should be extra careful about loaning the company more money.
A recent stock issue? If newly floated shares were snapped up, maybe you should seriously consider the job offer they gave you.
Net income? The only people who are unhappy when net income builds a company's working capital are the short-sellers.
The route to learning how and why a company has experienced an increase or a decrease in working capital begins with the balance sheet, as shown in Figures 5.8 through 5.11.

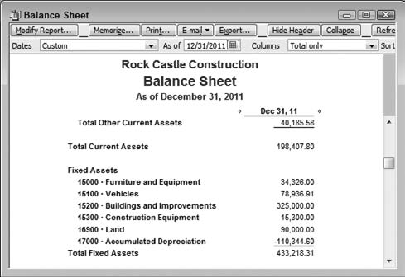
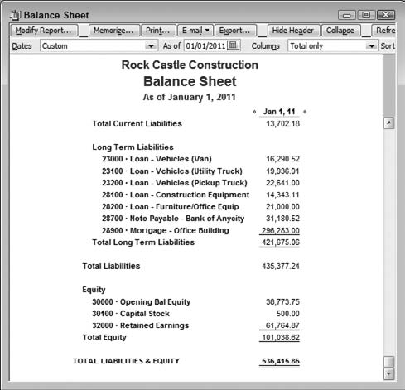
Figure 5.10. Notice that there is no Net Income account listed; it was restated in Retained Earnings at the start of the fiscal year.

It will help to bear in mind a few aspects of the balance sheet excerpts shown in Figures 5.8 through 5.11.
Figures 5.8 through 5.11 display selected accounts: in particular, total current assets and liabilities, and the long-term liability and equity accounts. Because of the way working capital is tracked, only the totals of the current accounts, and the specific noncurrent accounts, are needed.
To track increases and decreases in working capital during an accounting period, and to determine why those changes occurred, you need to know several account balances at the beginning and at the end of the period.
QuickBooks automatically sweeps the net income from one fiscal year into a Retained Earnings account on the first day of the next fiscal year. This gives you zero dollars in net income at the start of the year, which is convenient for a variety of reasons. One reason is that your net income figure at the end of the fiscal year represents the amount of net income for the full year, unmixed with amounts from prior periods.
To keep everything as neat and tidy as possible, it's a good idea to compare balance sheet accounts on the first day of the fiscal year with the final day of the year. You might think that the Balance Sheet Prev Year Comparison report would do that, but it reports the final day of both the current and the previous year. You cannot tweak that report to show the first day of the year and the last day of the year. Therefore, use the Balance Sheet Standard report for the working capital analysis. Run it twice: once as of the first day of the period, and once as of the final day.
Note
If you use the Premier Accountant or Enterprise edition of QuickBooks, you have access to a tool that enables you to build a single balance sheet that shows the first and last days of a given year. Depending on the year of release of your software, this tool might be called the Financial Statement Designer or the Intuit Statement Writer.
The Balance Sheet Summary report can be a handy one, because it does not drill down through as many levels of subaccounts as does the standard balance sheet. Using it, you can often get a useful account summary report on one sheet of paper. Still, it gives you enough detail that you can compare total current assets with total current liabilities and come up with a current amount of working capital.
However, it's not usually enough simply to know the amount of working capital. You want to know how and why it varies over time, and for that you need access to balances in specific non-current accounts.
QuickBooks does not supply a built-in analysis of working capital and its report options are not flexible enough to enable you to cobble one together. The best way is to export the balance sheets to an Excel workbook and use its linking capabilities to put the analysis together.
There are several ways to get the data from a report such as the Balance Sheet Standard into an Excel worksheet. Chapter 2 goes into more detail on this topic. Probably the worst way is to try to type the values you see in a report directly into a worksheet's cells. One handy (if not bulletproof) method is to export the report to an Excel workbook and insert a new worksheet in that workbook. Then, enter formulas in the new worksheet that simply point to values you want to pick up from the exported sheet. For example, in a new worksheet named Sheet4, the cell that shows net income might contain the formula
=Sheet1!J20
You'll see the process illustrated in the remainder of this section.
If this is your first time through the exporting process it's going to seem painstaking and unwieldy. Once you work your way through it a couple of times you'll find that it quickly becomes second-nature.
Suppose you want to analyze the change in working capital for the Rock Castle Construction sample file that accompanies QuickBooks, for fiscal year 2011. Take these steps:
With the company file open, choose Reports

In the As Of edit box, enter the first date of the fiscal year (or, more generally, the accounting period) you want to analyze. In this example, that's 1/1/2011.
Click the Refresh button at the top of the report to update the balances per the date you entered in Step 2.
Click the Export button. In the Export Report dialog box, make sure that you select the option labeled A New Excel Workbook and then click Export. If Excel was not already running, QuickBooks opens it for you.
When the export is complete, switch to Excel. The exported report will be visible in a new, unsaved workbook. Double-click the active worksheet's tab (the tab at the bottom of the worksheet that says Sheet1). When you do so, it will become highlighted and you can type First Day. Press Enter to finish renaming the worksheet.
Select an empty cell in the worksheet; to make it easy to find later, I suggest a cell near the bottom of the balance sheet.
Type = (an equal sign), then click in the cell that contains the value for Total Current Assets. Type – (a minus sign) and click in the cell that contains the value for Total Current Liabilities. Press Enter. You have now calculated the working capital available on the first day of the fiscal year.
Switch back to QuickBooks. With the standard balance sheet report active, change the As Of date to the last day of the period. In this example, that's 12/31/2011. Repeat Steps 3 and 4 to export the report with the new date.
Switch back to Excel and if necessary activate the workbook with the closing date for the accounting period. Double-click its sheet tab to rename it Last Day.
With the Last Day worksheet still active, right-click its sheet tab and choose Move or Copy from the contextual menu to open the dialog box shown in Figure 5.12.
From the To Book dropdown, choose the workbook that contains the worksheet named First Day. Click the (Move to End) item in the Before Sheet list. Select the Create a Copy checkbox and click OK.
The workbook with both worksheets, First Day and Last Day, is now active. Switch to the workbook that contains only the Last Day worksheet and close it without bothering to save. You have already copied its important information into the other workbook.
Activate the Last Day worksheet and repeat Steps 6 and 7 to get the working capital on the final day of the fiscal year.

You now have an Excel workbook with these worksheets:
A worksheet named First Day that contains a balance sheet as of the first day of the fiscal year.
A worksheet named Last Day that contains a balance sheet as of the final day of the fiscal year.
(Possibly) a worksheet named QuickBooks Export Tips. You can delete this worksheet if you'd like. Right-click its sheet tab and choose Delete from the contextual menu.
To make sure you don't lose your work, you might as well save the workbook now, giving it a file name such as Working Capital Analysis. The next sequence of steps completes the numeric portion of the analysis. When that's finished, it remains for you to examine the sources and uses of working capital, as well as their dollar amounts, and to decide whether you regard them as reasonable and prudent.
In Figures 5.8 and 5.9, notice that the fixed asset Furniture and Equipment increases during the fiscal year. You will account for this increase when you build the analysis in the next sequence of steps.
Now compare Figures 5.10 and 5.11, and notice that there are three loans whose balances changed between the start and the end of the year: the loan for the van, for the construction equipment, and the note payable to the bank. Payments that reduce the principal of each loan are made during the year, constituting uses of working capital, and you're about to account for them as well.
The worksheet shown in Figure 5.13 contains the structure for the working capital analysis. The following steps make reference to its cell addresses.
To create the analysis, take these steps:
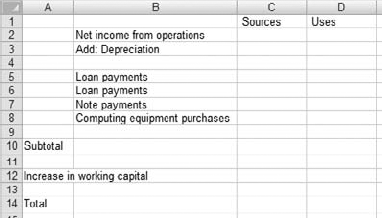
Figure 5.13. In practice you'll defer entering the labels in cells B5:B8 until you have finished linking to the balance sheets.
Insert a new worksheet into the workbook. Right-click any worksheet tab and choose Insert. In the Insert dialog box, select the worksheet icon and click OK.
Rename the new worksheet something such as Analysis Sheet.
Enter the labels shown in Figure 5.13.
Select cell C2 and type =. Do not press Enter.
Select the Last Day worksheet by clicking its worksheet tab. Select the cell in the balance sheet that has the total income for the fiscal year and now press Enter. That cell will be near the bottom of the balance sheet and will have the label Net Income to its left, in column A.
Select cell D5. Type =, activate the First Day worksheet, and click in the cell with the amount for the loan on the van and then type –. The partial formula in cell D5 should now look like this:
='First Day'!F46-
Activate the Last Day worksheet, click the cell with the ending balance for the loan on the van and press Enter. The formula in cell D5 in the analysis worksheet should now appear something like this (depending on the actual locations in the two balance sheets):
='First Day'!F46-'Last Day'!G58
Repeat Steps 6 and 7 for the construction equipment loan and for the bank note. Put the linking formulas in cells D6 and D7.
Repeat Steps 6 and 7 for the fixed asset Furniture and Equipment, putting the linking formula in cell D8. However, begin by selecting the Last Day worksheet instead of the First Day worksheet. The formula in cell D8 should look something like
='Last Day'!G21-'First Day'!F21
The idea is to get the differences in the account balances into the analysis sheet as positive numbers in the Uses column. Whereas the long-term liabilities tend to decrease over time, the fixed assets tend to increase over time. That is why the formulas for the liabilities subtract the last day from the first, and why the formula for the fixed assets subtracts the first day from the last.
Now get the change in working capital during the year. In the analysis sheet, select cell D12. Type =, activate the Last Day worksheet, and click in the cell where you entered the formula for the working capital at the end of the year. Type –.
Activate the First Day worksheet and select the cell that contains the working capital at the start of the year. Press Enter. Cell D12 now contains a formula that looks something like this:
='Last Day'!I73-'First Day'!H60
Select cell C10 in the analysis worksheet and enter this formula:
= SUM(C2:C8)
If necessary, reselect cell C10. Move your mouse pointer over the small black square on the cell's lower-right corner (its fill handle). Pressing the left mouse button, drag one column to the right. This autofills the formula into cell D10. You now have subtotals of the Sources and Uses of working capital during the fiscal year.
Select cell C14 and enter this formula:
=SUM(C10:C12)
No depreciation is recorded for the fiscal year ending in 2011, so don't worry about putting an entry in cell C3. (You can check the depreciation status by comparing the Accumulated Depreciation amount on the First Day worksheet with that on the Last Day worksheet.)
The report's appearance now resembles that shown in Figure 5.14.
Tip
To get the single and double underlines shown in rows 10 and 14 in Figure 5.14, right-click in a cell and choose Format Cells. Click the Font tab and choose Single Accounting or Double Accounting in the Underline dropdown.
Note
Even if you use the Rock Castle Construction sample file when you take these steps, you might not get precisely the same results. The sample files differ as to transaction amounts in different releases of QuickBooks, and what QuickBooks considers to be the current date also varies.
In Figure 5.14, the subtotal of the Sources and Uses of working capital that took place during the year is shown in row 10. Row 12 shows, as the Increase in Working Capital, the difference in the amount of working capital between the beginning and the end of the fiscal year. Notice that this figure brings into balance the totals of the Sources and Uses of working capital during the fiscal year, shown in row 14.
There is another, conceptually richer way of looking at this information. The company created $103,355.59 in working capital during the fiscal year (cell C2). It used $46,208.15 of that working capital (cell D10). The difference between the two amounts, 57,147.44, represents the change in working capital during the year — the amount of new working capital created but not used.
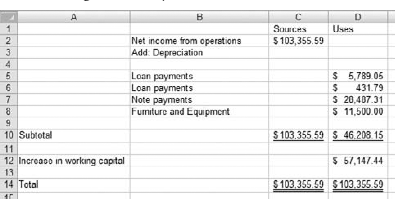
Figure 5.14. The totals balance and you can now apply your judgment regarding the company's use of working funds during the fiscal year.
Be sure you understand that the change in working capital shown in cell D12 comes from the comparison of current assets and current liabilities, not from subtracting the total Uses in D10 from the total Sources in C10. This issue is explored in the next section.
This analysis, as far as it goes, illustrates that the two ways used to calculate the change in working capital agree: the difference between working capital amounts at the beginning and the end of the fiscal year, and the difference between the total sources and uses of working capital during that year.
If the totals had not balanced, you would know there was an error somewhere and would have to start tracking it down. That they are in balance is not a guarantee that the analysis is error-free, but because they do balance it's now reasonable to look further into the nature of the Sources and Uses of the working capital.
For example, Figure 5.14 shows that the company used $11,500 in the Furniture and Equipment fixed asset account, but from the balance sheet alone you have no way of knowing whether the $11,500 went for workstations and servers or for a couple of gold-and-burgundy floral-pattern shower curtains.
Perhaps the quickest way to find out is, with QuickBooks active, to choose Lists
In this example, you don't have to go quite so far to learn about the way working capital was used to reduce long-term liabilities. The numbers are in the balance sheets (see Figures 5.10 and 5.11) to tell you that the balances on two loans and one note were reduced by $5,789.05, $431.79, and $28,487.31, as shown in Figure 5.14, for a total of $34,708.15.
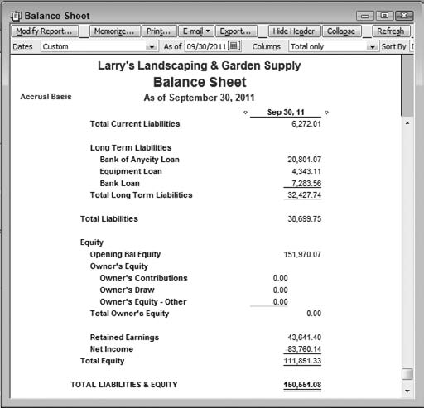
Another sample company file included with your QuickBooks software is Larry's Landscaping. Larry doesn't appear to be managing his company's resources quite as skillfully as the people running Rock Castle Construction. A working capital analysis is probably in order, and once again the Balance Sheet Standard report is a good place to start. Figures 5.16 through 5.19 show the assets and the liabilities portions of the company's balance sheet at the start and at the end of the fiscal year.
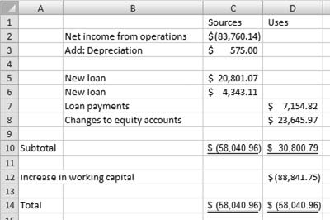
The procedures to move the balance sheets into Excel and to create the analysis worksheet are identical to the steps described in this chapter's previous two sections. There is one additional task: moving depreciation onto the analysis worksheet, which now appears as shown in Figure 5.20. As with other entries such as the partial retirement of loans, the entry for depreciation in Figure 5.20 is the difference between accumulated depreciation account balance at the beginning of the period and at the end of the period.
In the process of building an income statement, depreciation is subtracted from gross profit (among other expenses) to arrive at a figure for net income. The net income is then transferred to the balance sheets, as shown in Figures 5.18 and 5.19. Depreciation does reduce net income (and therefore plays a role in reducing corporate income taxes), but it does not reduce working capital: Recording depreciation is not a transaction that involves both a current account and a noncurrent account. Depreciation must be added back to net income to calculate the total of sources of working capital.
Don't let this step confuse you. Some people look at an analysis such as the one in Figure 5.20, see depreciation added to net income, and conclude that depreciation somehow increases a company's funds. It does not: The addition of depreciation to net income is simply the recognition that depreciation does not decrease working capital. Having been subtracted from gross profit to arrive at net income, depreciation must be added back in so as to accurately calculate working capital.
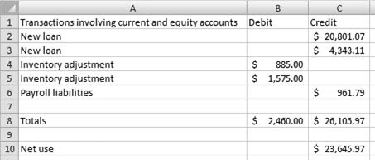
Note the entry of $23,645.97 as a change in equity accounts. If you examine the individual transactions in the company's Opening Balance Equity account, you see that over $40,000 was transferred between Opening Balance Equity and Retained Earnings. This transaction involves two noncurrent equity accounts, and therefore has no effect on working capital.
The remaining transactions in the Opening Balance Equity account involve current accounts (Payroll Liabilities, Inventory, and Checking/Savings) and result in a net use of working capital. Figure 5.21 details these transactions.
In all, the working capital analysis does not suggest that Larry's Landscaping is in great shape at the end of the 2010–11 fiscal year. It helps to highlight the existence of two loans taken out just prior to the fiscal year's end, and in the absence of further information, one would have to wonder if those loans were properly collateralized. A potential creditor or potential employee of this business would surely have plenty of questions to ask after seeing these figures.
Of course, it's a sample file, and so will probably remain solvent for several more editions of QuickBooks.

Figure 5.15. Greater detail in the working capital analysis gives you a better picture of how the company is using its assets.

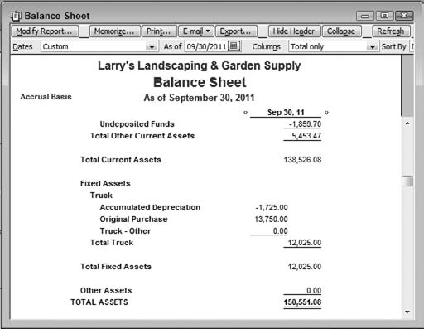
Figure 5.17. Compare to Figure 5.16. This company records $575 in depreciation during the year shown.

The previous two sections have arranged the export of balance sheets to Excel in a layout that requires the use of links to calculate the differences between account balances. For example, the working capital analysis sheet includes a formula for the change in a loan amount that points both at a worksheet for the starting date and at a worksheet for the closing date.
There are two reasons for this approach. One is that this book is principally about QuickBooks, and only secondarily about using Excel to augment analysis that can be done in QuickBooks. The second reason is that keeping the balance sheets separate emphasizes the notion of changes in account balances to explain changes in working capital.
But there is an option in QuickBooks that you should be aware of if you want to carry out working capital analysis on a routine basis — or any other analysis that requires the use of one or more QuickBooks reports as of different dates.
One default option for QuickBooks' reports is to show only nonzero accounts. With a report active, if you click Modify Report and then click the Advanced button in the Modify Report dialog box, you see the window shown in Figure 5.22.
With the default, nonzero option in effect, you can easily find an account in an end-of-year balance sheet that does not appear in the balance sheet as of the start of the year. In turn, this means that you cannot easily line up the rows to create your own comparative balance sheet.
However, if you select the All option, in the Display Rows area, for both balance sheets, you get the same accounts in both sheets regardless of their current balances, and they appear in the same rows on both sheets. The reason this is useful is that it makes it easier to get changes in account balances in Excel. Figure 5.23 has an example.
To get the differences in account balances between the start and end date, begin as described in the "Exporting the balance sheets to Excel" section. Once you have the Last Day sheet in Excel, select its contents — both the account labels and the dollar values — and copy and paste them in the First Day worksheet as shown in Figure 5.23.
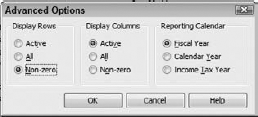
Figure 5.22. The Active option displays only rows with accounts (or other elements) that have any activity during the period covered by the report.
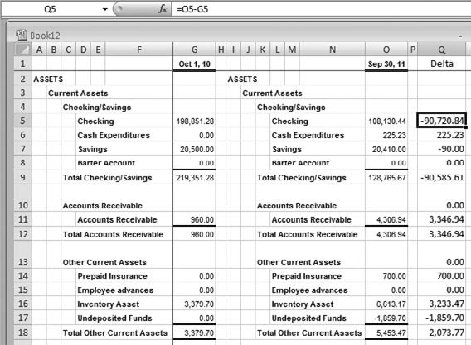
Then select the cell in the first row that contains dollar amounts, and in the first column to the right of the Last Day balances. In Figure 5.23, that's cell Q5. Enter a formula, as shown in the formula bar, that subtracts the value for the first day's balance from the last day's balance. Then, with that cell selected, copy it, and paste it down through the remaining rows in the report.
You now have the differences in the account balances. As you're assembling the working capital analysis (explained in the section "Deriving the working capital analysis from the account balances"), just link to the cells containing the differences.
The Statement of Cash Flows report is sometimes helpful in understanding changes in a company's financial position. An example, using the Rock Castle Construction sample file and based on the same date range as the earlier examples in this chapter, is shown in Figures 5.24 and 5.25. This report is available by choosing Reports
Some companies are small enough, and their financial activities sufficiently uncomplicated, that a cash basis for accounting makes sense: The additional and more accurate information provided by the accrual basis does not justify the added time and effort needed. Thus, if a company uses accrual as the basis for its accounting, income statements that allow for the accrual of income and expense are the best guide to the company's financial position. Furthermore, in an accrual situation, a working capital analysis is a better guide than a cash flow statement.
But cash is the most liquid of liquid assets, and the ways a company uses cash show how it goes about managing its investments and expenditures, as well as its disinvestments and receipts. A cash flow statement can also provide information in support of a working capital analysis.
The data in Figure 5.24, for instance, shows that the company had $103,355.59 in net income during the 2011 fiscal year. Figure 5.14 shows that the company had an increase in working capital of $57,147.44. How is it, then, that Figure 5.25 shows a net cash loss for the period?


Figure 5.25. The cash flow report can help reconcile a positive net income with a reduction in cash position.
The answer is found partly in the adjustments shown in Figure 5.24. There remains over $71,000 in accounts receivable — as-yet-uncollected receipts — and a relatively small amount in accounts payable, indicating that the company may have stayed more current in its payments than in its receipts. Furthermore, Figure 5.25 shows $34,708.15 in the reduction of principal on three loans and the expenditure of $11,500 on new equipment (which I established earlier was for PCs and a server).
All in all, the cash statement echoes the message of the working capital analysis: This is a healthy firm, with all its working capital during 2011 coming from operations. However, both the absolute amount of funds in Accounts Receivable, as well as the fact that it is more than five times greater than Accounts Payable, suggests that the company might want to revisit its collections procedures.