IN THIS CHAPTER
The flow of cash in and out of your business is an important gauge of how well you manage your resources. In an established business, it's not as crucial as net income and working capital, but it's still an important way to judge how well you're managing the process of turning products into cash and reinvesting in the business.
Cash management is even more important in the early days of a business, because the cushion is usually fairly thin. And if there's some way to forecast how much money is going to hit the Undeposited Funds account during the next month or two, well, that could be comforting information. Is there a good way to find out? Yes and no — read on.
If you explore the QuickBooks menu structure, you'll find several menu items that refer to forecasting: Set Up Forecast, Cash Flow Projector, Cash Flow Forecast, and so on. It's not necessary to explore all the fine distinctions between these procedures and these reports, but these two are useful when you need to watch your cash position: the Cash Flow Projector and the Cash Flow Forecast report.
Each tool brings something different to the job of forecasting your company's cash position. The Cash Flow Forecast report is more rigid than the Cash Flow Projector, but it does a better job of informing you about your Accounts Receivable. The Cash Flow Projector is an interactive tool, not a static report, but it has some traps that you need to know about before you trust what it tells you. This chapter explores both tools and shows you how to use them as complementary sources of information rather than competing alternatives.
Lots of QuickBooks users get confused about the Cash Flow Projector, and it's really no wonder. What is in fact a simple exercise in arithmetic, in adding receivables and subtracting payables, turns into mystic calculus. The whole point of using the Cash Flow Projector is to answer this question: Over the next six weeks, are my current cash assets, plus whatever additional revenue I expect to take in, enough to pay the bills coming due?
That's simple enough. We've all done that kind of analysis on a spare yellow sticky note during a moment of anxiety, at least when we were first building our businesses. Later on, we used a spreadsheet instead of a yellow sticky, but we're trying to answer the same question: Will I be able to pay my bills?
Before you begin using the projector, it helps to have made a few decisions:
What bank accounts would you tap for cash if you need to?
Do you want to manually enter the cash receipts you expect during the next six weeks, or do you want to use a forecasting equation?
Do you want to enter any upcoming expenses apart from the bills you've already recorded in QuickBooks as Accounts Payable?
Do you want to use bills that you've entered in Accounts Payable to estimate your near-term costs?
Completing the Cash Flow Projector takes several steps. You're expected to do the following, in line with those decisions:
Identify the cash accounts you're interested in.
Select a method to project cash inflows, and optionally adjust the projections as you see fit, for the next six weeks.
Select expenses that you expect to pay off during the next six weeks.
Review and adjust amounts and dates from upcoming Accounts Payable.
Review the resulting cash balances.
After reviewing the projected balances, you might want to transfer cash, step up sales efforts, do some belt-tightening, or merely stand pat.
The Cash Flow Projector puts these questions to you in a wizard. You'll see each step in the wizard later in this chapter.
Thinking back over those decisions and actions, you can infer that the Cash Flow Projector takes four basic steps:
It finds your current cash balance.
It asks you how much money you expect to spend during the next six weeks.
It asks you how much money you expect to take in during the next six weeks.
It takes your current balance, subtracts your costs, adds your revenues, and tells you the result.
It ain't multivariate calculus, folks.
A little reflection shows that there are three capabilities in the Cash Flow Projector that might convince you to use it in preference to other tools such as a spreadsheet or that yellow sticky note:
It identifies the cash accounts that will be of interest, and shows the current balance for each cash account.
It offers several ways to project six weeks of cash inflows. It creates these forecasts automatically or lets you specify them manually.
It identifies Accounts Payable dates and amounts that will come due during the six-week window.
Only the projection of cash inflows offers you something that's not entirely under your control. Although you decide when to meet business expenses and pay bills, you do not generally exert control over when customers will buy from you or how much cash you'll take in over the next few weeks. Therefore, it's useful to have a credible and rational way of projecting what those receipts will be, based on history.
Note
It's an overstatement to claim that you don't exert control over when or how much your customers are going to pay you. It's true that if you retail consumer goods, the state of the economy and consumer confidence drive your revenues more than any short-term action you can take. But if you manufacture critical parts for hybrid car engines, you're in the happy position of knowing that when you send an invoice it's going to get paid — probably net 15.
One reason the Cash Flow Projector mystifies many users is that it can be difficult to verify the cash receipts that form the basis for the forecasts. It helps a lot to know where those numbers come from.
The next section, "Running the Cash Flow Projector," gets into these issues in more depth, but for now it's useful to know that the projector can forecast your receipts for each of the next six weeks. (You can override this behavior and manually enter estimates of the receipts yourself, but manual entry is just one of the six forecasting methods that the projector offers.)
To create forecasts, the projector uses one of these periods:

Whether you choose the most recent six-week period or the six-week period that began 58 weeks ago, you can choose to use each week's total receipts or an average of the six weeks' total receipts. (The default option is a weighted average of the most recent six weeks.)
The projector shows you the weekly values (or their average), but it's helpful to compare that to a report. Here's how to create the report:
Choose Reports

In the From and To boxes, enter the beginning and ending dates that define the six-week period you want.
In the Columns list, clear each checked field name by clicking it. Click the following field names to give them checkmarks: Type, Date, Account and Debit (you'll have to scroll through the list to find all four).
In the Total By dropdown, choose Week.
Still in the Modify Report dialog box, click the Filters tab. Click on Account in the Filter list box. The Account dropdown appears. In the Account dropdown, click All Bank Accounts (see Figure 8.2).
Back in the Filter list box, choose Transaction Type. The Transaction Type dropdown appears. Click Multiple Transaction Types. A new window, Select Transaction Types, appears. Click Deposit, Sales Receipt, Payment and Transfer. Then click OK to close the Select box. (If you are creating this report for real, omit Transfer as a transaction type.)
Click OK to close the Modify Report dialog box.

The resulting report appears in Figure 8.7, so that you can compare it with the projector's preliminary results.
You might wonder why Step 6 advises you to include Transfer as a transaction type, along with Deposit, Sales Receipt, and Payment, and then warns you instead to omit it. You shouldn't include transfers as part of the normal procedure. But for the purpose here, you must include transfer transactions, to understand why the projector's results can be confusing.
You start the Cash Flow Projector by choosing Company

Figure 8.3. The Cash Flow Projector lets you base the projections on any accounts that might contain cash.
You can choose any or all of the available accounts in the Beginning Balance step — generally Bank accounts and Undeposited Funds (but subaccounts are not shown).
Note
The Undeposited Funds account is an extremely helpful but underused shoebox. You put checks in it to keep them together until you're ready to deposit them all at once. Using Undeposited Funds makes it possible for you to record the deposit of, say, 20 checks without winding up with 20 deposit receipts.
The Cash Flow Projector needs to know which accounts should be used because it will look back six weeks (or 58 weeks) from the current date to see how much cash has entered each account during each of those weeks. The projector then uses that recent history to project, or forecast, how much cash will come in during the subsequent six weeks.
For this example, I'll specify Checking to keep things simple, but there's another reason: The projector does not manage transfers between accounts properly. Suppose that four weeks ago, you deposited $5,000 into your checking account, and the next day transferred $5,000 from your checking account into your savings account.
If you now choose to pro ject cash flows using both the checking and the savings accounts, the Cash Flow Projector thinks you took in not $5,000 but $10,000; that is, the $5,000 you deposited into checking, plus the $5,000 you transferred out of checking and into savings. The projector's erroneous treatment of the transfer will have a disastrous effect on the accuracy of your projected cash position, as well as any receipts that you forecast using one of the automatic methods. Therefore, if you decide to use this tool, heed this:

Figure 8.4. Recent deposits might not appear until you force a recalculation by choosing a different projection method, and then return to Use a Weighted Average of Last 6 Weeks.
Once you've selected an account (or, if you must, accounts) by filling its checkbox, click Next to go to the Cash Receipts window, shown in Figure 8.4.
The projected cash receipts appear in the list box (labeled Itemized Cash Receipts), and also above the edit boxes (labeled Adjustment) where you can enter adjustments to the projections. Where do these projections, each of them 31,264 in this example, come from?
Notice the Choose a Projection Method dropdown. The currently selected item is Use a Weighted Average of Last 6 Weeks. It is the default selection when you first run the Cash Flow Projector, and it specifies the method that results in the projections of 31,264 in Figure 8.4. I have more to say about this method, not all of it good, later. First, here's a description of the other options in the Choose a Projection Method dropdown.
If you choose this option, the projected cash receipts shown in the Figure 8.4 disappear, and you can enter any numbers you want.
In this case, you presumably have some particular knowledge regarding the timing and amount of cash receipts that you can expect during the next six weeks. You might, for example, have access to a forecast of cash receipts from another source (see the "Going Outside QuickBooks to Project Receipts" section later in this chapter).

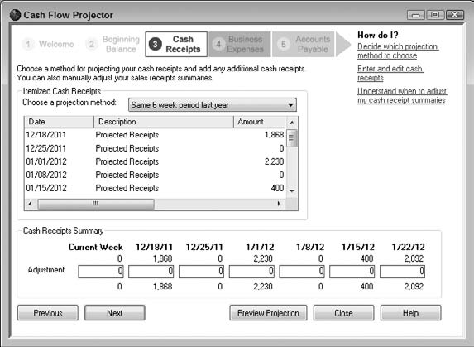
If you select this item, you are telling the projector to assume that your cash receipts for each of the previous six weeks will be repeated for the next six weeks. When you first choose a different projection method from the dropdown, you receive the warning shown in Figure 8.5.
There's no need for concern because you can always get the existing values back by returning to the current method, unless you've been entering cash receipts manually.
Tip
The Cash Flow Projector has a disconcerting habit of changing which accounts are selected in Step 2 (refer to Figure 8.3) when you change projection methods. It's a good idea to use the Previous button to check what's selected in Step 2 after you change the projection method in Step 3.
When you click Yes in response to QuickBooks' warning, the projector's Cash Receipts window looks like the one shown in Figure 8.6.
In Figure 8.6, the projector has replaced the projected receipts shown in Figure 8.4 with new amounts, in both the Itemized Cash Receipts box and the Cash Receipts Summary box. Because I started by selecting all accounts (see Figure 8.3), the projector looks back at dollar amounts entered in each account for the past six weeks, and assumes the cash receipts will be the same for the next six weeks.
You can verify the amounts by looking at a report with bank account debits on a weekly basis. One way is by means of the custom detail report, as shown in Figure 8.7.
You can see in Figure 8.7 that the cash receipts in Checking correspond exactly to those in the projector, shown in Figure 8.6.
Figure 8.8 charts the effect of taking the results of the prior six weeks and using them as a forecast of the next six weeks. This charting is easy to do in Excel, using an export from the QuickBooks report into an Excel workbook (see Chapter 2 for information on how to manage the export).
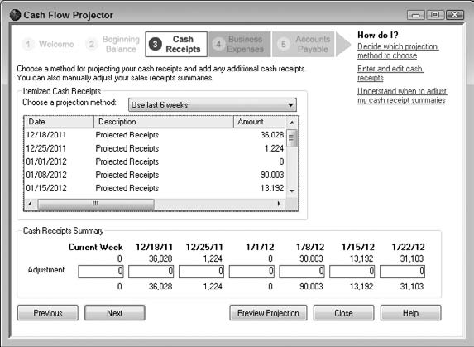
Figure 8.6. You can enter numbers in the Adjustment row to show any special revenue amounts that you expect during an upcoming week, but that are not anticipated by QuickBooks.
In Figure 8.8, look at what's been going on from January 2011 (shown in the chart as 1/11) through early October (shown as 10/11). It appears that for three weeks of any given month the cash receipts are relatively low, under $10,000, and during one week of the month the receipts spike to between $15,000 and $20,000.
More important, the cash receipts vary between $0 and $20,000 per week from January to October. Then the swings become much larger — look at the spikes of $30,000 and over $90,000 from October on.
The trend is clearly up during the fourth quarter, and to use the prior six weeks as the projection of the next six weeks is to ignore that trend. If this were a real company instead of a sample, I wouldn't be a bit surprised to see the actuals from the end of December and into January that were $10,000 higher than the projections (which are shown in the chart in Figure 8.8 as squares instead of diamonds).
The point to bear in mind is that there's no special reason to use the last six weeks as a stand-in for the next six weeks. It's better than nothing, though, and it could even be the best forecast you can make.
Furthermore, it's about a year better than the next option — unless you know that your business is highly seasonal.

This option from the Choose a Projection Method dropdown means that the forecast values are the same as the values one year earlier. Suppose that today is Thursday, December 15, 2011. The first week that will be forecast starts on Sunday, December 18, 2011. This projection method uses the actual value for a year earlier, the week of Sunday, December 19, 2010.
You can tell from Figure 8.9 and Figure 8.10 why these dates would be a bad choice for this company. Figure 8.9 shows the values from the projector.
Now look at Figure 8.10 which charts the forecast based on receipts from a year earlier in the context of the full year (again, the forecast receipts are shown as squares rather than diamonds).
If your business is highly seasonal, and if you can expect your sales during any given period to be much like they were 52 weeks earlier, you might want to use the Same 6 Week Period Last Year option. But I'd want three or four years worth of data, at the very least, to convince me. Maybe with more data I'd accept a projection like the one in Figure 8.10, where the bottom drops out of the cash receipts at the end of the year.

Figure 8.8. The six recent weeks are a lot better bet as forecasts than the six weeks from a year ago.

Note
When you're working with the mists and smokes of forecasts, it's easy to get lost in the numbers and forget where the data is coming from and how you want to use it. Figure 8.10 is a good example of this effect. If the business's revenues are highly seasonal, it's not at all implausible that the upcoming receipts could be as low as projected. On the other hand, if the business was just getting started one year earlier, the relatively low receipts could very well be due to its startup status, not to any seasonality that's inherent in its cash flows. There's no special reason to expect the company to act like a startup at the beginning of every fiscal year.
The preceding two methods, Use Last 6 Weeks and Same 6 Week Period Last Year, provide forecasts that vary from week to week in the same way that the actuals vary from week to week. If the six weeks prior to the current week had cash inflows of $100, $500, $200, $0, $800, and $300 then Use Last 6 Weeks forecasts $100, $500, $200, $0, $800, and $300 for the subsequent six weeks.
The same is true of the Same 6 Week Period Last Year option. The averaging methods explained next use the same periods as the preceding two methods, but they treat the data differently.

Another option in the Choose a Projection Method dropdown is Use an Average of Last Six Weeks. If you run the Cash Flow Projector every week, by using Average of Last Six Weeks you wind up forecasting next week's cash receipts by means of a moving average. That is, next week's forecast is always the average of the last six weeks; as time moves forward, so does the basis for the average — thus the term moving average.
In Figure 8.6, the projections, which are the actuals for the prior six weeks, are $36,028, $1,224, $0, $90,003, $13,192, and $31,103 (not visible in the projector's window). The average of those six values is $28,591. Figure 8.11 shows the result of choosing Use an Average of Last Six Weeks.
Used in this way — to provide a constant forecast value through several future time periods — the approach is called a random no-trend model. That is, applied to cash inflows, it assumes that the receipts are not trending up or down, and that any differences from week to week are due to random errors around the true long-term average.
(The errors would have to do with random events such as rainstorms that keep people at home, or overdrawn checking accounts, or a burglar breaking into your store and stealing all your stock, or a sudden, temporary, and one-time-only surge of customer interest in your product.)
Although this sort of single- forecast model has been popular in the past, it has become much less so as computing power has become generally accessible and applications such as QuickBooks and Excel have made it easy to create even slightly more sophisticated forecasts. A few people would argue that it's okay to use the same single forecast for a subsequent six-week period: Even a broken clock is right twice a day. But they'd be in the minority.
In summary, you might consider using the Cash Flow Projector's Average of Last 6 Weeks method to forecast if you repeat it every week, turning a single-forecast model into a moving average model.
The same arguments apply in even greater measure to another option in the Choose a Projection Method dropdown: Average of Same 6 week Period Last Year. Again, the assumption of this model is that the cash inflows from last year are a good predictor of the upcoming cash inflows — only this time, the average of the year-old data is used for each of the next six weeks. In a highly seasonal business, it can make good sense to look back a year, but almost no sense to push an average out six weeks when there are subsequent historical values available.
My advice is to avoid using the six-week average forecasts for more than one period beyond the current week. If you want to use the six-week average, repeat the analysis weekly to turn it into a moving average.
There's one more option in the Choose a Projection Method dropdown: Use a Weighted Average of Last 6 Weeks. It's the default option, the one that's chosen when you first run the Cash Flow Projector. Here's what it does:
In the Average of Last 6 Weeks method, each week's cash receipts carries an equal weight in the average. You just take the sum of the weekly cash receipts and divide by 6. This is an unweighted average.
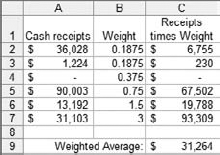
By contrast, the weighted average multiplies each week's cash receipts by a different factor, or weight, before totaling them; then divides by 6 the number of values being averaged. Figure 8.12 shows what it looks like in an Excel worksheet.
Notice first that the cash receipts in the first column agree with those shown for the most recent six weeks, shown in Figure 8.6. Also notice that the weighted average of $31,264 agrees with the weighted average calculated by the Cash Flow Projector as shown in Figure 8.4.
You can demonstrate the same outcome for yourself by entering the six weights, ranging from 0.1875 to 3, into a worksheet along with your own set of cash receipts for the past six weeks.
Multiply the receipts by the weights and take the average of the results. It should agree with the weighted average as given by the Cash Flow Projector when you run it on your company file.
This projection method, the Weighted Average of the Last Six Weeks, is stronger than the unweighted average shown in Figure 8.11 because, using the unweighted average, each week's cash receipts have equal weight in the average. The weighted average method gives greater weight to more recent receipts. The assumption is that the more recent the observation, the more likely it is to resemble the next occurrence. If your weekly cash receipts have been trending up from, say, $5,000 six months ago to $8,000 last week, it is rational to project that next week's receipts will be closer to $8,000 than to $5,000.

It's easy to express the relative effect of the weights in percentage terms (see Figure 8.13).
Of course, this assumes that you have no special knowledge about next week. If you know that your business will be closed next week, and that you will make no sales, that's special knowledge, which is difficult to build into a weighted average without seeing your calendar.
If this weighted average approach is better than the unweighted average approach shown in Figure 8.11, it's not all that much better. Three issues are pretty clear:
It's still a single-forecast. The Cash Flow Projector is asking you to let it apply weights that get smaller the further back you go. Then it wants to apply the same result in each of the subsequent six weeks (again, see Figure 8.4). That's self-contradictory.
The only thing that's special about looking exactly six weeks back is that the projector gives you an analysis of your cash position for the next six weeks. But there's no requirement that the baseline should be the same length as the forecast. In fact, in genuine forecasting applications, the baseline is almost always much longer than the forecast horizon. Why not look back 14 weeks, or 26?
Those specific weights are arbitrary. Bear in mind that the same weights, ranging from 0.1875 to 3, are used regardless of the company file that's open. It's just a sequence of numbers, each of which happens to be twice as big as the prior number after the second in the sequence, that add to 6. They're better than nothing, but there's nothing magic about them.
Fortunately, there are much stronger ways to forecast cash (and net income as well) than the methods offered in the QuickBooks Cash Flow Projector. Some are based on least-squares regression, some on what's called exponential smoothing — a hifalutin name for a straightforward technique that has lots of intuitive appeal and strong practical applications. The section "Going Outside QuickBooks to Project Receipts," later in this chapter, takes a look at smoothing and regression methods.
Earlier, at the end of the "Verifying the Cash Flow Projector" section, I advised you to include Transfer as Transaction type when you are building a custom report to check the projector's numbers. I also implied that it's wrong to do so in the normal course of events. Here's why:
If the projector has a six-week baseline of transactions that includes even one transfer from one bank account to another, you have to include transfers in the custom report too or, the report's figures won't agree with that of the projector. I didn't want to confuse what the projector does with the fact that it does it wrong, so I postponed explaining transfers until now.
First, why is it wrong to include transfers? Because you want to project cash inflows: new funds that you can use to help meet upcoming obligations. That's the whole point of using the Cash Flow Projector, after all — to warn you if your near-term costs exceed your near-term cash assets.
If you transferred $5,000 from Savings to Checking last month, that's not new money. You already had that $5,000. And if the projector looks at that increase in the balance of Checking and decides it's new money, it will overestimate your cash receipts for last month by $5,000.
And in turn, if you ask the projector to forecast cash receipts for the next six weeks, based on the last six weeks, its forecast is guaranteed to be an overestimate. Forecasts are always wrong, and you get used to that, but there's no reason to build a structural source of error into a process that has enough random error in it already.
I have no idea why the developers of the Cash Flow Projector allowed transfers to sneak into the list of permissible transactions for the forecast of cash inflows. But they did, and there are just three fixes:
Don't transfer funds among cash accounts.
Void any transfers between cash accounts during the six-week period that you tell the projector to use.
Forecast your cash receipts outside of QuickBooks and enter them manually into the Cash Flow Projector.

Of these three fixes, the first is impractical, the second requires you to remember to re-establish the transfer after running the projector, and the third requires that you obtain or write a utility to do the work. None of these is a great option. Unfortunately, doing this kind of analysis is too important for your business to skip, so it's best to bite the bullet and choose one.
Figures 8.14 and 8.15 show the custom cash receipts report, and the forecast results in a chart, with the transfer transactions removed. Compare these two figures with Figures 8.7 and 8.8 to see what a dramatic difference the transfers make.
As explained earlier, there are real problems associated with estimating your cash receipts over the six-week projection period. If you opt for one of the automatic forecasting methods supplied by the projector, you risk running afoul of its disadvantage. If you decide to enter estimated receipts manually, you face the problem of quantifying them — that is, where will the numbers come from?

Figure 8.15. The projected receipts are much lower than in Figure 8.8 because the baseline values are much lower without the transfers

You may have noticed that the projector has a built-in inconsistency: It picks up upcoming costs that you have recorded in QuickBooks automatically, by looking to Accounts Payable. You might expect that it would also pick up upcoming receipts automatically, by looking to Accounts Receivable. But it does not. Perhaps the projector is merely taking the conservative approach of assuming that you will pay your bills on time, but getting paid is a matter for your customer and your customer's conscience. And after all, you can enter Accounts Receivable yourself, if you want. (I'm being as kind as I can manage here.)
So, what's the best way for you to estimate cash receipts during the upcoming six weeks? That depends on how your customers buy from you:
If your revenue stream relies on invoices and Accounts Receivable, you should use a QuickBooks report to summarize AR on a weekly basis, and then enter the results manually into the projector.
If your business is the retailing of consumer goods, you have few if any Accounts Receivable to use as the basis for an estimate. You should adopt one of the forecasting methods offered by the projector, or go outside QuickBooks for a forecast that you can then enter — again, manually.
The best way to get a forecast of Accounts Receivable is to use the Cash Flow Forecast report. Choose Reports
The figures that you need to move into the projector are your Accounts Receivable, found in the first numeric column in the Cash Flow Forecast report. Notice these two aspects of the report:
QuickBooks places the date you run the report in its upper-left corner.
The first column identifies the start of the week for you. When QuickBooks shows "Week of December 11," for example, the data on that row are for December 11 through December 17.
You want to return to the Cash Flow Projector the Accounts Receivable total for the current week and for each of six subsequent weeks. Therefore, make sure that the date you run the report is captured by the first week shown. If it is not, adjust the start date for the report either by overtyping in the From date edit box or by clicking the calendar icon to the right of the box.
You should also adjust the report's To date. By default it shows the current week and three subsequent weeks, followed by the totals for those four weeks and finally by the balance. Either correct the To date in its edit box or click the calendar icon. Set it to a date seven weeks following the To date.
Note
Don't forget to click the Refresh button after you've adjusted a report's date range.
The Cash Flow Forecast report is so useful in this analysis because it assigns Accounts Receivable totals to the correct week by using the due date. Other preset reports in QuickBooks analyze transactions according to the transaction's date. Suppose that you open a Balance Sheet Detail report and set its To and From dates to capture 12/14/11 through 12/27/11. An invoice created on 12/12/11 with a due date of 12/21/11 would not appear in the report. But an invoice created on 12/15/11 with a due date of 12/29/11 would appear. In the case of the Balance Sheet, it's the creation date that governs, because that's when it enters your Accounts Receivable.
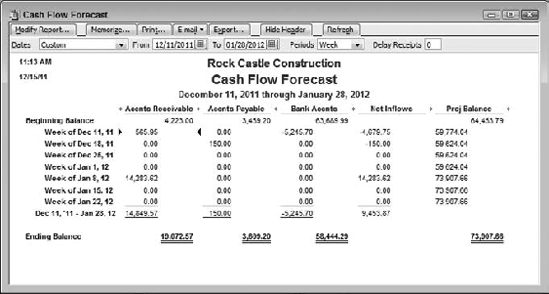
Figure 8.17. For each category, weekly transaction totals are left-aligned and the beginning and ending balances are right-aligned.
But when you're looking at cash flow, it's the due date that matters: the date that you expect to have the cash in hand. So you want a report that attends to the due date instead of the creation date, and that's what the Cash Flow Forecast report provides. To make sure, it's not a bad idea to double-click an entry in the Accounts Receivable column to get a Quick Zoom. There you can verify that the due date for the Accounts Receivable transaction lies within the week where it appears on the Cash Flow Forecast report.
Figure 8.17 shows the Cash Flow Forecast report after adjusting it to capture not just four but seven weeks.
With these figures in hand, you can transcribe them to the Cash Flow Projector's Cash Receipts step. Choose I Want to Project Cash Receipts Manually from the Choose a Projection Method dropdown. Now you can enter the total amount of Accounts Receivable for each week, using either the Itemized Cash Receipts box or the Adjustments boxes.
Tip
It's quicker to use the Adjustments boxes. But if you have adjustments that you want to keep separate from Accounts Receivable, use both. QuickBooks combines them in the final projection.
Another reason to run the Cash Flow Forecaster report with the Cash Flow Projector is that sometimes the projector gets your Accounts Payable wrong.
The reason is unclear. But it is documented that occasionally the projector fails to remove bills that have already been paid from its accounting of Accounts Payable. If this happens, one solution is to restart the projector, running it to completion several times. During this sequence, the projector gradually omits more and more bills that have been paid. Depending on the number of such bills at the outset, the projector might converge on an accurate cash estimate anywhere from the third to the seventh repetition.
Or it might not happen at all. You can see the potential for annoyance.
The Cash Flow Forecast report, by contrast, returns an accurate listing of Accounts Payable (and Accounts Receivable). So while it's not as flexible a tool as the Cash Flow Projector, it's ideal as a check on the results you get from the projector.
It's best to use both methods:
Use the Cash Flow Forecast report to get weekly Accounts Receivable and Accounts Payable figures. If you have Accounts Receivable, enter their weekly totals in the projector's Cash Receipts step. Use the Forecast report's Accounts Payable figures as a check against those returned by the projector.
Use the Cash Flow Projector, with an assist from the Cash Flow Forecast report, to make adjustments to both upcoming receipts and accounts payable, and to enter expenses that you have not entered into Accounts Payable. Also use the projector if instead of Accounts Receivable you want to use an automatic forecasting method for cash receipts.
Suppose your business is not the sort that enables you to estimate your upcoming cash receipts by way of a pipeline full of receivables coming due. You're a startup, perhaps, or you sell in small dollar amounts to a large customer base.
If so, the amount of revenue you bring in during the next few weeks is much more a function of your customers' behavior than anything you do as a business owner. In that case, the best guide to the size of your revenue stream in the future is the past. The QuickBooks Cash Flow Projector offers revenue forecasts based on the revenues that came in during the last six weeks, or during the same six-week period one year back.
For the purpose of budgeting your cash position during the next month and a half, those forecasts might be good enough, even with the defects described earlier in "Running the Cash Flow Projector" section. But if you've used the projector before and haven't been satisfied with the results, or if you think you might like to try forecasting something other than dollar revenues (foot traffic, for example, or units sold for inventory planning), you should think about forecasting with a different software package.
There are many applications that offer good quantitative forecasting functions: R and SAS are two of the more familiar applications. But the application that you're likely to already own, and that's capable of the numeric analysis required, is Microsoft Excel. The remainder of this chapter shows how to export data from QuickBooks so it can be used to forecast in Excel, and then how to move the forecast back into QuickBooks (for use with the Cash Flow Projector, perhaps, or with setting up an operating budget for the next fiscal year).
The idea of smoothing is a simple and attractive one. Suppose you have on hand a history of the amount of revenue your company has taken in each week for, say, the past year. At the end of each week, you can forecast the amount of revenue you think you'll bring in next week. After the next week is over, you make another forecast.
When you smooth a series of numbers, weekly revenues in this example, you let each new forecast consist of two parts:
A part that depends on the amount of revenue taken in during the week just ended
A part that depends on how much the prior forecast turned out to be wrong
Suppose that it's Friday, January 15, the end of your business week. Your business took in $5,000 from January 9 through January 15. But at close of business on Friday, January 8, one week ago, you forecast that you would take in $4,000 from January 9 through January 15. So your forecast of $4,000 turned out to be too low by $1,000.
You have already decided that for the time being you'll base each forecast on the prior forecast amount (here, $4,000) plus 30% of the amount of error in the last forecast ($5,000 – $4,000) = $1,000. Your forecast for next week is therefore:
Next forecast = $4,000 + 30% * $1,000
Or $4,300. Just looking at the numbers, that's not very intuitive. But consider the effects of the formula:
Each new forecast moves the old forecast by an amount, and in a direction, that would have improved the old forecast. The old forecast was too low by $1,000. So in the new forecast, you correct the old one: You increase it by 30% of the amount of the underestimate.
This value, 30%, is called a smoothing constant. (See the next section for more information on this value.)
The result is that the forecasts are self-correcting — they adapt to changes in whatever it is you're forecasting.
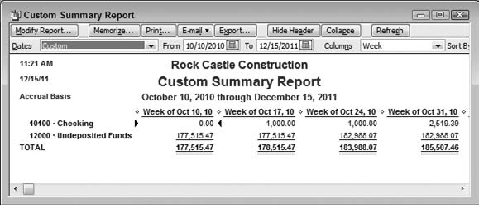
Here's an example, starting with a QuickBooks custom summary report. Figure 8.18 shows a portion of that report.
You can structure the report using the following setting in the Modify Report dialog box's Display tab:
Date range: Custom (for this example, 10/10/2010 to 12/15/2011)
Display columns by Week
Display rows by Account list
No subcolumns
In the Filters tab:
Accounts: Multiple accounts (Checking, Savings, Petty Cash, and Undeposited Funds
Transaction Type: Multiple accounts (Sales Receipt, Payment)
To get the report into Excel for analysis:
Click the Export button, and choose to export to a new Excel workbook.
When you click OK, Excel opens a new workbook with an active worksheet whose final two columns look similar to columns BK and BL in Figure 8.19.
Select rows 4 through 6 by dragging through their row headers with your mouse. Choose Format
Locate the final Total value in row 4 (this will be a different row if QuickBooks provided weekly data for accounts in addition to Checking and Undeposited Funds). In Figure 8.19 the final Total value is in cell BL4. In the next column, in cell BM4, enter
=BL4+BL6
Copy and paste that formula into the next six columns — in effect, extending the range of cash receipts into the future by six weeks, as required by the Cash Flow Projector. For the moment it will appear as though this step does nothing more than extend a constant value into the next six columns.
In cell D5, enter
=D4-C4
This formula returns the increase in the balance of the accounts during the second week.
Copy and paste the formula in row 5 across as many columns as the QuickBooks report provided data, plus the six you added in Step 4 (in Figure 8.19, the paste goes through cell BR5). You now have the total cash inflows per week from the From date through the To date you selected for the report, plus an additional six weeks to forecast into.
In cell E6 enter the formula
=D5
This is your first forecast value. It's called a forecast even though it applies to a date in the past, because it's based on earlier data.
In cell F6 enter the formula
=0.3*E5+0.7*E6
Copy and paste the formula into cell G6, and on through the column you extended into in Step 4.

The values you arrive at in the final step are your forecasts. You can now enter the final seven values in row 5 into the Cash Flow Projector's Cash Receipts step, using the Adjustment boxes.
It's often helpful to view both the historical cash receipts that you have exported from QuickBooks and the forecasts that result from smoothing. Figure 8.20 displays a chart of actuals and smoothed forecasts over time.

The process just described is called exponential smoothing. There are a few things to keep in mind:
Exponential smoothing is a one-step-ahead method. Without using a seasonal component, and without using a more complicated method such as double smoothing, it's not typical to use smoothing to forecast more than one step ahead of the current observation. This section uses it anyway, pushing the forecast six weeks into the future, because it strikes a good practical balance between simplicity and mathematical rigor.
Choosing a smoothing constant. This example uses 30%, or 0.3, as the smoothing constant. It's up to you to select a value for the smoothing constant, but values between 10% and 30% are often regarded as conventional. The higher the value, the more quickly the forecasts respond to changes in the baseline values — in this example, that's the cash receipts leading up to the period to be forecast. If you adjust the smoothing constant, you should also adjust the damping factor, the factor with the value 0.7 in the equation shown in Step 7, earlier. The smoothing constant and the damping factor should sum to 1.0.
Note
If you're familiar with Excel's Solver add-in, you can use it to find the value for the smoothing constant that minimizes the sum of the squared errors between the forecasts and the actual values. The Excel function
SUMXMY2is useful for calculating that criterion.Detrending a series. If your cash receipts are trending up or down consistently during the past few weeks (say two to four months) you should consider detrending the series by working with the differences from one week to the next. For more on this issue consult an intermediate text on forecasting or econometrics.
Another useful method of forecasting using Excel is based on regression techniques. These approaches differ from smoothing as to assumptions they make about the history of, for example, the cash receipts that you provide. If you use standard linear regression, you get what's called a regression line, a straight one, that minimizes the squared errors between forecasts and actual values (thus the term least-squares regression).
If you're new to regression, this might sound complicated. But Excel makes it easy to get regression forecasts, and for now there's no need to worry about violating assumptions. (If you were going to make a mission-critical decision based on regression analysis then there'd be much more to say about assumptions, but here you're still concerned mainly with whether you can expect to have enough cash to meet your bills for the next six weeks.)
The first two steps involved in creating a regression forecast are identical to those used in creating a forecast by smoothing:
Click the Export button, and choose to export to a new Excel workbook.
When you click OK, Excel opens a new workbook with an active worksheet whose final two columns look similar to columns BK and BL in Figure 8.19.
In cell D5, enter the date shown in cell D1, but enter it without a text label. For example, if the value "Week of Oct 17, 10" is in D1, enter in D5 10/17/2010.
In cell E5, enter
=D5+7
This formula puts a date in E5 that's exactly one week later than the date you entered in D5.
Copy and paste the formula in E5 into the range F5 through the end of the data exported from QuickBooks — that is, column BL in this example — and into an additional six columns, through column BR. You now have weekly date values in the range starting with D5 and extending six cells — that is, six weeks — into the future.
Enter this formula into cell D6:
=D4-C4
This formula was used in the smoothing example. It converts weekly balances to weekly increases.
Copy the formula in D6 and paste it into the range E6:BL6, the end of the data exported from QuickBooks. Do not extend the formula past the final column from QuickBooks.
Select the range D7:BL7. Then type this formula, but don't yet press Enter:
= TREND(D6:BL6,D5:BL5)
assuming, again, that the balances from QuickBooks went through column BL and no farther.
Instead of simply pressing Enter, hold down the Ctrl and Shift keys simultaneously and then press Enter. This keyboard sequence is termed an array entry in Excel. When you have entered an array formula such as this one correctly, Excel surrounds it in the formula box with curly braces.
Select the range BM7:BR7 and array-enter this formula by pressing Ctrl+Shift+Enter:
=TREND(D6:BL6,D5:BL5,BM5:BR5)
The result of the steps appears in Figure 8.21.
The forecasts are now in BM7:BR7 and you can copy them (in addition to the current week's value in cell BL6) into the Adjustments boxes on the Cash Receipts step of the Cash Flow Projector.
Figure 8.22 shows a chart of the actual receipts and the regression forecasts over time.
Entire books have been written about the topics in this section. The coverage here is briefer:
What a baseline is. In forecasting jargon, a baseline is a set of observations that appear in the order of date (or even time) each observation was made; the term time series is also used. The baselines in this chapter are the actually recorded cash receipts that are exported from QuickBooks into an analysis package such as Excel.
Evaluating a baseline's length. Up to a point, the longer the baseline the better. The more data the equations have to work with, the more precisely they can estimate the factors that define the regression. There's no hard-and-fast rule here — much depends on various diagnostics that Excel can calculate but that are meaningless unless you've read one of those books about regression. But you're likely to be on pretty solid ground if your baseline contains roughly 50 weeks of data. So, if your company has been generating receipts for about a year, you should be well placed to forecast the next few weeks using regression.
Pushing the forecast too far. The math behind the regression equations allows you to push the forecasts out well beyond the relatively brief six weeks that this chapter has covered. In the section concerning creating the regression forecasts, you saw that you can extend the forecast to six subsequent weeks just by supplying another six dates, and extending the TREND equation to include them. There's nothing to stop you from extending the forecast another six, or even 66 weeks. But the reliability of forecasts drops rapidly the farther you get from the final actual observation. Keep your forecast as short as possible, given your purpose for making it.

