
8
Code Quality Metrics
Wouldn’t it be great if we could measure the quality of our software? Software developers often want to improve their software again and again – but maybe it is already “good enough.” How do we know when it reaches a good state?
Software quality metrics were introduced by smart people in the early days of programming. In the 1970s, they thought about this topic and produced the ideas that are still in use today. Of course, we want to benefit from this knowledge and apply it to our own projects.
In this chapter, we are going to cover the following topics:
- Introducing code quality metrics
- Gathering metrics in PHP
- The pros and cons of using metrics
Technical requirements
If you have gone through the previous chapter and tried out all the tools, you already have everything that you need for this chapter installed. If not, please make sure to do so before you run the upcoming examples.
The code files for this chapter can be found here: https://github.com/PacktPublishing/Clean-Code-in-PHP
Introducing code quality metrics
In this section, you will learn about how to measure the quality of software in general. We will look at some of the most used metrics in the PHP world and explain what they can tell you about your code, how to gather them, and when they are useful or not.
Aspects of software quality
Before we dive into the numbers, we need to clarify one important thing first: what does software quality actually mean? Surely, everybody has a certain understanding of quality, but it might be hard to put this in words. Luckily, there are already existing models, such as the FURPS model, which was developed at Hewlett-Packard back in the 1980s. The acronym stands for the following:
- Functionality: Is the software capable of dealing with a wide variety of use cases? Has it been developed with security in mind?
- Usability: How good is the user experience? Is it documented and easy to understand?
- Reliability: Is the software available at all times? How probable are crashes, or errors, that might affect the output?
- Performance: Indicates the speed of the software. Does it make efficient use of the available resources? Does it scale well?
- Supportability: Can the software be tested and maintained well? Is it easy to install and can it be translated (localized) into other languages?
Further quality aspects include, among others, accessibility and legal conformity. As you can see, this model covers more aspects such as user experience and documentation than we as PHP developers will typically work on. That is why we can look at software quality from two different viewpoints: external and internal quality. Let us have a closer look at what that means:
- External quality: Outward, or user-facing, aspects are part of the external quality of software. This covers a lot of the aspects we introduced previously. What they have in common is that they can be measured without touching or analyzing the code itself – think of performance testing tools that measure the response time of a request or end-to-end tests that emulate a user by automatically executing tests on the application.
- Internal quality: As software developers, we usually care more about the internal quality of software. Is the code easy to read and understand? Can you extend it easily? Can we write tests for it? While users will never see the code, or are not concerned about its testability, it does affect them indirectly: code of high quality contains lesser bugs and is also often (but not always) faster and more efficient. It is also known to be easier to extend and maintain. Typically, these aspects can be checked using automated unit tests or code analyzers.
In this book, we focus on the internal code quality. That is why we speak about code quality in particular and don’t use the broader term, software quality.
Code quality metrics
Now that we have a better understanding of what code quality means, let us now have a look at what code quality metrics we want to talk about in this section:
- Lines of code
- The cyclomatic complexity
- The NPath complexity
- Halstead metrics
- The Change Risk Anti-Patterns index
- The maintainability index
The lines of code
Counting the Lines of Code (LOC) in a project is not a quality metric. However, it is a useful tool to grasp the size of a project – for example, when you start working on it. Furthermore, as we will see, it is used by other metrics as a base for their calculations. It is also helpful to have an idea about how many lines of code you are dealing with – for example, when you need to estimate refactoring efforts for certain classes.
That is why we want to have a closer look at it now. First, we can differentiate the LOC further:
- LOC: LOC simply counts all lines of code, including comments and blank lines.
- Comment Lines of Code (CLOC): This metric tells you how many lines of your code are comments. It can be an indicator of how well the source code is commented on. However, as we know, comments tend to rot (i.e., they get outdated quickly and are often more harmful than they are useful), so there is no percentage or any other rule of thumb we can recommend. Still, it is interesting to know.
- Non-Comment Lines of Code (NCLOC): If you want to compare the size of one project with another, leaving out the comments will give you a better picture of how much real code you need to deal with.
- Logical Lines of Code (LLOC): For this metric, it is assumed that every statement equals one line of code. The following code snippet illustrates how it is supposed to work. Consider the following line of code:
while($i < 5) { echo “test”; /* Increment by one */
$i++; }
Here, the LOC would be 1. Since we have three executable statements in this line, LLOC would count this as 3, as the code can also be written with each statement in one line:
while($i < 5) {
echo “test”;
/* Increment by one */
$i++;
}
In the preceding example, we highlighted the executable statements. Comments, empty lines, and syntactical elements such as brackets are not executable statements – that is why the full-line comment and the closing brace at the end of the loop are not counted as a logical line.
The cyclomatic complexity
Instead of just counting the lines of code, we can also measure the complexity of the code – for example, by counting the number of execution paths within a function. A common metric for this is the Cyclomatic Complexity (CC). It was introduced in the late 1970s but is nevertheless still useful. The idea behind the cryptic name is simple: we count the number of decision points, which are if, while, for, and case statements. Additionally, the function entry counts as one statement as well.
The following example illustrates how the metric works:
// first decision point
function someExample($a, $b)
{
    // second decision point
    if ($a < $b) {
        echo "1";
    } else {
        echo "2";
    }
    // third decision point
    if ($a > $b) {
        echo "3";
    } else {
        echo "4";
    }
}
The CC for the preceding code snippet would be 3: the function entry counts as the first decision path and both if statements count as one decision path each as well. However, both else statements are not taken into account by definition, as they are part of the if clauses. This metric is especially useful to quickly assess the complexity of code that you do not know yet. It is often used to check a single function, but can also be applied to classes or even a whole application. If you have a function with a high CC, consider splitting it into several smaller functions to reduce the value.
The NPath complexity
A second metric of code complexity is the NPath complexity. The basic idea is similar to the CC, as it counts the decision paths of a function too. However, it counts all possible decision paths and not just the four statements (if, while, for, and case) that are defined for the CC. Furthermore, the function entry point is not counted as a decision path for this metric.
Looking at the above example, the NPath complexity would be 4, because we have 2 * 2 possible paths through the function: both if statements, as well as both else statements. So, all four echo statements are considered decision paths. As mentioned previously, the function call itself is not considered. Now, if we added another if statement, the NPath complexity would increase to 8. This is because we would then have 2 * 2 * 2 possible paths. In other words, the metric grows exponentially, so it can rapidly become quite high.
The NPath complexity depicts the actual effort to test a function better than the CC, as it tells us directly how many possible outcomes of the function we would need to test to achieve 100% test coverage.
Halstead metrics
Maurice Halstead introduced a set of eight metrics in the late 1970s, which are still in use today and are known as the Halstead metrics. They are based solely on the distinct and total number of operators (e.g., ==, !=, and &&) and operands (e.g., function names, variables, and constants), but as you will see, they already tell you a lot about the inspected code.
We do not need to know exactly how these metrics work. If you are interested, you can find out more about these metrics here: https://www.verifysoft.com/en_halstead_metrics.html. However, you should have an idea of what Halstead metrics there are:
- Length: Calculating the sum of the total number of operators and operands tells us how much code we must deal
- Vocabulary: The sum of the number of unique operators and operands already indicates the complexity of the code
- Volume: Describes the information content of the code based on the length and vocabulary
- Difficulty: Indicates the error proneness (i.e., how likely it is to introduce bugs)
- Level: Inverts the difficulty – as in, the higher the level, the less error-prone it is
- Effort: The effort that is necessary to understand the code
- Time: Tells us how long it roughly took to implement it
- Bugs: Estimates the number of bugs that the code contains
These values will give you a rough indication of what type of code you are dealing with. Is it easy to understand? How much time was spent developing it? How many bugs can be expected? However, without comparing these values with results from other applications, they will not help you that much.
The Change Risk Anti-Patterns index
Another especially useful metric is the Change Risk Anti-Patterns (CRAP) index. It uses the CC and the code coverage of the code under consideration.
Code coverage
You have probably heard the term code coverage a lot already. It is a metric that is used in context with automated tests and describes the number of lines of code (stated in percent of the total number of lines) that unit tests have been written for. We will discuss this metric and its prerequisites again later in the book when we are dealing with this topic in more detail.
The combination of these two metrics is quite useful. Code that is not overly complex and has high test coverage is far more likely to be bug-free and maintainable than code that is complex and where there are not many tests for it.
The maintainability index
As the last metric in this section, we will look at the maintainability index. It will provide you with just one value that indicates the maintainability of the inspected code, or, in other words, it tells you how easy it will be to change it without introducing new bugs. Two things make this metric particularly interesting for us.
Firstly, it is based on the aforementioned metrics and uses the LOC, Halstead metrics, and the CC to calculate the index. Yet again, we do not really need to know the exact formula. If you are interested, you can look it up here: https://www.verifysoft.com/en_maintainability.html.
Secondly, this metric will return a value that you can use to assess the code quality directly:
- 85 and more: Good maintainability
- 65 to 85: Moderate maintainability
- 65 and below: Bad maintainability
With this metric, you need no other code to compare it to. That is why it is particularly useful to quickly assess the code quality.
In this section, we have gone through a lot of theory. Excellent job so far – you will not regret learning about it for sure because, in the next section, we will show you how to gather these metrics using even more PHP tools.
Gathering metrics in PHP
In this section, we want to have a look at the tools there are in the PHP world to gather code quality metrics. As you will see shortly, these metrics are not just numbers – they will allow you to make educated guesses about how much effort it will take to refactor code. They will also help you to identify the parts of the code that will require the most attention.
Again, we have curated a selection of tools for you:
- phploc
- PHP Depend
- PhpMetrics
phploc
As we learned in the previous section, the abbreviation LOC stands for lines of code, so the name already reveals the main purpose of this tool. Being a basic metric, it already tells us quite a few things about a code base. phploc also provides further metrics, such as the CC, so it is worth having a closer look at it.
Installation and usage
The author of this tool, Sebastian Bergmann, is well known for phpunit, the de facto standard for automated tests in the PHP world. He recommends not installing it using Composer but using phar directly. We will discuss the pros and cons of this approach in the next chapter. For now, let us just follow the author’s advice and download phar directly:
$ wget https://phar.phpunit.de/phploc.phar
This will download the latest version of phploc into the current directory. After downloading it, we can directly use it to scan a project:
$ php phploc.phar src
Scanning single files
Although phploc is meant to be used on whole projects, it is also possible to specify a single file to scan. While the average measures make no sense because they are meant to be used on a whole project, it is still useful if you need to find out the LOC metrics or the CC for a class.
The preceding command will scan the src folder with all its subfolders and gather information about it, which will be presented directly on the command line as shown in Figure 8.1:

Figure 8.1: An example output of phploc (an excerpt)
That is quite a lot more information than just the LOC. The information is divided into the following categories:
- Size: Obviously, the main reason for this tool to exist is to measure the size of a project by counting the number of lines of code, using the several ways of counting we introduced in the previous section. The focus lies on LLOC and you will get the averages for this metric per class, class method, and function.
- CC: phploc will calculate the average CC values per LLOC, classes, and methods.
- Dependencies: This section tells you how many accesses to the global state have been made and how many attributes and methods are being accessed statically. Both global and static access are considered as practices and should be avoided, so these numbers give you greater hints about the code quality.
- Structure: In the last output section (which did not fit in the preceding screenshot), phploc returns more details on the code structure. There are no clear rules on how to interpret them; however, you can draw some conclusions from them. For example, see the following:
- Regarding the overall code size, how many namespaces are used? A large code base with only a few namespaces indicates that the project is not well structured.
- Are interfaces used and how many compared to the project size? The usage of interfaces increases the interchangeability of classes and indicates well-structured code.
This is all we need to know about the functionality of phploc for now. It is a simple-to-use yet helpful tool that helps you get a grasp on the overall code quality and structure of a project quickly and should therefore be part of your toolkit. It does not tell you how to interpret the numbers, though, which requires some experience.
PHP Depend
If there was a prize for the most metrics combined in one tool, then it would surely go to PHP Depend (PDepend). It covers all the metrics we discussed in the previous section, plus many more. However, it is not the most user-friendly tool there is. Plus, the website and the repository documentation are not perfect. Nevertheless, you should check it out.
Installation and usage
As before, this tool can be installed using Composer or downloading phar directly. We will go with the Composer-based installation for now:
$ composer require pdepend/pdepend --dev
If there were no unpleasant surprises, you can execute it directly:
$ vendor/bin/pdepend --summary-xml=pdepend_summary.xml src
Here, we already can see that the ancestor of PDepend is JDepend, a Java code quality tool, as the output is written into an XML file. The filename is specified using the --summary-xml option. Furthermore, we must specify the to-be-scanned folder as an argument.
PDepend does output some numbers, though, as can be seen in the following example output:
PDepend 2.10.3
Parsing source files:
...............................................          47
Calculating Cyclomatic Complexity metrics:
.................                                        355
Calculating Node Loc metrics:
.............                                            279
Calculating NPath Complexity metrics:
.................                                        355
Calculating Inheritance metrics:
.....                                                    101
We skipped some lines here. The numbers will only tell you how often each metric has been calculated for the given folder, so the direct output is not particularly helpful. To see the actual metrics, we need to open the XML report. In our case, the file that has been generated is called pdepend_summary.xml.
The XML report is too huge to print in this book, so you best try it out yourself to see it in all its glory. However, we can show you how it is structured:
<?xml version="1.0" encoding="UTF-8"?>
<metrics>
  <files>
    <file name="/path/to/Namespace/Classname.php"/>
    <!-- ... -->
  </files>
  <package name="Namespace">
    <class name="Classname" fqname="NamespaceClassname">
      <file name="/path/to/Namespace/Classname.php"/>
      <method name="methodName"/>
      <!-- ... -->
    </class>
    <!-- ... -->
  </package>
</metrics>
The <metrics> node represents the directory that was scanned in its entirety. It has the following child nodes:
- <files>, which lists all the scanned files using the <file> child nodes.
- <package>, which lists all the namespaces. Within this node, there are further <class> child nodes. For each class, there is a list of <method> nodes, one for each method in the class. Finally, the filename of the class is mentioned in another <file> node.
Of course, this is not everything that PDepend will generate as output. For each node, it will add up dozens of attributes, which contain the names and values of the calculated metrics. This is an example node from a XML report that was generated on the source code of PDepend itself:
<method name="setConfigurationFile" start="80" end="89"
  ccn="2" ccn2="2" loc="10" cloc="0" eloc="8" lloc="3"
  ncloc="10" npath="2" hnt="15" hnd="21"
  hv="65.884761341681" hd="7.3125" hl="0.13675213675214"
  he="481.78231731105" ht="26.765684295058"
  hb="0.020485472371812" hi="9.0098818928795"
  mi="67.295865328327"/>
You should be able to recognize some metrics such as lloc (LOC) or ccn (CC Number) already. For the others, you will find explanations, or at least the long names, for the abbreviations in the XML report in the online documentation: https://pdepend.org/documentation/software-metrics/index.html.
Further options
PDepend has two options you should know about:
- --exclude: This will exclude a namespace (or package, in this terminology) from the scans. You can use multiple namespaces, separated by commas. Make sure to add quotes around the namespace(s):
$ vendor/bin/pdepend --summary-xml=pdepend_summary.xml --exclude=”YourNamespace,AnotherNamespace” src
- --ignore: Allows you to ignore one or more folders. Again, don’t forget the quotes:
$ vendor/bin/pdepend --summary-xml=pdepend_summary.xml --ignore=”path/to/folder,path/to/other/folder” src
It can also generate images in SVG format with further information. We will not cover them in this book, though, as there is a better tool for this, which you will find in the next section.
PDepend is powerful, but at the same time difficult to oversee. The generated output is hard to read and, once the project has become a bit bigger, becomes unusable unless you use other tools to parse the XML file. However, you may need the advanced metrics it provides one day, or you may work on a project where it is already in use. So, at least you are prepared now.
PhpMetrics
Up until now, the world of PHP quality metrics was text-based only. This will change now, as we will now have a look at PhpMetrics, which will generate reports that are much better suited for the human eye and are even interactive.
Installation and usage
Let us add PhpMetrics to your project using Composer:
$ composer require phpmetrics/phpmetrics --dev
After all the files have been downloaded, you can immediately start generating your first report:
$ vendor/bin/phpmetrics --report-html=phpmetrics_report src
The --report-html option specifies the folder in which the report will be created. You can specify more than one folder to be scanned by providing them as a comma-separated list. For our example, however, we will just use the src folder.
As a result, PhpMetrics will list several statistics that will already tell you a bit about the code. Figure 8.2 shows an excerpt of the output, which might remind you of the output generated by phploc:
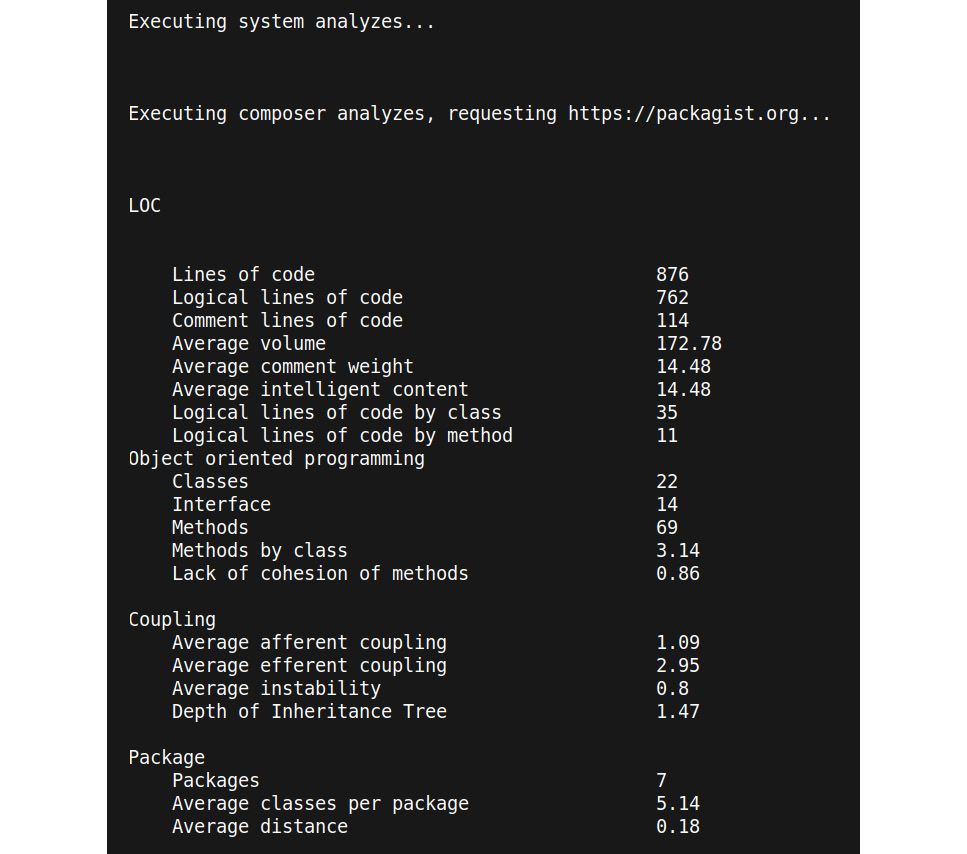
Figure 8.2: The PhpMetrics console output (an excerpt)
To open the actual HTML report that has just been generated, simply open the index.html file in that folder in your browser. Before we have a closer look at the generated report, let us see which other useful options PhpMetrics offers first:
- --metrics: This option will return a list of the available metrics. It helps decipher abbreviations such as mIwoC.
- --exclude: With this option, you can specify one or more directories to be excluded from scanning.
- --report-[csv|json|summary-json|violations]: Allows you to save the results in different report formats other than HTML – for example, --report-json.
Opening the browser from the command line
If you are using a Linux-based operating system, such as Ubuntu, you can quickly open an HTML file from the command line as follows:
$ firefox phpmetrics_report/index.html
Alternatively, see the following:
$ chromium phpmetrics_report/index.html
Understanding the report
If you have opened a PhpMetrics report for the first time, you will find a wide variety of information. We will not dive into every little detail but will show you which parts of the report we think are the most valuable to start with.
To illustrate the usage of PhpMetrics better, we randomly chose an existing open source package called thephpleague/container as a code base to work on. It is an excellent PSR-11-compliant dependency injection container, which is just the right size to use as an example. Figure 8.3 shows the overview page of an example report that we generated for it:
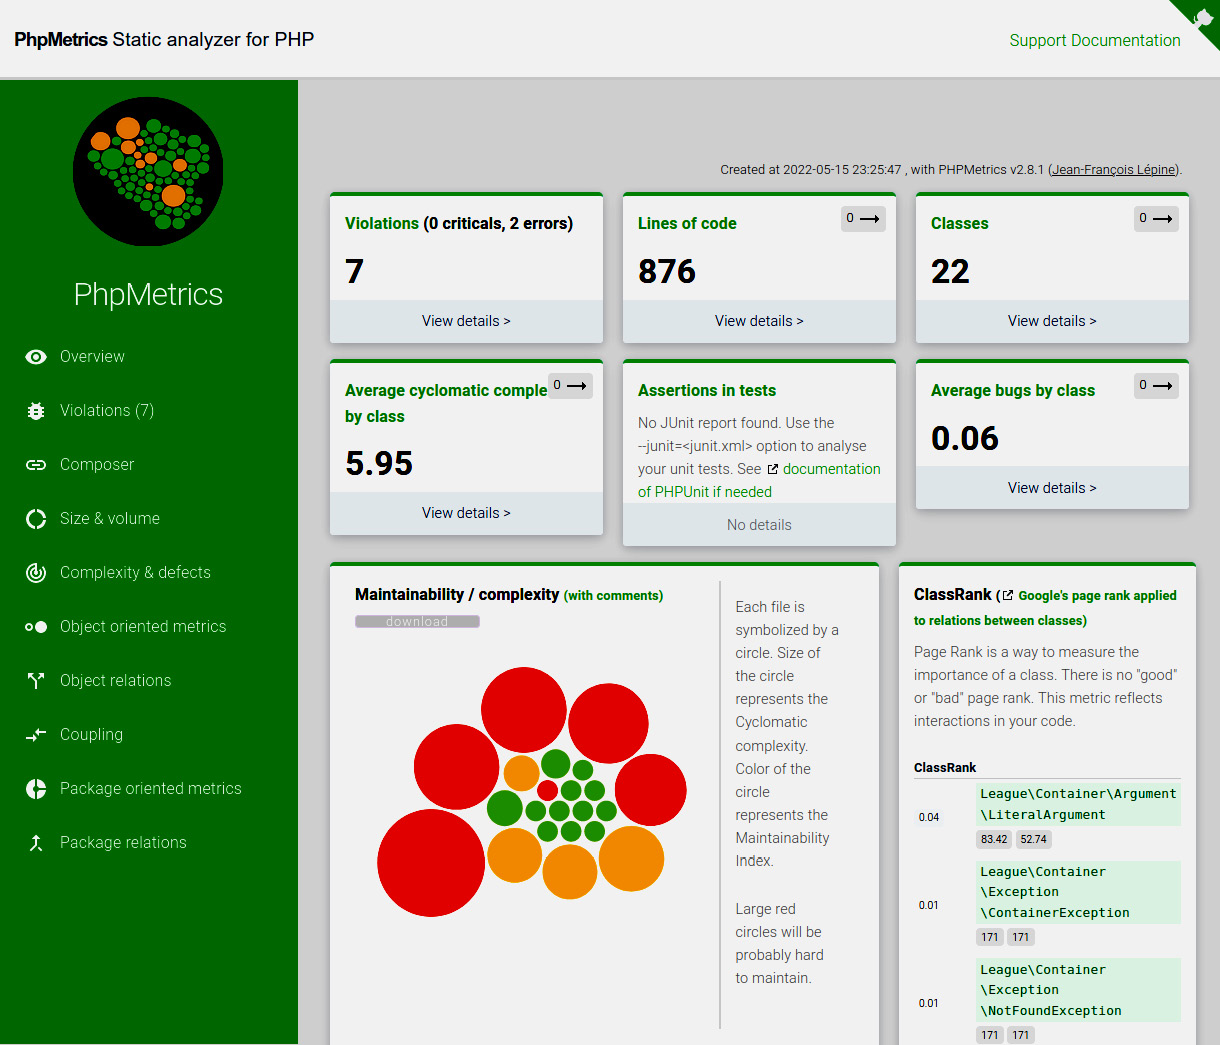
Figure 8.3: A PhpMetrics report overview
Key metrics
On the left-hand side, you will find the menu where you can access other pages of the report. The top part of the page is populated with a couple of key metrics, where the most interesting ones are:
- Lines of code tells you more about the size of this project. By clicking on the label, you will be sent to another page with a detailed list of all the classes and their related size metrics such as LOC.
- Violations shows you the number of violations that PhpMetrics has discovered. Again, by clicking on the label, you will be sent to another page with a list of classes and their violations – for example, if they are too complex (Too complex method code), have a high bug probability (Probably bugged), or use too many other classes or other dependencies (Too dependent).
- Average cyclomatic complexity by class tells you exactly what it says on the tin. The detailed view gives you more information about the complexity on a class level.
The other boxes offer interesting information as well, but the preceding ones are already perfect for getting a quick view of the most problematic parts of the code.
Maintainability or complexity
Underneath the key metrics, PhpMetrics shows a diagram, among other things, which you surely already spotted when first opening the report: the Maintainability / complexity graph. It consists of a colored circle for each namespace of the project, where the size of the circle represents the CC of a class. The bigger the circle, the higher the complexity. The color shows you the maintainability index, ranging from green (high) to red (low).
If you hover your mouse over a circle, you can see the namespace the circle represents and the two metrics in detail:
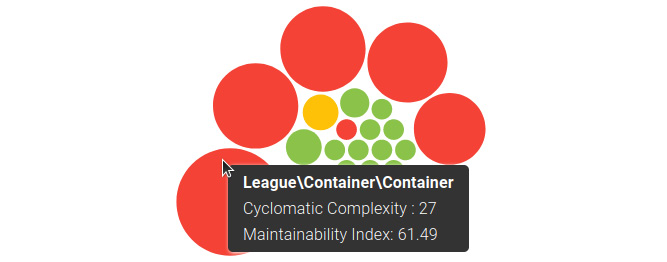
Figure 8.4: The Maintainability / complexity graph with a popup
This graph is extremely useful for quickly grasping the overall code quality – the fewer big red circles there are, the better. This way, you can see the problematic parts of your code easily.
Object relations
When you select Object relations from the left-hand menu, a graph that shows the relations between each namespace will appear. Hovering the mouse pointer over a text label will highlight its relations. The graph becomes massive, so we can not show it to you in this book in its full beauty, but we can at least give a first impression:
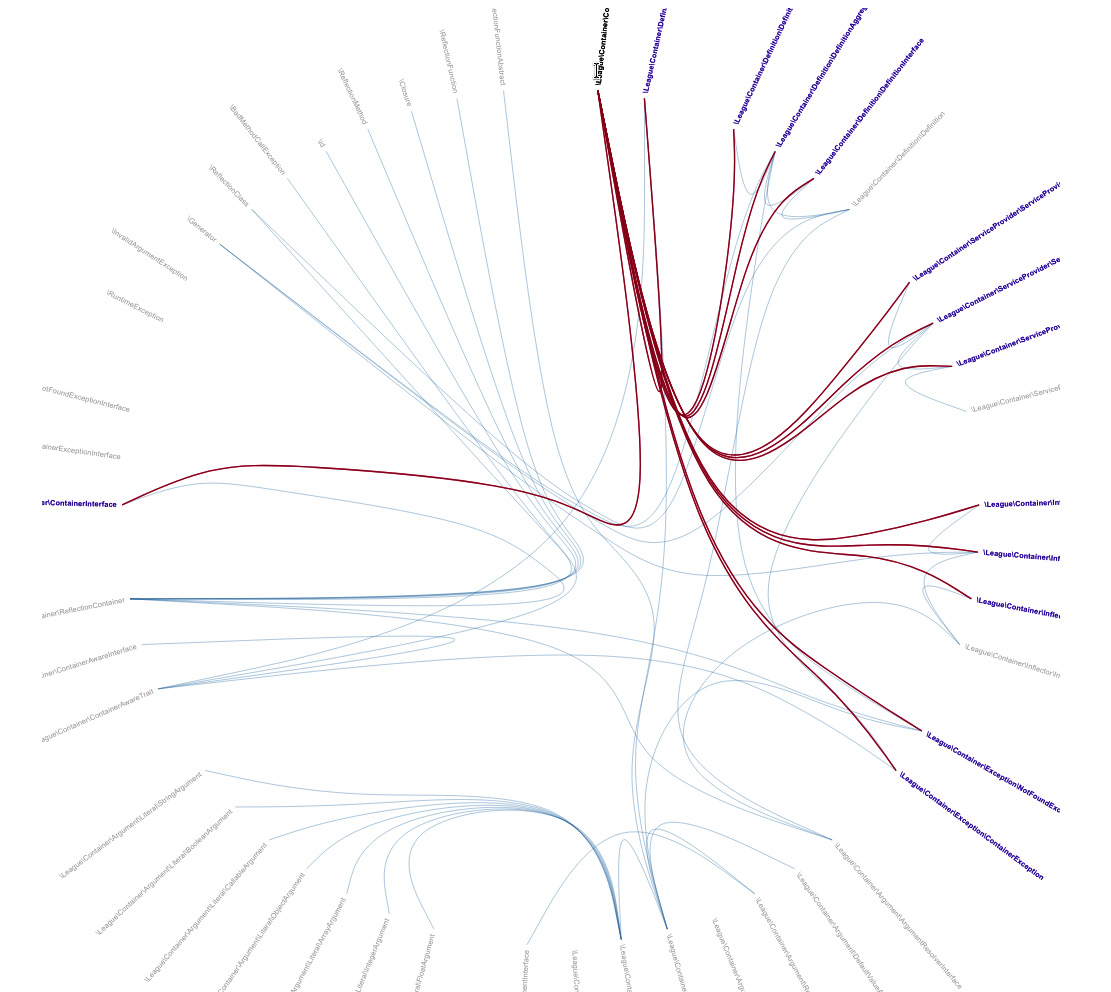
Figure 8.5: An Object relations graph
Coupling
The coupling of classes states how they depend on each other. There are two main metrics:
- Afferent couplings (Ca) tell you the number of classes that depend on this class. Too many dependencies indicate the importance of a class for the project.
- Efferent couplings (Ce) give you an idea of how many dependencies a class uses. The higher this is, the more the class depends on others.
Package-oriented metrics
The last graph we want to show you is the Abstractness vs. Instability graph. As the name already indicates, it shows the relationship between abstractness and the instability of packages. It was introduced by Robert Martin and is based on his work on object-oriented metrics. Figure 8.6 shows you an example:
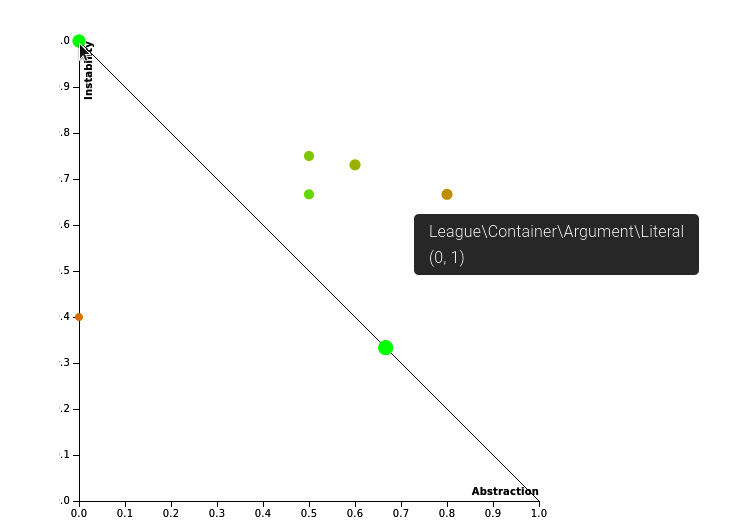
Figure 8.6: An Abstractness vs. Instability graph
But what exactly do these two terms mean in the context of software development? Let us look at the following definitions:
- Abstractness (A) is the ratio of abstract base classes and interfaces to the number of total classes in a namespace or package. The more these abstract types are included in the package, the easier and less risky the changes become. A ranges from 0 (concrete) to 1 (abstract).
- Instability (I) tells you how vulnerable a package is to change, expressed through a ratio of the Ce to the total Ce and Ca (Ce + Ca). In other words, the more dependencies it has, the less stable it will be. I ranges from 0 (stable) to 1 (unstable).
Martin stated that packages that are stable and thus highly independent of other classes should also have a high level of A. Vice versa, unstable packages should consist of concrete classes. So, in theory, the A of a class weighs out its I. This means that ideally, A plus I should be 1 (A + I = 1). This equation also draws the angled line from the top-left to the bottom-right corner of the graph. You should strive to keep your packages close to the line.
In the actual report, you will find a table below the graph where you will find the values in more detail. If you hover the mouse pointer over a circle, a popup will appear that tells you the name of the class the circle represents, as well as the A (the first digit) and the I (the second digit).
Other information
This ends our tour through PhpMetrics. There is a lot more to discover, such as, for example, the ClassRank, where the famous PageRank algorithm from Google is used to rank the classes according to their importance (i.e., the number of interactions they have with other code parts). We can’t cover everything in this book – however, by now, you already know many of the metrics. Its documentation is quite helpful to you. You will find a link to it on every page in the upper-right-hand corner.
The pros and cons of using metrics
In the two previous chapters of this book, you have learned about many tools and metrics that exist solely to help you write better software. The knowledge and wisdom and countless hours of endeavor on the part of hundreds if not thousands of software engineers can be added to your project in a matter of minutes.
The other side of the coin is that you might already feel completely overwhelmed by the sheer number of possibilities. Which tools should you choose? Which metrics should you focus on in the future?
If you have that feeling already, do not worry. We will not leave you alone in all this mess but help you find a setup that fits your needs during the next chapters. To begin with, let us take the time to look at the pros but also cons of using code quality metrics.
The pros
First, each software project is a unique piece of work. It grows based on certain circumstances, such as the skill sets of the developers and the available packages or frameworks at that time, but also external factors, such as deadlines, which often enough affect code quality negatively.
Code metrics help you to get an overview of the current state that a project is in. If you, for example, take over a project made by a former team member, you want to know what awaits you. By having an idea of the code quality, you can immediately adjust your estimated efforts on future tickets in whatever direction.
Code quality metrics also help you understand where code needs to be improved. It is excellent training to refactor your code, and by using the metrics, you know when you have succeeded. Regardless of whether you are working on your own pet project, you want to contribute to an open source project, or you work in a team, it is always a nice achievement to finally get some more green lights on the reports.
If you found a piece of code that urgently needed refactoring for a valid reason, but your project manager did not want you to do it, you could use the metrics to show them how terrible things are and that it is just a judgement based your own opinion. Code metrics are unbiased and (painfully) honest.
Finally, another important use case of these metrics is to prevent you from writing bad code in the first place. Sometimes, it might be a bit annoying to write code that adheres to all these rules but be assured that the effort pays off eventually.
The cons
Previously, we said that deadlines can harm code quality because they keep us from refactoring code smells or adding more tests. While this is true, we must be aware that once they start by measuring the quality of their code, some developers start to refactor a lot more code than necessary because they get rewarded with better metrics. Why is that problematic?
For example, imagine there is a class in your current project that has a low maintainability index, high NPath complexity, and just by looking at it, you can immediately see how bad it is. However, it has matured over time, being fixed so often that at some point, it has proven to work without bugs. Now, your tools tell you that this class is of bad quality. Should you still jump on it and start refactoring it?
There is, of course, no clear yes or no. As mentioned previously, if you work on code in your spare time, it makes sense (and is fun, too) to refactor a class to remove most of the code smells. If you are working on commercial projects, as in, working as a software engineer for a living, you will not always have the time to do so. There are bugs to squeeze, which make the users of your software unhappy, while on the other hand there are features to implement, for which they are desperately waiting. Overall, it is the satisfied customers who pay your bill. Finding the sweet spot between development speed and code quality is never easy – you just need to be aware that you sometimes have to take the bitter pill and leave bad code alone for now.
Do not use metrics to compete against colleagues, or worse, to talk badly about former developers who left you alone with the project. Be aware that everybody works as well as possible, based on their skills. Nobody deliberately tries to write bad code – often enough, it happens because the developers have never heard about clean coding principles or they were under such sheer time pressure that they had to do copy and paste coding to make their managers or customers happy. Your work environment should be a place of respect, helpfulness, and tolerance, not competition.
Summary
This chapter introduced you to some of the most used code quality metrics in the PHP world. Furthermore, we presented you with the tools that help you gather them. Of course, there are many more that we could not cover in this book, but you do not have to know them all – you are now equipped with a solid understanding of code quality metrics that will help you in your daily working routine.
Code quality tools and metrics are surely no silver bullet for all problems. On the one hand, they can be extremely helpful for improving your code. On the other hand, you should not take them as the ultimate measure. There are numerous examples of successful types of software that would never pass these quality checks, such as WordPress. Be sure, though, that the creators of WordPress would have done things differently if they had known beforehand.
In the next chapter, we will leave the realm of theory. We will learn how to organize the tools that we introduced in the last two chapters into our projects. Every project is unique, so we will offer you different flavors to fit your needs.
Further reading
- dePHPend (https://dephpend.com/) is a tool that can draw UML diagrams for your PHP code and be used to spot problems in your architecture.