
11
Continuous Integration
You have learned the theory about writing clean PHP: Hypertext Preprocessor (PHP) code, and you now know the necessary tools and metrics that help us to achieve and keep to high quality levels. However, what is still missing is the integration of all these technologies into a workflow that facilitates your daily work.
In the following pages, we will elaborate on continuous integration (CI) and learn by example how to set up a simple but effective automated workflow.
Furthermore, we will show you how to set up a selection of code quality tools locally in a way that they support you the most, without having to manually run them. Additionally, we will tell you some best practices about how to add these workflows to an existing project.
The main topics we will cover are listed here:
- Why you need CI
- The build pipeline
- Building a pipeline with GitHub Actions
- Your local pipeline—Git hooks
- Excursion—Adding CI to existing software
- An outlook on continuous delivery (CD)
Technical requirements
Additional to the setup of the previous chapters, you will require a GitHub account to be able to follow all examples. This will come with no additional costs, though, as we are only using the free plan.
The example application that we will use in this chapter can be downloaded from the GitHub repository to this book: https://github.com/PacktPublishing/Clean-Code-in-PHP/tree/main/ch11/example-application.
Why you need CI
Writing software is a time-consuming and thus costly process. If you develop software for fun, it will “only” cost you your leisure time. If you work for a company (be it as a contractor or full-time employee), the time is even more valuable, as you get paid for it. As a matter of fact, companies want to reduce costs, and thus they do not want to spend more money on a feature than necessary.
A big part of our daily work is to fix defects. Delivering bug-free software is something that probably all developers would like to achieve. We do not make mistakes deliberately, yet they will always happen. There are ways, however, to reduce the costs of bugs.
The costs of a bug
A bug is considerably costly because it adds no value to the product. Therefore, we aim to catch these bugs as early as possible—the earlier we catch them, the fewer costs they will cause. The following screenshot visualizes how the costs to fix a bug increase significantly the later it appears in the development process:
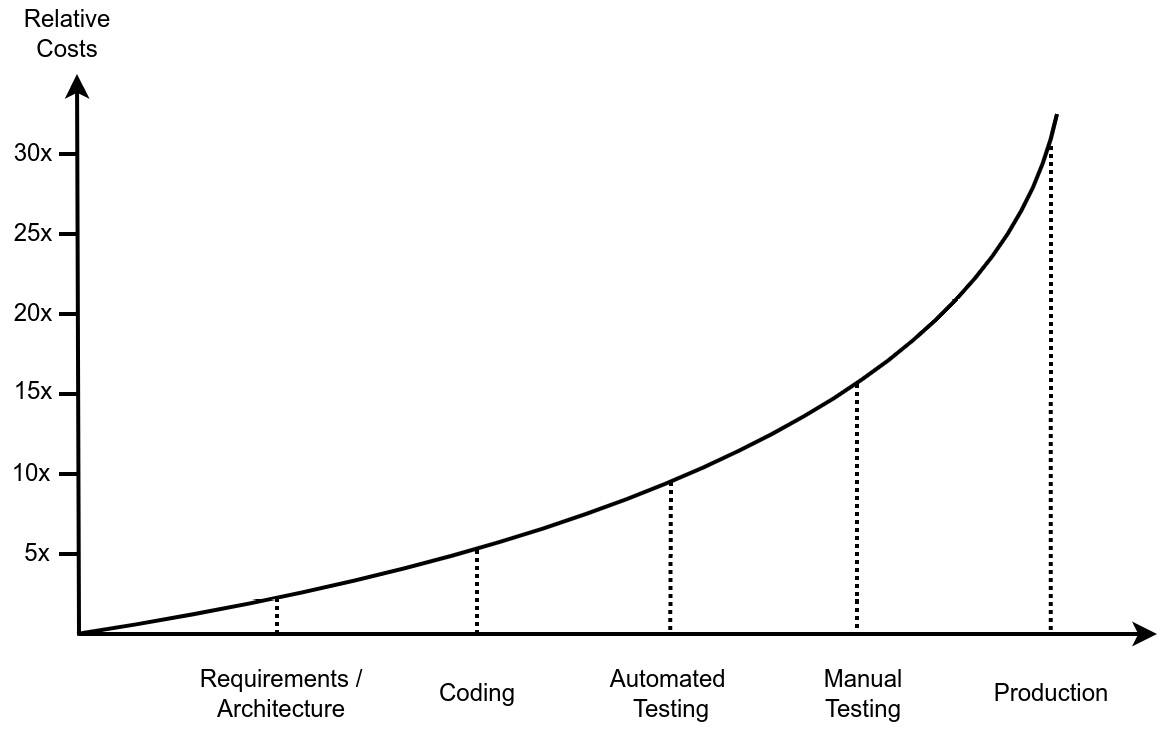
Figure 11.1: Estimated relative costs of fixing a bug based on the time of its detection
But what is the reason for the massive cost increase over time? And why do bugs even cost money?
In the early stages, costs mainly arise from the required time to resolve the issue. If a bug could have been avoided just by better requirements, for example, then this requires less effort as it was discovered during the manual testing. If a bug was found in production, many people are involved in fixing it: first, a helpdesk employee needs to acknowledge the bug reported by a customer and pass it over to the quality assurance (QA) engineer, who reproduces it and writes a proper bug ticket.
This ticket then gets assigned to the product manager, who, after taking time to reproduce and verify the defect as well, plans it in for the next sprint. The ticket eventually gets assigned to one developer, who will need some time to reproduce and fix it. But it is not over here because the bug fix probably requires a code review from another developer and gets double-checked from the product manager or QA engineer as well before it can finally be released.
Once “escaped” from the developer’s local environment, all this overhead raises the costs of the defect significantly. Additionally, if the bug is already in production, it can lead to customers not wanting to use the product anymore because they are no longer happy with it. This is called customer churn.
Even if you are not working on a commercial product, but—for example—on an open source project, the concept can be translated into time or effort. A bug will lead to an issue report that you first need to read and understand, probably asking some more questions, and waiting for the ticker author to reply. If your software is too buggy, people will use it less, and all your previous efforts might have been in vain at some point.
How to prevent bugs
Fortunately, we now have a whole toolbox at your side that can help us find bugs in your code before somebody else does. We just have to use it—and this is already a problem because we developers are usually lazy people.
Of course, you could run all the tools manually before every deploy. Let us say you want to deploy some code to production. After merging the code into the main branch, the following steps should be executed to ensure that no broken code gets delivered to production:
- Using the PHP linter to ensure the syntactical correctness of the code
- Executing a code style checker and fixer to keep the code styling aligned
- Finding potential issues using static code analysis
- Execution of all automated test suites to ensure your code still works
- Creating reports for the used code quality metrics
- Cleaning up the build folder and creating an archive of the code to deploy
This is quite a list of things to keep in mind. Nobody would do this over a longer period without making mistakes at some point, so, naturally, you would start writing scripts that help you to execute these steps in one go. This is already a good improvement, and we will also make use of it a bit further on in this chapter.
Introducing CI
Running all the steps from the previous section in your local environment will take some time, and during the checks run, you can hardly work on anything else, so you have to wait until they are finished. So, why not load this whole workflow onto another, dedicated server?
This is precisely what CI does: it describes the automated process of putting all necessary components of your application together into a deliverable so that it can be deployed to the wanted environments. During the process, automated checks will ensure the overall quality of the code. It is important to keep in mind that if one of the checks fails, the whole build will be considered as failed.
There are many CI tools available, such as Jenkins, which is usually self-hosted (that is, operated by you or someone in your team or company). Or, you can choose paid services such as GitHub Actions, GitLab CI, Bitbucket Pipelines, or CircleCI.
You will often read the abbreviation CI/CD, and we will also use it throughout this book. CD stands for continuous delivery, a concept that we will cover at the end of this chapter. For now, you do not need to care about it, though.
Setting up one of these tools sounds like a lot of work, but it also has some great benefits, such as the following:
- Scalability: If you work in a team, using the local setup will quickly cause problems. Any changes to the build process would need to be done on the computer of every developer. Although the build script would be part of your repository, people may forget to pull the latest changes from it before deploying, or something else might go wrong.
- Speed: Automated tests or static code analysis is a pretty resource-consuming job. Although today’s computers are powerful, they have to do a lot of concurring tasks, and you do not want to additionally run a build pipeline on your local system. CI/CD servers are doing only this one job, and they are usually doing it fast. And even if they are slow, they still take the load from your local system.
- Non-blocking: You need a build environment to run all the tools and checks on your code. Using your local development environment for this will simply block it for the duration of the build, especially when you use slower test types such as integration or end-to-end (E2E) tests. Running two environments on your local system—one for development and one for CI/CD—is not recommended, as you will quickly end up in a configuration hell (just think of blocking a database of web server ports).
- Monitoring: Using a dedicated CI/CD server will let you keep an overview of who deployed what and when. Imagine that your production system is suddenly broken—using a CI/CD server, you can immediately see what the last changes have been and deploy the previous version of your application with a few clicks. Furthermore, CI/CD tools keep you up to date and inform you—for example—via email or your favorite messenger application about any build and deploy activities.
- Handling: A handwritten deployment script will surely do the work, but it takes a lot of time to make it as comfortable and flexible as a modern CI/CD solution. Plus, if you go with the business standards, it is much more likely that other developers of your team will already have experience with it.
The preceding points hopefully give you an idea of how much you will benefit from using CI. An integral part of each CI/CD tool is the so-called build pipeline, which we will explain in detail in the next section.
The build pipeline
In the previous section, we listed the many necessary steps to make our code ready to be shipped to production. In the context of CI, a combination of these steps is what we call the build pipeline: it takes the input (in our case, all the application code), runs it through several tools, and creates so-called build artifacts out of it. They are the outcome of a build—usually, this includes the deliverable (a package of the application code that is ready to be moved to the desired environment), plus additional data, such as build logs, reports, and so on.
The following diagram gives you a schematic overview of what a typical build pipeline could look like. Since it is not executed in your local environment, it requires two additional steps: creating a build environment and building an application:
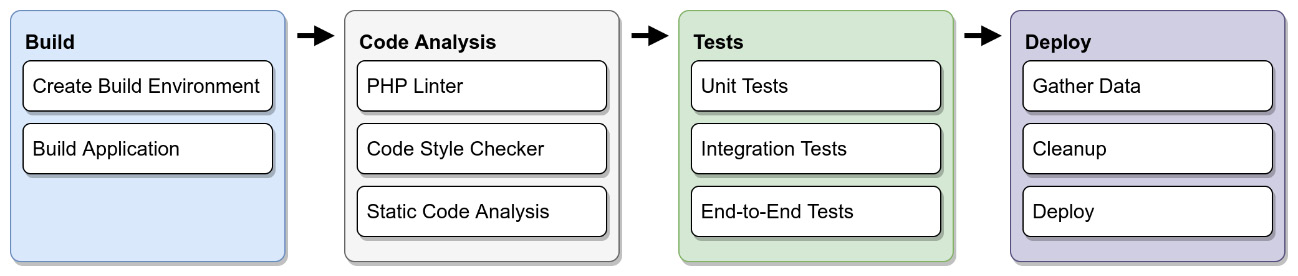
Figure 11.2: Schema of a CI pipeline
Other languages in the pipeline
In this book, we will only have a look at the PHP-related parts of the pipeline, yet a modern web application does not only consist of PHP. Especially for the frontend-facing code, there is another whole universe of tools that needs to be part of the pipeline, too. Yet in the end, the process is very similar.
In the next sections, we will go into more detail about every build stage. We will keep it theoretical at first, and then give examples of technical implementation later in this chapter.
Stage 1: Build project
The CI pipeline requires a dedicated build instance of our application, where we can run all tools and checks on it isolated. This can roughly be divided into two steps: creating a build environment and running the necessary build tools.
Creating a build environment
To build an application somewhere else than on the local development system, we first need to create a build environment. How exactly the environment is provided depends on the used CI/CD tool. This can either be a dedicated server that offers separated workspaces for every project, or a completely containerized Docker environment, which is spun up every time you require it and only lasts for the duration of the build.
Once a build environment exists, we need to download all the source code there, but without external packages or other dependencies for now. Most likely, your code will be stored in a Git repository and either hosted on a private Git server, or a commercial service. Downloading a copy of a specific branch of a repository is called checkout.
We have to pay attention to which branch of the repository the code gets checked out from. This depends on what you want to build. If you intend to check the code of a pull request (PR) (a set of changes to the code, which someone requests to be integrated into the code base), then you need to check out the branch of that feature. If you wish to upload the latest version of your application to production, you want to check out the main branch.
Main versus master branch
Throughout the history of computers, the terms master and slave have been widely used, be it for hard disk configuration, database replication, or—of course—Git. However, these terms are harmful to many people, so the information technology (IT) people decided to finally change this into less offensive terms, such as main and replica. GitHub, for example, by default calls the main branch simply main instead of master nowadays. You will still find repositories out there that use the old branch name. In this book, though, we will stick with the new terminology.
Do not worry, however, if your project is not hosted using Git—this step is still necessary because we need to get the code on the CI/CD server. Be it via Git, Mercurial, Subversion (SVN), or even direct file download, it does not matter in the end. The outcome of this step is to have the code we want to deploy readily available on the CI/CD server so that we can start installing the dependencies in the next step.
Building the application
Building the application is similar to installing it on a new system. In the previous step, we made sure that the source code is available in the environment. In this step, we need to execute any required build steps. This usually includes the following:
- Installing external dependencies: Your repository should only contain your own code, with no external dependencies. These we manage, for example, via Composer or the PHAR Installation and Verification Environment (Phive).
- Creating configuration files: Your repository should not contain any passwords or other confidential data such as application programming interface (API) keys. They can be securely stored in the CI/CD tool and used to create an environment file (.env, for example) during this stage.
- Preparing the test database: To run integration or E2E tests, the build instance needs a working database. Commonly, this is done by creating a test database, importing the database schema, running any additional database migrations, and—finally—populating the database with test data.
To reduce the build time, many modern CI/CD tools offer caching. If activated, they will keep the dependencies in temporary storage after the first download. It is generally a good idea to turn this on, if not activated by default.
Stage 2 – Code analysis
We covered code quality tools in Chapter 7, Code Quality Tools, in detail. Now, it is time to add these tools to our pipeline to ensure that they will be executed for every change that gets introduced.
PHP linter
If you merge code into another branch, it can always happen that the code breaks. Git has very sophisticated merge algorithms, but still, it cannot do magic. Given that you have a test suite with high coverage, some tests will surely break if there were a syntax error that had been caused by the merge. So, why should we run this extra step? We recommend it because the PHP linter has two advantages: it runs very fast, and it will check all PHP files, no matter if there are tests for them or not.
We want our pipeline to fail fast if any issues have been detected. Therefore, before you execute any long-running tasks, it makes sense to run a quick syntax check in the beginning. They would break in any case, and you would lose some valuable time. As a rule of thumb, the faster the check runs, the earlier it will appear in the pipeline.
Code style checker
After checking the code syntax, it is time to check the code style. This operation is fast too, so it makes sense to run it early in the pipeline. For our example, we will go with the PHP Coding Standards Fixer (PHP-CS-Fixer), which we already introduced in Chapter 7, Code Quality Tools.
There is a subtle but important difference between running PHP-CS-Fixer locally and in the CI/CD pipeline: for the latter, we will only use it to check the code, but not to fix it. We do not want the pipeline to change our code, just to analyze it. In other words, our pipeline will only check if the code is correctly formatted (according to the rules we defined), but it will not attempt to fix it automatically; if any of the rules are violated, the build has failed.
No rules are saying that the CI/CD pipeline should not change the code. However, it adds complexity to automatically commit the changes to the repository during the process. Moreover, it requires a very well-tested application, and you need to trust that the tool of your choice does not break anything. Usually, they work well, but do you want to risk it?
In your local environment, it makes sense to run the fixer alongside the code style checker. We will discuss the local setup in one of the next sections of this chapter.
Static code analysis
At this point, we know that our code is syntactically correct and formatted according to our rules. Both previous checks are usually performed quickly, so our build would fail early if any of those easy-to-detect problems had occurred.
Now, it is time to run the slower tasks. The static code analysis usually takes a bit longer than the two previous ones, but it is by far not as slow as running the automated tests. Essentially, this step is not that different from the linting and code style checking: if the rules we have defined earlier are violated, the build will fail.
If you are introducing CI to an existing project, the challenge is to find the sweet spot in error reporting. On the one hand, you want to keep the developers happy and not force them to fix dozens of issues introduced by other developers on every file they touch. On the other hand, you need to set the threshold tight enough to enforce at least some refactoring with every code change.
There is no golden rule here, unfortunately, and you need to experiment with the settings. At a later point, when most of the issues of the static code analysis reports are solved, you need to tighten the error reporting rules a little so that your project does not stagnate at a certain level.
Stage 3 – Tests
Once our code has reached this point in the pipeline, we are convinced that it is syntactically correct, adheres to our code styling guidelines, and has no general flaws according to our static code analysis rules. So, we will now run the step in the pipeline, which usually takes the longest time: the automated tests.
As we introduced in the previous chapter, there are more than just unit tests to consider. Often, a project such as a web service has at least some integration tests to ensure that the service is working fine as a whole, including the database transactions. Or, if your project is a classical web application, you might have an E2E test suite that utilizes a browser to virtually click through it.
We want to apply the same approach here that we did for the build steps: start with the fast-running tests, and then continue with the slower ones. If the unit tests are failing already, you do not need to wait for the results of the E2E tests. So, for the tests, the execution order would usually be this:
- Unit tests
- Integration tests
- E2E tests
If only one test of whatever type fails, the build will be marked as failed. If they all pass, we have already passed the most critical part of the pipeline. Our application is ready to be deployed, so now, it is time to clean up and prepare the deliverable.
Stage 4 – Deploy
Our code has been checked thoroughly by various tools, and we are confident that it adheres to our standards. We can now prepare the build artifacts and finally deploy the application. Let us have a look at what needs to be done for this.
Gathering data
During the previous stages, all tools we used produced some sort of data, be it through writing to the standard output (stdout), or if you configured that, by creating reports that summarize the performed actions.
You can, for example, upload generated reports to dedicated storage or push them to your repository. Or, you can use the code coverage report of PHPUnit and automatically create a code coverage badge from it, which you can add to the README of your GitHub project.
The most important use case, though, is to debug if any of the stages have failed. You can never have enough debug output in case something goes wrong, so it is a good idea to set the verbosity of your tools to a higher level. Your CI/CD tool usually takes care that everything that was written to the stdout is made available after the execution of the build pipeline.
Cleanup
Before we upload the application somewhere, we want to make sure that it does not contain any unnecessary ballast. This includes removing logs or reports from previous stages or deleting the code quality tools. Remember, we should only deploy code to production that is necessary for the application to run—development tools such as PHPUnit are not built with security in mind (https://phpunit.readthedocs.io/en/9.5/installation.html#webserver).
Deploy
To deploy the code to the target environment, we need to wrap it up into an asset that can be easily moved there. This asset is also called a deliverable. The type we choose for the deliverable depends on how the application has to be deployed to production. A common type for such a deliverable is simply an archive of the code that has to be deployed.
For example, if your production environment is running on a classic on-premises web server, we need to create an archive of the application code, upload it to the target server, and extract it from there.
The de facto standard today is a containerized environment using Docker. Once the build instance has been thoroughly tested, a Docker image can be created from it. This image will then be uploaded to an image repository such as Amazon Web Services Elastic Container Repository (AWS ECR). Such an image repository hosts all your images, so they can be used to spin up new containers when needed. This approach paved the way for highly scalable web applications as we have them today, so designing your application to be Dockerizable from the beginning will pay off if your application, at some point, needs to scale.
Containers and images
If you are new to Docker, the concept of containers and images can be confusing. In short, an image contains all the data, but is read-only and cannot be used alone. To make it usable in the Docker environment, it requires a container that contains all information from the image and offers the required functionality to connect to other containers of your setup. Since you can create as many containers as you need from an image, you can also think of it as a container template.
If you want to know more about Docker, we recommend you check the official documentation at https://docs.docker.com/get-started/overview. There are also tons of tutorials, online courses, and other information to be found on the internet.
We now have a good idea of what a build pipeline could look like. Before we start setting up our example pipeline, one more thing needs to be clarified—when will it be executed?
Integrating the pipeline into your workflow
After setting up all the necessary steps, we finally need to integrate the pipeline into your workflow. CI/CD tools usually offer you different options on when a pipeline gets executed. In the beginning, this can, of course, be done manually by clicking a button. This is not very comfortable, though. If you use hosted Git repositories such as GitHub, GitLab, or Bitbucket, you can connect them with your build pipeline and start the build whenever a PR was created or a branch got merged into the main branch.
For huge projects where the build takes hours, it is also common to run a build for the current code base at nighttime (so-called nightly builds). The developers then get their feedback from the pipeline the next day.
Running a build requires some time, and of course, the developers should not sit in front of the screens and wait until they can continue with their work. They should rather be informed as soon as the build succeeded or failed. All CI/CD tools nowadays offer multiple ways to notify the developer, mostly by email and by messages in chat tools such as Slack or Microsoft Teams. Additionally, they often also offer dashboard views, where you can see the status of all the builds on one screen.
You now should have a good idea of what a build pipeline could look like for your project. Therefore, it is time to show you a practical example.
Building a pipeline with GitHub Actions
After learning about all the stages of CI, it is time to practice. Introducing you to all the features of one or more CI/CD tools is out of scope for this book; however, we still want to show you how easy it can be to set up a working build pipeline. To keep the barrier to entry as low as possible for you and to avoid any costs, we have decided to use GitHub Actions.
GitHub Actions is not a classic CI tool like Jenkins or CircleCI, but rather a way to build workflows around GitHub repositories. With a bit of creativity, you can do much more than “just” a classical CI/CD pipeline. We will only focus on that aspect, of course.
You probably already have a GitHub account, and if not, getting one will not cost you anything. You can use GitHub Actions for free up to 2,000 minutes per month at the time of writing for public repositories, which makes it a great playground or a useful tool for your open source projects.
Example project
We created a small demo application to use during this chapter. You will find it here: https://github.com/PacktPublishing/Clean-Code-in-PHP/tree/main/ch11/example-application. Please note that it does not serve any other purpose than demonstrating the basic use of GitHub Actions and Git hooks.
GitHub Actions in a nutshell
GitHub Actions offers no fancy user interface where you can configure all stages. Instead, everything is configured via YAML Ain’t Markup Language (YAML) files that are stored directly in the repository. As a PHP developer, you are most likely experienced with using YAML files for all sorts of configurations—if not, do not worry, as they are easy to understand and use.
GitHub actions are organized around workflows. A workflow gets triggered by certain events and contains one or more jobs to be executed if the event occurred. A job consists of one or more steps that execute one action each.
The files have to be stored in the .github/workflows folder of a repository. Let us have a look at the first lines of the ci.yml file, which will be our CI workflow:
name: Continuous Integration
on:
  workflow_dispatch:
  push:
    branches:
      - main
  pull_request:
jobs:
  pipeline:
    runs-on: ubuntu-latest
    steps:
      - name: ...
        uses: ...
That is quite some information already. Let us go through it line by line:
- name defines how the workflow will be labeled within GitHub and can be any string
- on states which events should trigger this workflow; these comprise the following:
- workflow_dispatch allows us to manually trigger the workflow from the GitHub website, which is great for creating and testing a workflow. Otherwise, we would need to push a commit to main, or create a PR every time.
- push tells GitHub to execute this workflow whenever a push happens. We narrow it down to pushes on the main branch only.
- pull_request will additionally trigger the workflow on every new PR. The configuration might look a bit incomplete because there is no more information after the colon.
- jobs contains a list of jobs to be executed for this workflow, as detailed here:
- pipeline is the identifier (ID) of the only job in this YAML. We chose the word pipeline to illustrate that we can use GitHub Actions to build our CI/CD pipeline. Note that an ID must consist of one word or several words, concatenated by an underscore (_) or a dash (-).
- runs-on tells GitHub to use the latest Ubuntu version as a runner (that is, as a platform) for this job. Other available platforms are Windows and macOS.
- steps marks a list of steps to be executed for this job. In the next section, we will have a closer look at this.
We have the basics of workflow configured now, so we can begin adding the build stages.
Stage 1 – Build project
The steps are what makes GitHub Actions so powerful: here, you can choose from a vast amount of already existing actions to use in your workflow. They are organized in GitHub Marketplace (https://github.com/marketplace). Let us add some steps to the workflow YAML, as follows:
steps:
  ###################
  # Stage 1 - Build #
  ###################
  - name: Checkout latest revision
    uses: actions/checkout@v3
  - name: Install PHP
    uses: shivammathur/setup-php@v2
    with:
      php-version: '8.1'
      coverage: pcov
Actions maintained by GitHub are to be found in the actions namespace. In our example, this is actions/checkout, which is used to check out the repository. We do not need to specify any parameters for now, as this action will automatically use the repository in which this workflow file is located.
The @V3 annotation is used to specify the major version to use. For actions/checkout, this would be version 3. Please note that the latest minor version is always used, which at the time of writing would be version 3.0.2.
The other action, shivammathur/setup-php, is provided by one of the many great people who make their work available as open source. For this step, we are using the with keyword to specify further parameters. In this example, we use the php-version option to have PHP 8.1 installed on the previously selected Ubuntu machine. Using the coverage parameter, we can tell setup-php to enable the pcov extension for generating code coverage reports.
Action parameters
Both actions introduced previously offer far more parameters than we can describe here. You can find more information about their functionality by looking them up in Marketplace.
Regarding the formatting, we used comments and blank lines between the steps to make the file more readable. There is no convention, and it is completely up to you how to format your YAML files later.
The next step is the installation of the project dependencies. For PHP, this usually means running composer install. Please note that we do not use the --no-dev option because we need to install the dev dependencies to perform all the quality checks. We will remove them at the end of the pipeline again.
Dependency management
We use the Composer workflow in this chapter as an example to manage our code quality tools, because this is the most common way. However, both other ways of organizing the code quality tools we introduced in Chapter 9, Organizing PHP Quality Tools, would work with GitHub Actions as well. In that chapter, we also explained the --no-dev option in detail.
This is what the next steps could look like:
- name: Get composer cache directory
  id: composer-cache
  run: echo "::set-output name=dir::$(composer config cache
    files-dir)"
- name: Cache dependencies
  uses: actions/cache@v2
  with:
    path: ${{ steps.composer-cache.outputs.dir }}
    key: ${{ runner.os }}-composer-${{
      hashFiles('**/composer.lock') }}
    restore-keys: ${{ runner.os }}-composer-
- name: Install composer dependencies
  run: composer install
GitHub actions require some manual work to make caching of Composer dependencies possible. In the first step, we store the location of the Composer cache directory, which we get from Composer using the config cache-files-dir command, in an output variable called dir. Note id: composer-cache here—we will need this to reference the variable in the next step.
Then, we access this variable in the next step by using the steps.composer-cache.outputs.dir reference (a combination of the id value we set in the previous step, and the variable name) to define the directory that should be cached by the actions/cache action. key and restore-key are used to generate unique caching keys—that is, the cache entries where our Composer dependencies are stored.
Lastly, we use the run parameter to directly execute composer install, as if we would execute it locally on an Ubuntu machine. This is important to keep in mind: you can, but you do not have to use existing GitHub actions for every step—you can just execute pure shell commands (or equivalent commands on Windows runners) as well.
There are also actions in Marketplace that take over the writing of commands, such as php-actions/composer. We do not have a preferred solution here; both will work fine.
Because we want to run integration tests on the API of our example application, we need to have a web server running. For our simple use case, it is totally enough to use the PHP built-in web server, which we can start using in the following step:
- name: Start PHP built-in webserver
  run: php -S localhost:8000 -t public &
The -S option tells the PHP binary to start a web server that is listening on the localhost address and port 8000. Since we start in the root folder of our project, we need to define a document root folder (the folder where the web server looks for files to execute) using the -t option. Here, we want to use the public folder, which only contains the index.php file. It is good practice to not store any other code in the document root folder since this makes it harder for attackers to hack our application.
PHP built-in web server
Please note that the built-in web server of PHP is only to be used for development purposes. It should never be used in production, since it was not built with performance or security in mind.
You surely noticed the ampersand (&) at the end of the command. This tells Linux to execute the command, but not wait for its termination. Without it, our workflow would get stuck at this point because the web server does not terminate by itself, as it needs to keep listening for requests until we run our integration tests at a later stage.
The setup of our build environment is complete. Now, it is time to run the first code quality checks on our sample application.
Stage 2 – Code analysis
In the first build stage, we created our build environment and checked out our application code. At this point, the application should be completely functional and ready to be tested. Now, we want to do some static code analysis.
The standard approach is to use dedicated GitHub actions for each tool. The benefit is that we keep the development tools away from the build environment, as they will be executed in separate Docker containers that will be discarded right after use. There are some drawbacks to this approach, though.
Firstly, with each action, we introduce yet another dependency, and we rely on the author to keep it up to date and not lose interest in maintaining it after a while. Additionally, we add some overhead, since Docker images are usually many times bigger than the actual tool. And lastly, when our application setup gets more complicated, running the code quality tools in separate Docker containers can cause issues, simply because it is not the same environment as the build environment. Sometimes, already tiny differences can cause problems that keep you engaged for hours or days in solving them.
As we saw in the previous section, we can simply execute Linux shell commands in the build environment, so nothing speaks against executing our code quality tools directly on the build environment—we just need to make sure to remove them afterward so that they do not get released into production.
In our example application, we added PHP-CS-Fixer and PHPStan to the require-dev section of the composer.json file. By adding the following lines of code to our workflow YAML, we will let them execute as the next steps:
###########################
# Stage 2 - Code Analysis #
###########################
- name: Code Style Fixer
  run: vendor/bin/php-cs-fixer fix --dry-run
- name: Static Code Analysis
  run: vendor/bin/phpstan
We do not need many parameters or options here, since our example application provides both the .php-cs-fixer.dist.php and phpstan.neon configuration files, which both tools will look up by default. Only for PHP-CS-Fixer will we use the --dry-run option because we only want to check for issues during the CI/CD pipeline, and not solve them.
Setting the scope of checks
For our small example application, it is OK to run the preceding checks on all files because they will execute quickly. If our application grows, however, or we wish to introduce CI/CD to an existing application (which we will discuss further on in this chapter), it is sufficient to run these checks on those files that have only changed in the latest commit. The following action could be helpful for you in this case: https://github.com/marketplace/actions/changed-files.
If neither PHP-CS-Fixer nor PHPStan reports any issues, we can safely execute the automated tests in the next stage: the tests.
Stage 3 – Tests
Our code has been thoroughly analyzed and checked for bugs and syntax errors, yet we need to check for logical errors in our code. Luckily, we have some automated tests to ensure that we did not inadvertently introduce any bugs.
For the same reasons as for the code quality tools in Stage 2, we do not want to use a dedicated action for running our PHPUnit test suites. We simply execute PHPUnit as we would on our local development system. Using the phpunit.xml file clearly proves useful here since we do not need to remember all the many options to use here. Let us have a look at the workflow YAML first, as follows:
###################
# Stage 3 - Tests #
###################
- name: Unit Tests
  run: vendor/bin/phpunit --testsuite Unit
- name: Integration Tests
  run: vendor/bin/phpunit --testsuite Api
The only thing worth noting here is that we do not just run all tests, but we split them up in two test suites: Unit and Api. Since our unit tests should execute the fastest, we want to run them (and fail) first, then followed by the slower integration tests. Please note that we did not add any E2E tests as our application does not run in the browser but is a mere web service.
We split the tests up by using the phpunit.xml configuration file. The following code fragment shows you its <testsuites> node, where we separate the suites by their directory (Api and Unit):
<testsuites>
    <testsuite name="Api">
        <directory>tests/Api</directory>
    </testsuite>
    <testsuite name="Unit">
        <directory>tests/Unit</directory>
    </testsuite>
</testsuites>
We also configured PHPUnit to create code coverage reports, as illustrated here:
<coverage processUncoveredFiles="false">
    <include>
        <directory suffix=".php">src</directory>
    </include>
    <report>
        <html outputDirectory="reports/coverage" />
        <text outputFile="reports/coverage.txt" />
    </report>
</coverage>
To create these reports, PHPUnit will automatically use the pcov extension, which we configured in Stage 1. They will be written into the reports folder, which we will take care of in the next stage.
That is already everything that needs to be done for the tests stage. If our tests did not discover any errors, we are good to go into the last stage of our pipeline and wrap everything up.
Stage 4 – Deploy
Our application is now thoroughly checked and tested. Before we are ready to deploy it into whichever environment we envisioned, we need to take care of removing the dev dependencies first. Luckily, this is very easy, as we can see here:
####################
# Stage 4 - Deploy #
####################
- name: Remove dev dependencies
  run: composer install --no-dev --optimize-autoloader
Running composer install --no-dev will simply delete all the dev dependencies from the vendor folder. Another noteworthy feature is the --optimize-autoloader option of Composer: since in production, we will not add or change any classes or namespaces as we would do in development, the Composer autoloader can be optimized by not checking for any changes, and thus disk access, speeding it up a bit.
As the very last step, we want to create build artifacts: one artifact is the deliverable—that is the code we intend to deploy. The other artifact is the code coverage reports we created in Stage 3. GitHub Actions will not keep any additional data than the logging information displayed on the GitHub website after the workflow YAML has been executed, so we need to make sure they are stored away at the end. The code is illustrated in the following snippet:
- name: Create release artifact
  uses: actions/upload-artifact@v2
  with:
    name: release
    path: |
      public/
      src/
      vendor/
- name: Create reports artifact
  uses: actions/upload-artifact@v2
  with:
    name: reports
    path: reports/
We use the actions/upload-artifacts action to create two ZIP archives (called artifacts here): release and reports. The first contains all files and directories we need to run our application on production, and nothing more. We omit all the configuration files in the root folder of our project, even the composer.json and composer.lock files. We do not need them anymore, since our vendor folder already exists.
The reports artifact will just contain the reports folder. After the build, you can simply download both ZIP archives separately on GitHub. More about this in the next section.
Integrating the pipeline into your workflow
After adding the workflow YAML to the .github/workflows folder (for example, .github/workflows/ci.yml), you only need to commit and push it to the repository. We configured our pipeline to run upon every opened PR or whenever someone pushes a commit to the main branch.
When you open https://github.com and go to your repository page, you will find an overview of your last workflow runs on the Actions tab, as shown in the following screenshot:
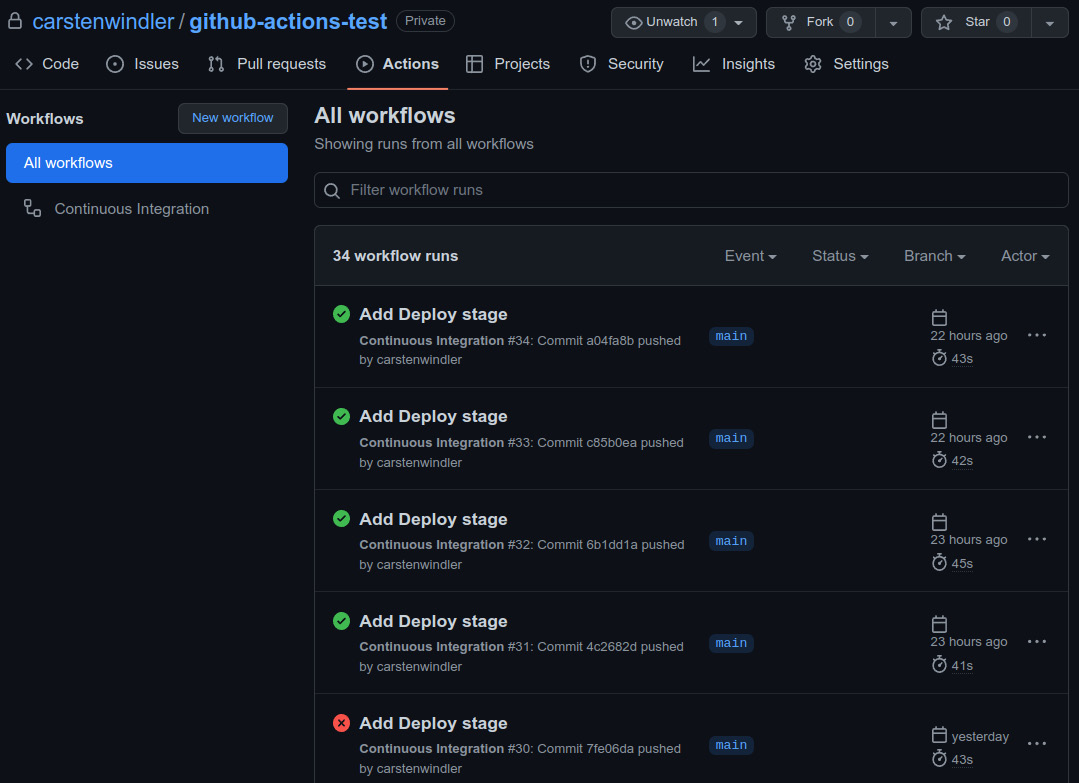
Figure 11.3: The repository page on github.com
The green checkmark marks the successful runs, while the red cross—of course—marks the failed ones. You can also see when they were executed and how long this took. By clicking on the three dots on the right side of each entry, you will find more options—for example, where you can delete the workflow run. Clicking on the title of the run, which is the corresponding commit message of the run, you will enter the Summary page, as shown in the following screenshot:
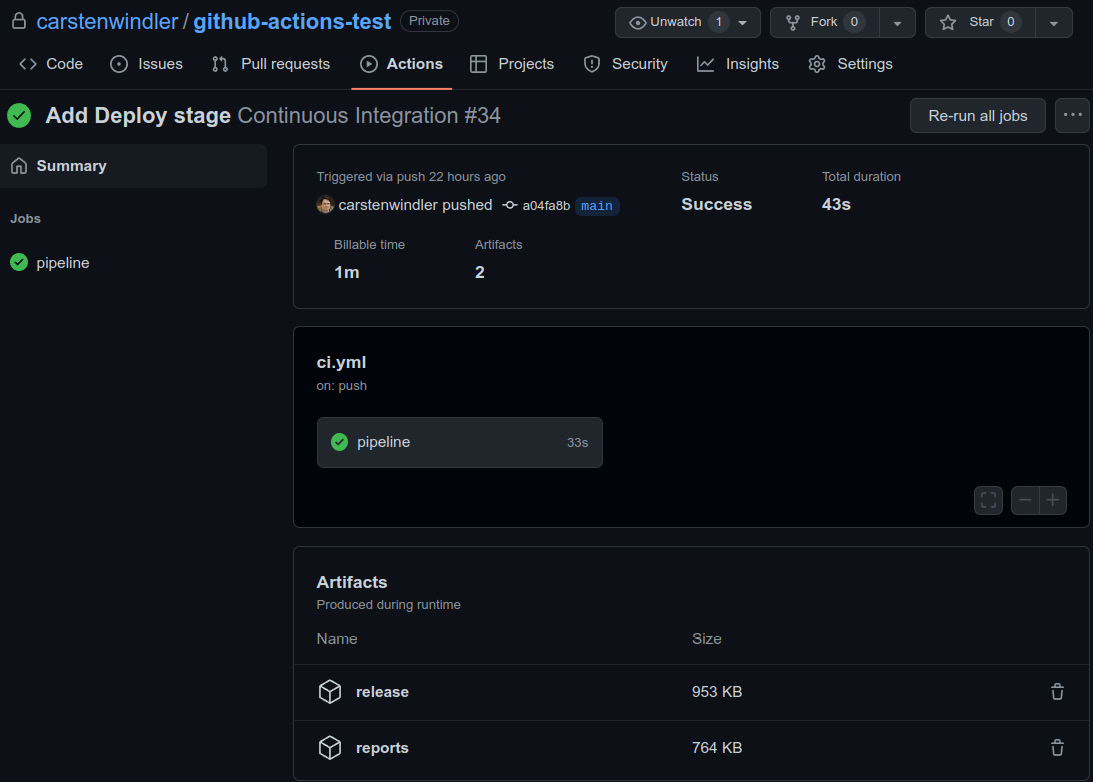
Figure 11.4: The workflow run summary page
Here, you can see all jobs of the workflow. Since our example only consists of one job, pipeline, you will only see one. On this page, you can also find any generated artifacts (such as our release and reports artifacts) and download or delete them. GitHub offers only limited disk space for free, so make sure to delete them when you are running out of space.
Another important piece of information is the billed time. Although our job only ran for 43 seconds in total, GitHub will deduct 1 minute from your monthly usage. GitHub offers a generous free plan, but you should have a look at your usage from time to time. You can find more information about this on your user settings page in the Billing and plans section (https://github.com/settings/billing).
If you want to see what exactly happens during the workflow run—for example, if something goes wrong—you can click on the pipeline job to get a detailed overview of all of its steps, as illustrated in the following screenshot:
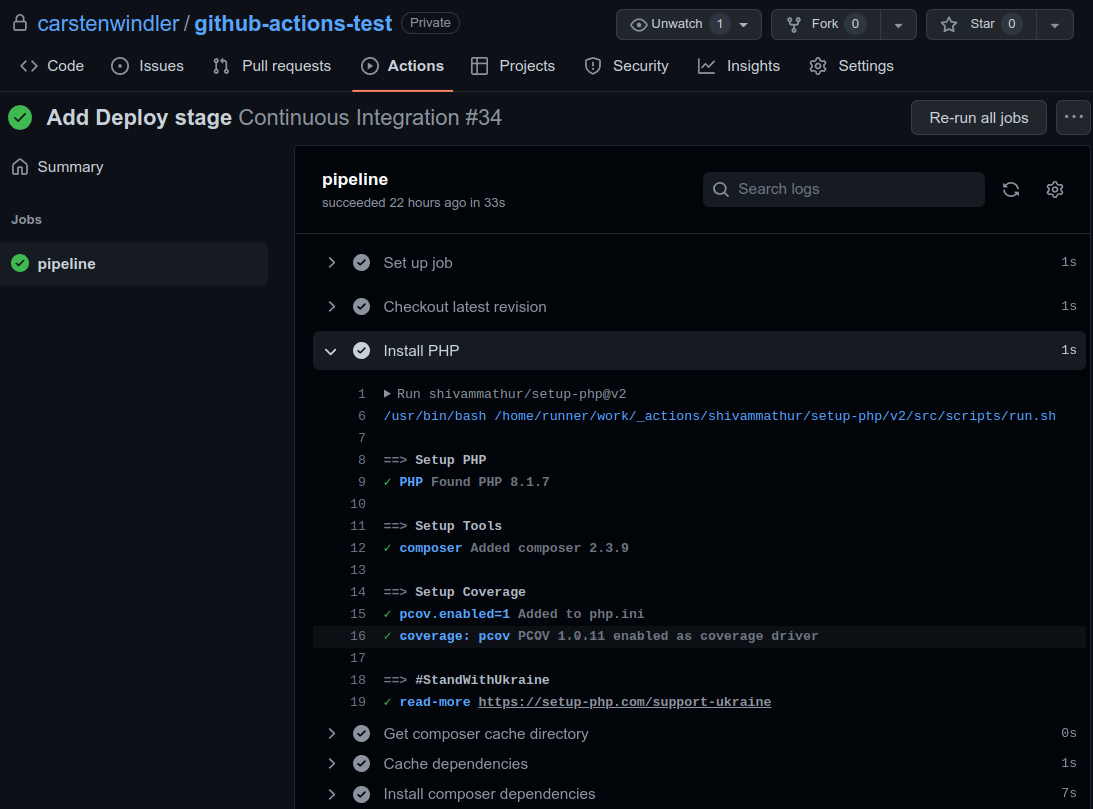
Figure 11.5: Job details page
Each step can be expanded and collapsed to get additional information about what exactly happened during its execution. In the preceding screenshot, we expanded the Install PHP step to see what the action did in detail.
Congratulations—you now have a working CI pipeline for your project! This ends our little tour through GitHub Actions. Of course, you can extend the pipeline as you like—for example, by uploading the release artifact to an SSH File Transfer Protocol (SFTP) server or an AWS Simple Storage Service (S3) bucket. There is a lot more than can be done, so make sure to experiment with it.
In the next section, we will show you how you can set up your local pipeline. This will save you some time and probably even costs by avoiding unnecessary workflow runs through early checks.
Your local pipeline – Git hooks
After we successfully set up a simple but already very useful CI/CD pipeline, we now want to look at running some steps already in the local development environment, even before committing them to the repository. This may sound like double work right now—why should we run the same tools twice?
Remember Figure 11.1–Estimated relative costs of fixing a bug based on the time of its detection, from the beginning of the chapter: the earlier we catch a bug, the fewer costs or the less effort it will cause. Of course, if we find a bug during the CI/CD pipeline, that is still much earlier than in the production environment.
The pipeline does not come for free, though. Our example application build was fast and just took roughly a minute. Imagine, however, a full-fledged Docker setup that already takes a considerable amount of time to create all the necessary containers. And now, it fails to build just because of a little bug that you could have solved within 2 minutes if you had not forgotten to execute unit tests before committing your code. You might have just taken a well-deserved tea or coffee break, only to find the build failed because of that when you came back. This is annoying and a waste of money as well as computational power.
Exactly those fast-running checks such as unit tests, a code sniffer, or static code analysis are what we want to execute before we start a full build for our changes. We cannot rely on ourselves to execute these checks automatically because we are humans. We forget things, but machines do not.
If you use Git for your development, which most developers do today, we can utilize the built-in functionality of Git hooks to automate these checks. Git hooks are shell scripts that are automatically executed on certain events, such as before or after every commit.
For our needs, the pre-commit hook is particularly useful. It will be executed each time you run the git commit command and can abort the commit if the executed script returned an error. In this case, no code would be added to the repository.
Setting up Git hooks
Setting up Git hooks manually does require some knowledge of shell scripting, so we want to use a package called CaptainHook to assist us. Using this tool, we can install any hook we like and even use some advanced features without the need to master Linux.
You can easily download the Phar by using Phive (see Chapter 9, Organizing PHP Quality Tools, for more information on that), or use Composer to install it, as we will do now:
$ composer require --dev captainhook/captainhook
Next, we need to create a captainhook.json file. This file contains the hook configuration for your project. Since this file will be added to the repository, we ensure that other developers in our team can use it. To create this file, we could run the following command:
$ vendor/bin/captainhook configure
CaptainHook will ask you a couple of questions and generate a configuration file based on your answers. You can skip this step, however, and create a file directly, as we will do now. Open your favorite editor, and write the following code:
{
    "config": {
        "fail-on-first-error": true
    },
    "pre-commit": {
        "enabled": true,
        "actions": [
            {
             "action": "vendor/bin/php-cs-fixer
               fix --dry-run"
            },
            {
                "action": "vendor/bin/phpstan"
            }
        ]
    }
}
Each hook has its own section. Within the pre-commit hook section, enabled can be either true or false—the latter disables the hook but keeps the configuration in the file, which can be handy for debugging purposes. actions contains the actual commands to execute. As you can see, these commands are like the ones you already know from Chapter 7, Code Quality Tools.
Every action you want to have executed needs to be written in a separate action section. In the preceding example, we configured PHP-CS-Fixer and PHPStan to be executed on pre-commit.
Since we have additional configuration files for both tools, we do not need the specify any further options, except telling PHP-CS-Fixer to only do a dry run—that is, to only inform us when a code style violation has been found.
In the config section, you can specify further configuration parameters. We want to stop the hook execution immediately after an error occurred, so we set fail-on-first-error to true. Otherwise, CaptainHook would first run all checks, and then tell you the results. This is, of course, just a matter of personal taste.
CaptainHook documentation
We cannot list all features of CaptainHook in this book. However, we encourage you to check out the official documentation at https://captainhookphp.github.io/captainhook to learn more about this tool.
As we are done now with the configuration, please store this JavaScript Object Notation (JSON) file under the name captainhook.json in the project root folder. That is already everything we have to do regarding the configuration.
We just need to install the hooks now—that is, generate hook files in .git/hooks. This can be simply done like so:
$ vendor/bin/captainhook install -f
We use the -f option here, which stands for force. Without this option, CaptainHook would ask us for every hook separately, if we want to install it. Please note that CaptainHook will install a file for every Git hook it supports, even for those which you did not configure. Those hooks will not do anything, though.
To test the pre-commit hook, you can execute this manually without having to commit anything using the following command:
$ vendor/bin/captainhook hook:pre-commit
Similar commands are available for all the other hooks that CaptainHook supports. If you made changes to the captainhook.json file, do not forget to install it by using the install -f command again.
To make sure that the hooks get installed in the local development environment, you can add the following code to the scripts section of your composer.json file:
"post-autoload-dump": [
"if [ -e vendor/bin/captainhook ]; then
vendor/bin/captainhook install -f -s; fi"
]
We use the post-autoload-dump event of Composer to run the install -f command. The command will be executed every time the Composer autoloader gets refreshed, which will happen every time composer install or composer update is executed. This way, we make sure that the hooks are installed or updated regularly in the development environments of anybody who works on this project. By using if [ -e vendor/bin/captainhook ], we check if the CaptainHook binary exists and avoid breaking the CI build if it is not installed.
Git hooks in practice
We completed the configuration of the pre-commit hook and tested and installed it. Now, we are ready to see it in action: if you do any change in the application code—for example, by adding a blank line somewhere in the ProductController.php file—and then try to commit the changes, the pre-commit hook should be executed. If the changes violated the PSR-12 standard, the PHP-CS-Fixer step should fail, as shown in the following screenshot:
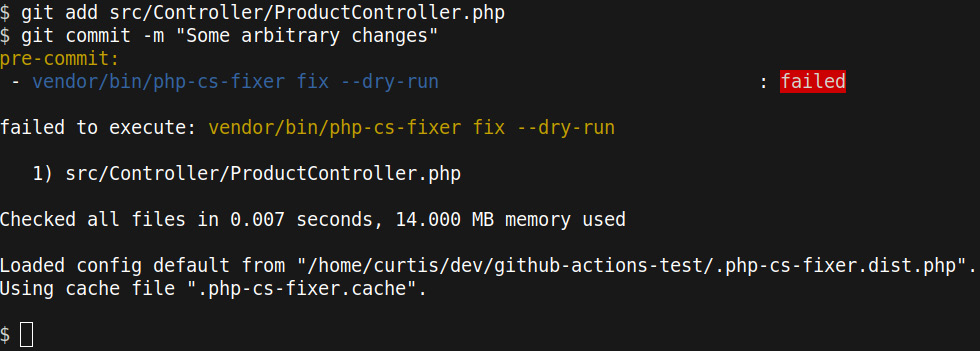
Figure 11.6: The pre-commit hook fails
Fixing code style issues automatically
Of course, you can remove the --dry-run option when executing PHP-CS-Fixer to let it fix issues automatically. In fact, this is a common practice, and we encourage you to try out the same. However, it requires a bit more work, because you must let the user know that their changed files have been fixed and that they need to be re-committed. To keep this example simple, we decided to omit this.
We now know that the ProductController.php file has to be fixed. We can let PHP-CS-Fixer do the work, as demonstrated here:
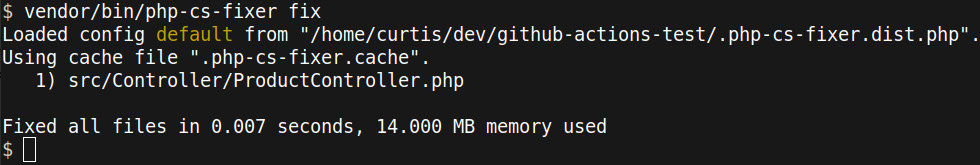
Figure 11.7: Using PHP-CS-Fixer to automatically fix code style issues
ProductController.php has been changed again now, and those additional changes have not yet been staged—that is, they have not yet been added to the commit. The previous changes are still staged, though. The following screenshot shows you what it would look like if you ran git status at this point:
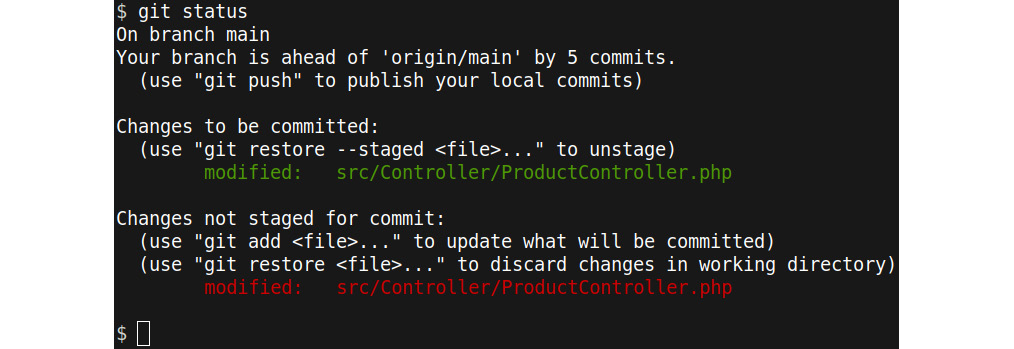
Figure 11.8: Unstaged changes
All that needs to be done now is to add the ProductController.php file again and run git commit again, as demonstrated in the following screenshot:
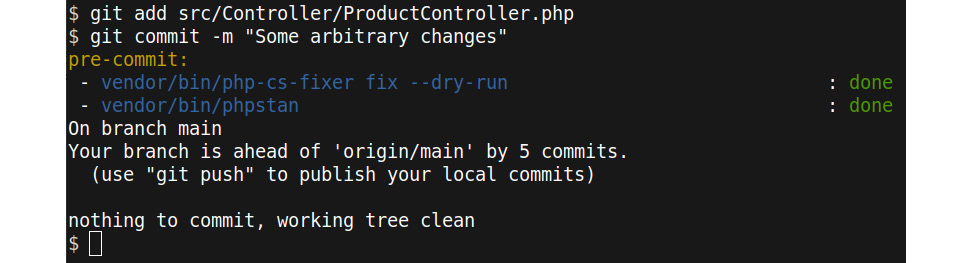
Figure 11.9: pre-commit hook passes
Both steps of the pre-commit hook pass now. All you need to do now is to git push the committed changes.
Advanced usage
The preceding example was a very basic one. Of course, there is much more that you can do in the local development environment already. You could, for example, add more tools such as the phpcpd copy and paste detector or the phpmd mess detector, both of which we introduced in Chapter 7, Code Quality Tools.
If your tests are not too slow (what exactly that means depends on your and your teammates’ patience), you should consider running your tests locally as well. Even if you have slow-running tests, you can separate them into several test suites, and only execute the fast-running tests on pre-commit.
You should also consider running code quality checks on modified files only and not the whole project, as we did in our example. CaptainHook provides the useful {$STAGED_FILES} placeholder, which contains all staged files. It is very convenient to use, as we can see here:
{
"pre-commit": {
"enabled": true,
"actions": [
{
"action": "vendor/bin/php-cs-fixer fix
{$STAGED_FILES|of-type:php} --dry-run"
},
{
"action": "vendor/bin/phpstan analyse
{$STAGED_FILES|of-type:php}"
}
]
}
}
The preceding example runs the checks only on modified PHP files. This has two main benefits: firstly, it is faster because you do not have to check code that you have not touched. The speedup, of course, depends on the size of your code base.
Secondly, especially if you are working on an existing project and just started introducing these checks, running them on the whole code base is not an option because you would need to fix too many files at once. We will discuss this in more detail in the next section.
Excursion – Adding CI to existing software
If you work in a company, you will not always start on the green—that is, build a new project from the ground up. In fact, most likely it will be the opposite: when you join a company, you will be added to a team that has been working on one or more projects for a long time already.
You probably came across the terms legacy software or legacy system already. In our context, they describe software that has existed for a long time and is still in use in business-critical processes. It does not meet modern development standards anymore, so it cannot be easily updated or changed. Over time, it becomes so brittle and hard to maintain that no developer wants to touch it anymore. What makes it even worse is the fact that because the system grew over a longer time, it has so much functionality that no stakeholder (that is, the users) would like to miss it. So, replacing a legacy system is not that easy.
Not surprisingly, legacy software has a bad connotation, yet probably, all the system needs is some “attention”. Think of it like the restoration of an old machine, where old parts get replaced with modern ones, while the outside is left unchanged. Some developers even find it extra challenging to work on such software. It has come a long way, earned its money, and—most likely (at least partly)—pawed the success of the company, so it deserves some respect.
So, if you have to work on such a project, do not give up quickly. With this book, we provided you with the necessary knowledge and tools to start bringing it into shape again—it just will take a bit longer, and you might never reach a perfect level. But being perfect is not necessary anyway.
Step by step
Start with adding integration and E2E tests. Both test types usually require no or just a few changes on the code but will bring great benefit, as they indirectly cover a lot of code without having to write unit tests. Once you’ve covered the critical paths (that is, the most used workflows) of the application with tests, you can start refactoring the classes and start introducing additional unit tests. The tests will help you to discover bugs and side effects quickly, without having to click through the application repeatedly.
Introducing a code style such as PSR-12 is, as you know by now, as easy as just running a tool such as PHP-CS-Fixer over the entire code base at once. The resulting commit will, of course, be huge, so you want to agree upon a code freeze with any fellow developers before you do it. A code freeze means that everybody commits their changes into the repository so that your refactoring does not cause huge merge conflicts when they check out the changes afterward.
To decide which code to refactor, we intend to use one or more of the many code quality tools you know by now. Going with PHPStan on level 0 is a good choice. You might also want to consider Psalm, as it can also resolve some issues automatically. Depending on the size of the project, the list of errors can be dauntingly long. Making use of the baseline feature, as described in Chapter 7, Code Quality Tools, can be a cosmetic help here, but it will only hide and not solve the code issues.
You do not need to rush. If you configure your CI/CD pipeline to only check modified files, you can start improving the code over time, piece by piece. It does leave you with the problem that once you have touched a file, you must refactor it to meet the rules. Especially for old but huge classes, this can be problematic. In Chapter 7, Code Quality Tools, however, we explained how you can exclude files or parts of the code from the performed checks. You can even set up a pipeline that allows you to skip the checks upon a certain keyword (for example, skip ci) in the commit message. This approach, however, should only be the last resort—otherwise, you will never start refactoring old code. It takes some self-restraint from the developers not to misuse this feature, too.
Over time, the team working on the project will gather new confidence, and with growing test coverage, they will start refactoring more and more code. Make sure to install a local pipeline as well, to keep the waiting times short.
An outlook on CD
Eventually, your CI pipeline will work so well that you can fully trust it. It will prevent shipping broken code into production reliably, and at some point, you find yourself doing fewer and less-manual checks if the deployment went well. At that point, you could think about using CD: this describes the combination of tools and processes to deploy code to any environment automatically.
A usual workflow is that whenever changes get merged into a certain branch (for example, main for the production environment), the CI/CD pipeline will be triggered automatically. If the changes pass all checks and tests, the process is trusted so much that the code gets deployed into the desired destination without testing the build result manually anymore.
If you ever had the opportunity to work in such an environment, you surely do not want to miss it. Besides a great CI/CD pipeline and 99% trust in it, it requires some more processes in place to quickly react if a deployment has problems. Even the best tools cannot prevent logical errors or infrastructural issues that will only appear under a greater load.
Whenever there is a problem after deployment, your team should be the first ones to notice! You not only need to fully trust the pipeline but the monitoring and logging setup as well. There are many concepts and tools out there, and we are finally leaving the topic of code quality here, entering the realms of development-operations (DevOps) and system administration. Nevertheless, we want to give you some short guidance on a few key concepts you might want to delve into, as follows:
- Monitoring gathers information about the status of a system. In our context, this is usually information such as central processing unit (CPU) load, random-access memory (RAM) usage, or database traffic of all servers or instances. For example, if the CPU load suddenly increases massively, this is an excellent indicator that there is trouble ahead.
- Logging helps you organize all log messages your application produces in a single, easily accessible place. It is not helpful if you need to search for any log files on different servers first when the system is in trouble and all alerts are ringing.
- There are multiple deployment methods available. Especially when your setup has grown and consists of multiple servers or cloud instances, you can roll out the new code just on a few instances or even a separate deploy environment and monitor the behavior there. If all goes well, you can continue the deploy to the remaining instances. These methods are called canary, rolling, and blue/green deployments. You will find a link with more information on them at the end of this chapter.
- Regardless of how well you monitor your software, if things go wrong (and they will), you need to go back to a previous version of your application. This is called a rollback. You should always be prepared to go back to the previous version as fast and easy as possible. This requires you to have the deliverables of several previous versions available. It is a good idea to keep at least 5 or 10 versions because sometimes, it is not clear which version exactly caused the problem.
Surely, CD is beyond the scope of writing clean PHP code. However, we think it is a goal worth aiming for, as it will speed up your development a lot, and introduces you to a variety of fascinating tools and concepts.
Summary
We hope that, after reading this chapter, you are as convinced as we are that CI is extremely helpful and thus a must-have tool in your toolbox. We explained the necessary terms around this topic as well as the different stages of a pipeline, not only in theory but also in practice, by building a simple but working pipeline using GitHub Actions. Finally, we gave you an outlook on CD.
You now have a great foundation of knowledge and tools to write great PHP code. Of course, learning never stops, and there is so much more knowledge out there for you to discover that we could not fit into this book.
If you made developing PHP software your profession, then you usually work in teams of developers. And even if you are maintaining your own open source project, you will interact with others—for example, when they submit changes to your code. CI is an important building block, but not the only thing you need to consider for a successful team setup.
For us, this topic is so important that we dedicated the next two chapters to introducing modern collaboration techniques that will help you to write great PHP code when working in teams. We hope to see you in the next chapter!
Further reading
If you wish to know more, have a look at the following resources:
- Additional information about GitHub Actions:
- The official GitHub Actions documentation with lots of examples: https://docs.github.com/en/actions
- setup-php is not only very useful for PHP developers, but also offers a lot of useful information—for example, about the matrix setup (how to test code against several PHP versions) or caching Composer dependencies to speed up the build: https://github.com/marketplace/actions/setup-php-action
- More information about CD and related topics can be found here:
- A good overview of CD: https://www.atlassian.com/continuous-delivery
- Logging and monitoring explained: https://www.vaadata.com/blog/logging-monitoring-definitions-and-best-practices/
- A great introduction to advanced deployment methods: https://www.techtarget.com/searchitoperations/answer/When-to-use-canary-vs-blue-green-vs-rolling-deployment
- Tools and links regarding your local pipeline:
- More insights on Git hooks: https://git-scm.com/book/en/v2/Customizing-Git-Git-Hooks
- GrumPHP is a local CI pipeline “out of the box”: https://github.com/phpro/grumphp