Chapter 9
Designing Your Portfolio
Where should I invest my money?
Put it in booze. Where else can you get a guaranteed 40 percent?
– Anonymous
I have spent most of my money on women and beer. The rest I just wasted
– Steve Forde
If we really did profit from our mistakes, I'd be extremely rich by now.
– Anonymous
We've covered a lot of information to help you narrow down investment ideas, but now we are going to get personal. We've walked you all though how to read the economy like a pro, and the difference between the economy and the stock market; they often don't move together. We've walked you through how politics and regulations can have a big impact on industries, which can affect your investment choices. We've shown you how to notice those disruptive technologies that can create major investment opportunities along with the pain points and psychographic changes that can serve as catalysts, headwinds, or tailwinds. Finally, we just showed you how we go about putting all that together to identify investable Cocktail Thematics.
Now we are going show how you can go about designing a portfolio that suits your unique needs while using the Cocktail Thematics you've identified. Designing a portfolio can be thought of as similar to designing and building your dream home. First, you would learn about all the latest Cocktail Thematics and developments to give your fantasy home the latest technologies and design techniques that you like. You'd likely be flipping through and collecting ideas and images from publications like Architectural Digest, and Dwell. At the end of this process you would have a list of the Cocktail Thematics that most appeal to you to bring to an architect that might look something like this:
- Open space design
- Use of natural and renewable materials
- Multifunctional kitchen space
- Use of the latest “smart/connected home” technologies
- Tankless water heaters and highly energy-efficient furnaces and sensors that save on space and help with your monthly bills
- Built-ins to increase space utilization
This is akin to the Cocktail Thematics like the ones discussed in the prior chapters that you have selected to focus on in order to identify investments for your portfolio. For your dream home, an architect would ask you more detailed questions so that he or she can create a blueprint that combines the things you like and prefer with your specific wants and needs for the home:
- How many bedrooms do you want?
- What is your target square footage, and is this one, two, or three stories?
- Do you want the bedrooms to have en suite bathrooms?
- Do you want an island in your kitchen?
Back in Chapter 2, when we discussed “Investing Guidelines,” we introduced you to the idea of your investing personality. At the website for this book, CocktailInvesting.com, you can find a checklist to make sure you know exactly what you need from your portfolio. The next step is to combine your “specs” with the list of Cocktail Thematics you've identified to create a portfolio blueprint. For your dream home, you would take the architect's blueprint and give it to a builder, who would ask you to get even more specific, selecting the exact flooring material, paint colors, and cabinetry for the home. For your portfolio, you will use your portfolio blueprint to help you identify specific securities in which you will invest.
By the end of this chapter, you will have a portfolio blueprint, meaning you will have combined the Cocktail Thematics with your specific wants and needs for your portfolio. You will be able to generate a list of 50 to 60 securities that interest you, which will then, in Chapter 10, narrow down to 10 to 25 in which you will invest. Finally, in Chapter 11, you will learn how to monitor your portfolio and when to sell.
There are four main areas you need to consider in order to understand what kind of portfolio best suits you:
- Number of securities
- Risk tolerance
- Income today versus long-term growth
- Tax considerations
Number of Securities
The first question is, “Just how many and what type of securities will you be able to manage successfully?” This is all about the amount of time you are willing and able to devote to your portfolio. While we are doing everything possible to help you be efficient, there are no shortcuts for doing the necessary homework. You need to spend time making sure you fully understand exactly what you are investing in and then monitor the investments within your portfolio. The good news is the more you do this, the easier and more natural it will become. Think of it like building your investing muscle—while it may be difficult at first, before too long your ability to not only digest data but distinguish usable information (signals) from noise will become stronger and stronger.
In the introduction to this book we mentioned that you should never have more than 3 to 5 percent of your portfolio invested in any one company, and no more than 8 to 10 percent in an exchange-traded fund or mutual fund. The less time you have to devote to your portfolio, the more you should rely on well-diversified and potentially actively managed funds. With this in mind, if you have very little time, you should focus on selecting 10 or more funds for your portfolio. On the other end of the spectrum, most people who don't work on their portfolios fulltime should have no more than 20 to 25 individual securities (meaning stocks, bonds, mutual funds, exchange-traded funds, etc.) so as to be able to adequately monitor their holdings. Depending on the amount of time and your desire to put in the time and effort, you can be anywhere between these two extremes.
Assume that each stock will take about 20 hours over several weeks to research fully before investing and will average around 10 minutes a week to monitor. Some weeks it will take less than a minute for a particular stock; another week it might take over an hour. Consider these numbers as you decide if you prefer all funds, all stocks, or some combination of the two. While the hours to get going probably sound a little daunting, as you'll learn in Chapter 11, you shouldn't buy all of the securities in your portfolio at one time and rarely do you buy 100 percent of all the shares of a company all at once. In other words, you can breathe a sigh of relief because all that time tends to be spread out over several months.
Risk Tolerance
You'll often hear investment-types talk about portfolio volatility and/or risk tolerance. This really just boils down to how much money you can stand to lose, both financially and emotionally, within a given period of time, because, frankly, how many people would get stressed out about having their investments gain a lot more than they expected? No one cares about volatility on the upside! The concern is, how would you react if a stock you owned dropped 10-15 percent? Would you feel a panicky need to immediately sell it, or would you happily purchase more, confident that your thesis for the stock will pan out?
In general, companies that are smaller, faster growing, in emerging industries, and don't pay out dividends have more volatile stock prices than large companies that have a consistent track record of delivering stable results. Those companies that have consistently paid out dividends, generally speaking, tend to have more stable stock prices. Keep in mind, however, that during times of extreme market stress, everything can get hit hard. We saw this at the end of 2000 into 2002, again in 2008 into early 2009, shown in Figure 9.1, and again in January 2016. The silver lining in those cases, however, was what came after that extreme market stress, particularly for those investors who had the risk tolerance and available cash on hand to buy those investments on their shopping lists at discounted prices.

Figure 9.1 S&P 500 Index, January 1, 1995, to October 30, 2015
Source: YCharts
Your time horizon also affects what types of risks you can take. The longer your time horizon, meaning the more time you have before you will need to start taking money out of your portfolio—for a down payment on a home, a dream vacation, a new car, or retirement—the more risk you can afford to take, still limited of course by what you can stomach, as there is no point in having a portfolio that gives you insomnia, an ulcer, or both!
You also need to consider what you are looking for from your portfolio with respect to the kind of long-term returns versus income generation. Generally speaking, the younger you are, the more growth you want versus investments that give you income (keep in mind that income from investments is taxed at a higher rate than long-term gains). Those who will depend on their portfolios to generate sufficient income to cover part or all of their living expenses need to have portfolios in which prices fluctuate less and that produce more reliable, consistent income streams.
This is a list of the most widely used types of securities:
- Stocks
- Bonds
- Real estate investment trusts (REIT)
- Master limited partnerships (MLP)
- Mutual funds
- Exchange-traded funds (ETF)
- Exchange-traded notes (ETN)
- Closed-end funds (CEF)
We are going to focus on stocks and on funds comprised of stocks, as those are the primary ways to express the Cocktail Thematics you've read about in Chapter 8 and have subsequently identified for yourself. Although REITs and MLPs are also useful investment vehicles, as you'll see later in this chapter, their structure, dividend policy, and tax implications are somewhat different from typical publicly traded companies or stock funds. Everything we teach you here applies to them as well, but they do have a few unique traits that we'll cover at a high level. If you are interested in investing in them, you'll find references and more information in the Appendix.
Stocks
Countless books have been written about stocks and there is a bounty of information on them on the Internet and you'll find a few of our favorite tomes on CocktailInvesting.com. In the interest of preserving everyone's sanity, we aren't going to repeat the basics of stocks here, things like the difference between common and preferred shares. Those of you who aren't familiar with stocks should review the references we cite in the Appendix. When it comes to just the basics, we can't add much value; instead, we focus here on where we can add value.
First off, we suggest that any stock you consider has a daily average minimum trading volume of 100,000 shares per day, but we prefer higher. Keep in mind that for every transaction, there are buyers and sellers, which means the actual number of shares traded is really half the reported amount. We also avoid stocks priced $10 or below. We avoid stocks with low trading volumes or that trade at low prices out of concern for getting into a position that we cannot quickly and easily exit—what we refer to as avoiding a roach-motel situation.
Most importantly, for any stock you absolutely must read the company's filings with the Securities and Exchange Commission (SEC). The documents can be found at www.sec.gov/edgar or most investing services such as Schwab and Fidelity. Research sites like Morningstar.com or YCharts have links to the documents as well. Of particular importance are the company's annual report (10-K), the quarterly reports (10-Q), and statements of changes in beneficial ownership (4), which tell you if the insiders are buying or selling.
For companies that only recently went public, we'd recommend reading the S-1 filing that breaks down the company's industry, business, products, potential risks, and historical financial performance. One other filing to be familiar with is a company's proxy statement (Def 14A) that can contain additional insight from the company's management team, as well as items to be voted on at the annual shareholder meeting. (If you've never attended one of those meetings, we highly recommend it. You'll come away with a better understanding of the company as well as its business.)
Price is the most important aspect of any investment decision. For almost everything you consider investing in, there is some price at which there is very little risk and a lot of potential upside and some price at which there is so little potential upside that it just isn't worth buying. There is no investment that is a good idea at any price. When we think of price, we often remember one of Warren Buffett's more well-known sayings, “Price is what you pay. Value is what you get.” Which to us means getting the price right (or as right as possible) is crucial.
So how do you know if something is priced well to buy or to sell? Here come the metrics!
P/E Ratios
When you hear someone say Apple is trading at $130 or Exxon trading under $85, what does that mean?
Apple is trading at a higher price than Exxon, but we don't actually know from that if one is a better price than the other. The reality is that knowing that Apple trades at $130 doesn't tell you a darn thing!
It's important to get a second piece of data, the company's earnings per share (EPS), to have any sense of how to compare the price of Apple (AAPL) shares to Exxon (XOM) shares. Taking the price divided by earnings per share gives you the company's P/E (price-to-earnings) ratio.
There are many flavors of P/E ratios for a given company, so you always want to make sure you are clear on just which one people are talking about. Unfortunately, you'll often hear people on the major financial television shows talking about P/E ratios without specifying to which they are referring, which annoys us to no end.
The numerator is always the current market price, but the denominator can vary widely, from being the last four quarters of earnings-per-share (trailing P/E ratio, which is typically annotated as TTM), the expected earnings per share for the next four quarters (forward P/E ratio), and even the past two quarters combined with expectations for the next two quarters (blended P/E ratio).
Say that Apple's trailing 12-month earnings per share (EPS TTM) was $7.40 while Exxon's was $7.60. Now we can calculate the price-to-earnings ratio (P/E) (trailing 12 months) for these two stocks:
PE ratio (TTM), which is the price-to-earnings ratio, trailing 12 months:

What this tells us is that investors are willing to pay $17.16 for every $1 of Apple's earnings versus $11.18 for every $1 of Exxon's earnings. Now we have a way to better compare Apple's share price to Exxon's. From this, we can see that Apple is trading at a more expensive multiple than Exxon. Two other ways to say this are as follows: Apple shares are trading at a premium to Exxon shares or Exxon shares are trading at a discount to Apple shares. Generally, a higher P/E ratio means that investors are anticipating higher future growth. P/E ratios tend to be more consistent within an industry so we are not surprised to see a wide discrepancy between Apple and Exxon here. In Chapter 10, we'll show you how to use this metric to compare companies within the same industry or peer group.
We should also mention that the P/E ratio can be used for more than just an individual stock. It can be used for a fund or an index, which is simply the weighted average of the P/E ratios for all the companies in the fund or index. For example, the Shiller P/E ratio (named after economist Robert Shiller) is based on the average inflation-adjusted earnings from the previous 10 years for the S&P 500 index.
In November 2015, the Shiller P/E ratio had long-term average of around 16.6 with a peak of 44.19 in December 1999.1 Let's assume that today the current Shiller P/E ratio is 27 and the S&P 500 trailing 12-month P/E ratio (current stock price divided by the training earnings per share for the past 12 months) is 20 versus 18 a year ago and its forward P/E (current stock price divided by the expected earnings per share over the coming year, which you can find from FactSet and other services) is 17. So:

What does this mean? Stocks are more expensive today than a year ago.
Investors are paying more today for each dollar of earnings from the S&P 500 than they did a year ago and also more than the historical average, since the trailing 12-month P/E ratio rose from 18 to 20.
Earnings for the S&P 500 are expected to grow over the coming year, which is why the forward P/E ratio is lower than the trailing P/E ratio. Here's the math:

Most investing services provide P/E ratios for individual companies, funds, and indexes, often giving both the trailing and the forward, as P/E ratios are pretty much the standard for assessing where a stock is overpriced, underpriced, or fairly priced. However, there are some things you need to take into account when using the P/E ratio.
First of all, a company's net income (earnings per share equals a company's net income divided by its outstanding shares) can be manipulated in a variety of ways. For example, a company may take a one-time restructuring charge, which it could use as an excuse for having weak earnings, and will prefer to talk about pre-one-time-charge net income instead of the actual earnings. This could be legitimate if the one-time charge is truly a unique event and does not reflect typical operating expenses, but we've seen more than a few occasions where companies have reported these “one-time restructuring charges” every few years. This looks to us like a great way to play with accounting in order to make typical operating expenses look less than they really are. There are so many accounting games that companies play in order to paint the best picture possible of their net income that countless books have been written on the topic of managing a company's bottom line. So investors…beware!
Share Repurchases
Companies can reward shareholders in a number of ways, including through stock price appreciation and dividends. One way that has become increasingly popular is share repurchases (also called stock buybacks). This refers to when a company buys back their own shares. Generally, when companies buy back their own stock it is beneficial to shareholders, because with fewer shares outstanding, those shares that are in the public's hands are worth more.
However, with the exceptionally low interest rates after the financial crisis, we have been seeing a significant increase in the number of companies buying back their own shares, with a growing percentage of them issuing debt to do this, thanks in no small part to the various quantitative easing programs that have kept interest rates at exceptionally low levels. Figure 9.2 shows the increase in share repurchases in recent years.

Figure 9.2 Quarterly share repurchases and buyback yield, 1Q 2005–3Q 2015
Source: FactSet Fundamentals
For companies that issue debt (bonds) to fund share buybacks, the benefit to shareholders is more complicated than when the buybacks are funded through normal business profits. When the interest rate paid on the bonds is lower than the dividend yield on the shares being repurchased, this is a cash-flow-positive strategy. Here's the math, using small numbers to keep it simple.
A company's stock is trading at $100. The current stock dividend is 4 percent on an annual basis, which means it is paying $4.00 in dividends on every share per year.
The company issues $1,000 worth of bonds, yielding 2.5 percent. This means that if you bought $100 of this bond, you would receive $2.50 a year in interest payments. The company uses the proceeds of the bond issuance (the $1,000) to repurchase 10 shares of its own stock (![]() ). Now the company is paying only $25 a year in interest versus the $40 it was paying previously in dividends on those shares, saving $15 a year.
). Now the company is paying only $25 a year in interest versus the $40 it was paying previously in dividends on those shares, saving $15 a year.
Looking at those equations one can see how low interest rates (a la Federal Reserve quantitative easing) could make it more attractive for companies to buy back their shares and would put downward pressure on dividend yields. Let's look at the top 10 companies by dollar-value and their share returns in late 2015 as shown in Figure 9.3.
| TTM | % Change | 1 Year | |||
| Buybacks | in Shares | Dividend | Total | ||
| Company | Sector | ($M) | (TTM) | Outflows | Return |
| Apple Inc. | Information Technology | $41,588 | (4.7%) | $11,426 | 13.4% |
| Microsoft Corporation | Information Technology | $13,209 | (2.6%) | $9,882 | (4.4%) |
| Wells Fargo & Company | Financials | $10,271 | (2.0%) | $8,572 | (1.6%) |
| Intel Corporation | Information Technology | $9,996 | (3.9%) | $4,447 | (15.0%) |
| QUALCOMM Inc. | Information Technology | $9,210 | (6.0%) | $2,844 | (26.8%) |
| Exxon Mobil Corporation | Energy | $9,105 | (2.2%) | $11,846 | (22.3%) |
| Johnson & Johnson | Health Care | $8,301 | (1.9%) | $7,948 | (10.5%) |
| Pfizer Inc. | Health Care | $8,258 | (3.3%) | $6,772 | 11.1% |
| Oracle Corporation | Information Technology | $8,091 | (2.7%) | $2,255 | (11.3%) |
| Gilead Sciences, Inc. | Health Care | $7,919 | (3.5%) | $633 | 3.1% |
Figure 9.3 Top 10 companies by dollar-value buybacks—trailing 12 months, September 2015
Source: FactSet Fundamentals
How could these share buybacks affect share prices and not just reduce the amount of money companies pay out in dividends?
The price of a stock on any given day is just a function of supply and demand. The greater the demand (buyers) the more the stock price is pushed up until no more buyers are interested at the higher price. The converse is also true; the more that want to sell, the lower the price will go until no more sellers are interested in selling. (Real-world example—when home prices are high, lots of people consider selling their homes, but when home prices fall, more people are happy to stay just where they are.)
So how big of an impact do these share buybacks have on demand? We can answer this by looking at fund flows, meaning money going into and coming out of the markets, shown in Figure 9.4.

Figure 9.4 U.S. Net equity inflows, 2012–2015E
Source: Federal Reserve Board and Goldman Sachs.
The chart on net equity inflows shows that the single largest source of funds going into the equity markets came from corporations. Households on the other hand were net sellers, as were pension funds, meaning that on a dollar basis, more households and pension funds were selling than buying stocks. Further, it shows that in 2014, households took $183 billion out of the stock market while corporations put $415 into the equities market. Doing some simple math we find that if no corporations had purchased equities, there would have been a net outflow of $237 billion! Talk about a reduction in overall demand. What this tells us is had it not been for companies buying back their own shares, stock prices in 2014 would have likely declined as there were overall more sellers than buyers.
Now let's go back to the company making the decision to issue bonds (borrow money) and use the proceeds to buy back shares of their own stock. There are a few things to keep in mind: This is not a sustainable process. Companies cannot endlessly issue debt and then use the proceeds to buy back shares—rather intuitive, but something to keep in mind, as it is not a long-term way for a company to generate returns for shareholders. As debt levels climb at a company, shareholders may become increasingly worried that the company will not be able to service its debt (meaning being able to make the required payments). This is akin to a homeowner repeatedly refinancing their home, with each successive mortgage borrowing even more than the one before. In a contracting economy or in a recession this problem can become even more worrisome.
If stock prices fall, then the entire equation we did above falls apart. How's that? Well, we left out the impact of share price and the company's balance sheet in that analysis. Tricky, aren't we? So let's revisit that equation taking share price into account.
The company issues $1,000 worth of bonds and immediately buys $1,000 worth of stock, or 10 shares since the stock was trading at $100/share. So on the company's balance sheet there is now a liability worth $1,000, but an asset, most likely cash, that is worth $1,000 counters it.
If the company's stock were to decline by, say, 15 percent, then those shares would be worth $850. The company now has a liability worth $1,000 that is countered by an asset worth only $850. This negative change in the company's net worth makes it less attractive than before the share price decline, so now it has a double hit. Its shares have been falling and now its balance sheet looks less attractive. That can put further downward pressure on the company's share price, which results in an even less attractive balance sheet, and so on. This is another example of how debt can exacerbate problems when asset prices fall.
One of the reasons that companies do this is the difference in tax treatments between debt and equity. Remember how we discussed earlier in this book the way fiscal policies (a.k.a. tax and spend) can affect investing? Companies are able to use the payments they make on loans to reduce their taxable income. Dividends paid to shareholders are completely different. Companies first have to pay taxes on their net income; then they can distribute what remains to shareholders. Shareholders then must pay taxes on the dividends they receive. This is referred to as double-taxation. The same income is taxed once at the company level, then again when received by shareholders. Companies may choose to use some level of debt to help reduce the amount of taxes they pay, leaving more money to give to shareholders.
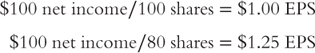
Most importantly, these share buybacks affect earnings per share (EPS) as the fewer shares outstanding, the higher the earnings per share for the same net income. For example, if a company has 100 shares outstanding and buys back 20 shares, its earnings per share will look greatly improved, even though the company's actual performance is the same!
This makes comparing performance over time using P/E ratios rather convoluted as the P/E ratio is based on price and EPS.
As you can see, there are no quick answers when assessing the value of a company's stock. There are many things a company can do to manipulate its numbers, so you need to look at more than just one or two metrics to understand performance over time. In the next chapter, we will give you a checklist to help you get an understanding of the key data points as efficiently as possible.
Now that you better understand some of the ways that a company's earnings-per-share can be manipulated and how to calculate various price-to-earnings ratios, we'll walk you through a few other types of securities that you might be interested in using to execute on the investment Cocktail Thematics you have identified.
Real Estate Investment Trusts
A favorite for generating income, real estate investment trusts (REITs) invest in real estate either directly, by purchasing the actual property, or through mortgages. REITs allow the typical investor to invest in diversified real estate in a cost-effective manner that would otherwise be impossible for most.
An equity REIT buys, develops, manages, and sells real estate. Equity REITs can invest in various types of real estate such as corporate office buildings, medical facilities, shopping malls, apartments, warehouses, hotels, and senior care facilities or in particular regions such as a state or country. Shareholders of equity REITs are buying portions of a managed pool of real estate.
A mortgage REIT invests in property through mortgages by loaning money to the owners of real estate or by purchasing existing mortgages or mortgage-backed securities. For a mortgage REIT, income is generated from the interest earned on the mortgages rather than from operating the physical properties.
A REIT is just like a publicly traded company in that you want to read the annual report (10-K) and quarterly reports (10-Q), but unlike a company, in which you are buying the right to participate in the profits of the company, in a REIT you are buying not only a share of the profits but a portion of the real estate generating those profits as well.
The most important aspect of a REIT is its requirement to distribute nearly 90 percent of its yearly taxable income to shareholders. This amount is deductible to the company, unlike dividends, so there is only one level of taxation for the funds distributed to investors. Remember our earlier discussion of double-taxation for corporations. For common stockholders, the corporation's executive team and the board decide what, if any, of the cash generated by the business is distributed to the shareholders. Regardless of how much, if any, of the profits of a corporation are distributed to shareholders, a corporation pays corporate income tax on its entire net income.
If you want to know more about REITs, please see our recommended reading list in the Appendix. This isn't the only type of security that is focused primarily on generating cash for its investors. There is another type we want to discuss that typically invests in natural resources.
Master Limited Partnership (MLP)
A master limited partnership (MLP) is a type of limited partnership that is publicly traded. The limited partners (you, the investor) are those that provide the capital to the MLP, and the general partner is the party that runs the business and is compensated based on performance.
In order to qualify to be an MLP, the partnership must generate a minimum of around 90 percent of its income from real estate, natural resources, or commodities. Much like REITs, one of the main reasons MLPs are attractive is because of their tax treatment. Where REITs are able to reduce their taxable income by the amount that is given to shareholders, MLPs do not pay taxes on their income at all (as opposed to a corporation, which is subject to double taxation). The money is only taxed when distributed to unit holders of the partnership.
The downside of MLPs is that once a year, unit holders receive a K-1 statement detailing their share of the partnership's net income, which needs to be filed with the investor's taxes. However, typically investors pay taxes on less than the amount of cash they received from the MLP because unit holders are taxed on the partnerships income, not on its distributable cash flow that benefits from MLPs typically having rather high depreciation expenses. Eventually, an investor will pay taxes on everything received, but portions are deferred until the entire investment is sold.
This unique tax treatment makes MLPs potentially problematic in tax-exempt accounts such as an IRA, because the cash distributions are considered unrelated business taxable income (UBTI) and could create a tax liability for the investor. Therefore, typically it is better to hold an MLP in a regular, taxable brokerage account.
If you want to know more about MLPs, please see our recommended reading list in the Appendix.
Funds
We mentioned earlier that a lot has been written about stocks and bonds. That goes double for commentary on funds—and no wonder, given their proliferation. At the end of 2014, $33.4 trillion was invested in mutual funds and exchange-traded funds worldwide.2 The United States represents the largest portion at $18.2 trillion, coming primarily from the more than 90 million U.S. retail investors, meaning individuals like all of us. Investors have increasingly relied on funds over the past few decades, with 24 percent of household financial assets held in investment companies at the end of 2014 versus just 2 percent in 1980.3 Part of this increasing allocation has been due to the growth of individual retirement accounts (IRAs) and defined contribution plans such as 401(k) plans, as well as greater usage by financial advisors, as seen in Figure 9.5. One of the best places to get information on either mutual funds or ETFs is Morningstar, but we caution against blindly following its ratings as those tend to be based primarily on past performance. Always remember that things change and the past may not be indicative of the future, and frankly, last year's top performers are rarely this year's stars.

Figure 9.5 Use of products by financial advisors
Source: WealthManagement.com 2015 Investment Trend Monitor Report: Advisor Use of Financial Products
As funds have become increasingly popular, the range of offerings has also grown considerably. We'll walk you through the different types and discuss why you may want to consider them for your own portfolio. As with the earlier types of securities we've discussed, we aren't going to replicate the great work that is available out there on funds, but will instead give you our take on them. In the Appendix you will find suggestions for further readings about funds, which we highly recommend if you decide to include funds in your portfolio.
First off, keep in mind that in some industries, particularly new and emerging ones, it may not be feasible for you to pick a specific company; thus, a fund that focuses on your area of interest may be a better choice, regardless of how much time you are willing to spend.
Given the number of cyberattacks launched on companies like Target and Sony and even the federal government, the need for security is a pretty obvious pain point. But unless you have very specific knowledge in this part of technology, it is incredibly difficult to identify which cybersecurity suppliers will end up winning. This type of situation is one where you might want to consider a fund. In this case, you could use the ETF PureFunds ISE Cyber Security™ (HACK). Some industries tend to be extremely volatile as well. Thus, even if you were willing and able to spend the time to select specific stocks, say in biotechnology, if you think the way stock prices in that sector tend to move around rather wildly is going to give you some sleepless nights, you may be better off using a fund rather than taking on the risks and volatility inherent with an individual company. In this case, you might want to consider a fund like the ETF iShares Nasdaq Biotechnology (IBB).
Funds mostly fall into one of two main categories: mutual funds or exchange-traded funds (ETFs). Right off the bat, the biggest difference you'll notice between the two as an investor is that an ETF is priced throughout the day and you are able to buy or sell any time during normal market hours just like you would a stock. In contrast, mutual funds are priced just once a day, after the market closes. If you want to buy or sell a mutual fund today, you will have to put your order in during the day before you know the actual price for shares of the fund for that day. This can make things a bit complicated if you would like to set it up to automatically buy or sell shares at a specific price, for example.
This can make it more challenging to stick to your guns with a planned buy or sell. It can become difficult to objectively “pull the trigger,” so to speak, when you don't actually know if the price is going to hit your target when the transaction gets executed that afternoon. It can also be tempting to try and game it, for example, thinking, “Oh, the price is falling/rising…I'll just wait a bit longer…maybe a bit past my target for an even better entry/exit point.” And then—you've missed your opportunity.
Exchange-Traded Funds versus Mutual Funds
The various structures of ETFs vary by country, but the fund itself is divided into shares, which are held by shareholders who then indirectly own the assets of the fund and are thus entitled to the profits, dividends, and interest generated by the assets of that fund.
ETFs differ from mutual funds in that investors do not buy or sell their share at the net asset value (NAV), which means essentially the value of the underlying assets.
For example, to calculate the NAV for shares representing one-tenth of a fund that owns 20 shares priced at $5.00 and 10 shares priced at $20 would be ![]() . This is basically how the NAV for a mutual fund is calculated every day after the markets close, except it's done for every security the mutual fund owns.
. This is basically how the NAV for a mutual fund is calculated every day after the markets close, except it's done for every security the mutual fund owns.
Since an ETF is constantly traded throughout the day at the same time as its underlying assets, the price of shares of the ETF is determined the same way as prices for stocks, by the matching of buyers and sellers, which means that at any point in time, the ETF can be trading at a premium (priced above) or a discount (priced below) to its NAV. Using the previous example, this means the shares could be trading at, say, $31 (a premium) or $29 (a discount), even though the underlying assets are worth $30.
The difference between the fund's underlying NAV and the current share price is kept in check by the process by which the financial institutions (such as JP Morgan, Morgan Stanley, or Citibank, with whom you directly buy and sell ETF shares) purchase and sell the ETF shares directly from the ETF provider. This is done in large blocks of usually around 50,000 or so shares, which are called creation units. The ability to purchase or redeem creation units for an ETF gives these institutions arbitrage opportunities when the NAV of the bundle of securities is more or less than the market price of ETF, which in turn serves to minimize the potential difference between the two. They can make money taking advantage of the difference and, as they do, the difference shrinks.
ETFs can be bought only through a brokerage account, just like buying a stock. In contrast, investors can usually buy or sell mutual funds directly through the fund provider, such as Fidelity, Vanguard, PIMCO, and so on. Mutual funds also typically have a minimum investment, such as $1,000, whereas you can purchase just one share of an ETF, which is typically far less than $1,000.
Since ETFs trade on the market like stocks, investors can engage in many of the same types of trades that they can with a stock, such as selling short, buying on margin, and often times options in the form of calls and/or puts can be written against them. ETFs generally have lower costs than mutual funds for a variety of reasons and are more tax efficient for investors:
- ETFs that track an index have lower management fees because they are not actively managed.
- ETFs are insulated from the costs of having to buy and sell securities when shareholders purchase or redeem shares, which reduces costs and reduces potential tax liabilities for investors.
- ETFs usually have lower marketing, distribution, and accounting expenses than mutual funds.
- Most ETFs are not subject to 12b-1 fees, which are annual marketing or distribution fees associated with mutual funds.
- Index-style ETFs generate relatively low capital gains because they have low turnover of their portfolio securities.
In 2002, ETFs had a mere $100 billion under management. By 2006, that total had gone to $400 billion. By 2009, it was $800 billion, and by the end 2014, it had mushroomed to $2 trillion. To put that into perspective, $2 trillion equates to each of the estimated 322 million U.S. citizens holding more than $6,200.
That's impressive, but by the end of May 2015 the global exchange-traded products industry reached US$3 trillion in combined assets under management. At the time, Goldman Sachs saw that figure doubling by 2020 due to rapid adoption of ETFs and similar products by “registered investment advisors (RIAs), the roll-over of 401(k) into IRAs, increasing use of auto-allocation products, regulatory push into lower-cost products, geographic expansion, and innovation.” As you'll read in the next section, not all ETFs are the same.
There is one other key difference between mutual funds and ETFs. Mutual funds typically only disclose their holdings on a quarterly basis, which means the fund manager can execute a strategy without the world seeing what he or she is doing and trying to take advantage of that information. Exchange-traded funds, in contrast, are required to disclose their holdings on a daily basis, which makes it more difficult to execute an active investment strategy as the world can watch the fund manager's every move.
Types of ETFs
Most ETFs are index funds that seek to replicate the performance of a particular index such as the S&P 500 or even a particular set of bond maturities like Treasury bonds with a maturity of 20 years or later with the iShares Barclays 20+ Year Treasury Bond ETF (TLT). These ETFs can either replicate the index by investing 100 percent of their assets proportionally in the securities underlying the index or engage in representative sampling where as little as 80 percent of their assets are invested in the securities and the rest is in options or futures or other securities not in the underlying index with the intent of helping the fund meet its investment objectives.
Stock index ETFs can be focused on a particular type of company, such as companies with large market capitalization such as Apple, or growth companies or high-dividend-paying companies. They can also focus on particular sectors such as biotechnology, banking, or even airlines.
Bond ETFs can be focused on particular types of bonds, such as U.S. government Treasury bonds, municipal bonds, corporate bonds, or international bonds with varying maturities.
There are also ETFs that track everything from the price of gold (such as ticker GLD) and silver (such as ticker SLV) to companies in the agricultural industry (such as ticker MOO) to even wind energy (such as ticker FAN). There are even ETFs that track relative values of currencies or baskets of currencies, and even volatility. ETFs also allow investors to take advantage of leveraged or inverse investment strategies, such as an ETF that seeks to generate two or three times the underlying index or to move opposite the index. Investors need to be aware that these funds can have considerable tracking error. Tracking error refers to just how far off a fund is relative to its underlying index. For example, a fund that seeks to generate two times its underlying index will likely diverge significantly because most all leveraged funds compound daily. If the index reverses direction, meaning up one day and down the next, the fund will be well off its underlying index. Here's the math:
| Day 1: | Index up 2% | $100 × 1.02 = $102 |
| Fund up 4% | $100 × 1.04 = $104 | |
| Day 2: | Index down 3% | $102 × 0.97 = $98.94 |
| Fund down 6% | $104 × 0.94 = $97.76 | |
| Day 3: | Index up 2% | $98.94 × 1.02 = $100.92 |
| Fund up 4% | $97.76 × 1.04 = $101.67 | |
| Over three-day period | Index up 0.92% | |
| Fund up .67% = 1.8x index |
As you can imagine, over time the difference between the two can grow, particularly if there are a lot of reversals of direction. So why does this “tracking” error occur? Because the fund rebalances its assets every day so that it can generate double the index's returns for that day. As long as the index moves in one direction, the fund will be able to track accurately, but once it changes direction, it starts to be off. If you want to leverage an investment over a longer period of time, a margin account, which allows you to purchase, say, $100 worth of shares for only $50, may be a better way to go, but of course you are risking more, too, so this is something to be considered carefully. We'll discuss this in later chapters. There are some funds that seek to compound on a monthly basis, but they will still have the same challenges over longer periods of time.
An inverse or “short” ETF seeks to give investors returns that are the opposite of the index's. For example, an inverse S&P 500 index would give you a positive 2 percent return on a day when the index itself fell 2 percent. However, these funds have a similar compounding problem. Both inverse and leveraged funds will perform as expected as long as the underlying index continues to move in the same direction; once it shifts, game over. Thus, these are particularly challenging funds to manage during volatile times when the index has large moves both up and down. There are also a few different types of ETF structures: exchange-traded open-end index mutual fund, exchange-traded unit investment trust, and exchange-traded grantor trust. Before purchasing an ETF, make sure you understand the details of its structure and the cost and tax implications it will have. Leveraged or inverse ETFs can be useful, but typically only for a short period of time, so make sure you understand exactly how they work.
Regardless of the type of structure, funds can be either actively managed or passive. Passive funds are typically index funds, meaning they attempt to as closely as possible track the performance of a particular index such as the S&P 500, or a specific commodity such as the price of gold, or a specific type of bond such as U.S. Treasury bonds with maturity greater than 20 years, a specific country index like the 50 largest companies in India, or a sector index such as healthcare, biotechnology, cybersecurity, utilities, or even water resources. Managers for actively managed funds buy and sell as they see fit in order to maximize returns and minimize losses. Typically, actively managed funds experience more turnover, meaning more securities are bought and sold, which translates into more expenses for the fund, and charge more because the manager is doing a lot of work. Index funds typically experience less turnover and their fees are notably lower because the manager is simply ensuring that the fund tracks its index as accurately as possible.
Cocktail Investing Bottom Line
Much like building your dream house, there are all sorts of decisions that you will have to make when constructing your investment portfolio now that you've identified the Cocktail Investing themes that will be the backbone of your portfolio. There are a variety of financial products, with different features that can make them appealing depending on one's investment risk tolerance, tax situation, and income needs.
- Investors need to be aware of how much time they will be able to devote to their portfolio and select securities accordingly. The more time available, the more stocks you can manage, the less time, the more you should consider diversified funds.
- Different types of securities are designed to meet different needs. Determine what you want from your portfolio, such as a target level of income generation and levels of volatility, then select candidate investments that can help you meet those goals.
- When comparing different investment products, you need to understand the various trade-offs between them (strategies, risks, fees, and other costs) as you refine your choices.
- When comparing individual stocks, be sure to compare companies within like industries, lest you fall victim to comparing apples and oranges when looking at various valuation and other metrics.
- The majority of investors have assets in funds, be they mutual funds or ETFs. Although both may offer diversification depending on the fund's investment strategy, mutual funds tend to have higher fees and expenses than ETFs, but may be more effective for actively managed strategies given the quarterly disclosures for holdings versus daily for ETFs.
- Investor dollars in ETFs have exploded over the last several years, which has led to the creation of many diverse and at times niche strategies that can offer exposure to various Cocktail Investing themes.
As we've discussed previously, investors can no longer rely on buy-and-hold investing, which is why in the next chapter we talk about proactively monitoring the investments in your portfolio.