12
Active Sensors
Now that your network is segmented, you need to actively monitor it to detect suspicious activities and potential threats and take actions based on that. Your security posture won’t be fully completed if you don’t have a good detection system; this means having the right sensors distributed across the network, monitoring the activities. The Blue Team should take advantage of modern detection technologies that create a profile of the user and computer in order to better understand anomalies and deviations in normal operations. With this information, preventative actions could be taken.
In this chapter, we are going to cover the following topics:
- Detection capabilities
- Intrusion detection systems
- Intrusion prevention systems
- Behavior analytics on-premises
- Behavior analytics in a hybrid cloud
We’ll start by discussing the importance of detection systems and what they can provide.
Detection capabilities
Since the current threat landscape is very dynamic and it changes rapidly, it requires detection systems that can quickly adjust to new attacks. The traditional detection systems that rely on manual fine-tuning of initial rules, fixed thresholds, and fixed baselines will most likely trigger too many false positives, and that’s not sustainable for many organizations nowadays. When preparing to defend against attackers, the Blue Team must leverage a series of techniques that include:
- Data correlation from multiple data sources
- Profiling
- Behavior analytics
- Anomaly detection
- Activity evaluation
- Machine learning
- Artificial intelligence
It is important to emphasize that some of the traditional security controls, such as protocol analysis and signature-based anti-malware, still have their place in the line of defense, but primarily to combat legacy threats. You shouldn’t uninstall your anti-malware software just because it doesn’t have any machine learning capability; it is still one level of protection for your host.
Remember the defense-in-depth approach that we discussed in Chapter 7, Chasing a User’s Identity? Think of this protection as one layer of defense, and the aggregation of all defenses will create your overall security posture that can be enhanced through additional defensive layers.
On the other hand, the traditional defender mindset that focuses on monitoring only high-profile users is over; you simply can’t have this approach anymore and expect to maintain an effective security posture. Current threat detections must operate across all user accounts, profile them, and understand their normal behavior. As we have described in previous chapters, current threat actors will be looking to compromise the regular user. Once they compromise the user, they will stay dormant in the network, continue the invasion by moving laterally, and potentially escalate privileges to gain access to administrative accounts. For this reason, the Blue Team must have detection mechanisms in place that can identify these behaviors across all devices and locations, and raise alerts based on the Data Correlation, as shown in the following diagram:

When you contextualize the data, you naturally reduce the number of false positives and give a more meaningful result to your incident response team to take reactive actions.
Indicators of compromise
When talking about detection, it is important to talk about Indicators of Compromise (IoCs). When new threats are found in the wild, they usually have a pattern of behavior, and they leave their footprint on the target system. IoCs can be found in hash values of files, specific IP addresses used by the threat actor, domain names associated with the type of attack, and network and host artifacts.
For example, one characteristic of Petya ransomware was the execution of a series of commands in the target system to reschedule a restart. Below, you have an example of these commands:
schtasks /Create /SC once /TN "" /TR "<system folder>shutdown.exe /r
/f" /ST <time>
cmd.exe /c schtasks /RU "SYSTEM" /Create /SC once /TN "" /TR "C:Windowssystem32shutdown.exe /r /f" /ST <time>
Another Petya IoC is the local network scan on ports TCP 139 and TCP 445. These are important indications that there is an attack taking place on the target system and, based on this footprint, Petya is the one to blame. Detection systems will be able to gather these IoCs and raise alerts when an attack happens. Using Microsoft Defender for Cloud as an example, some hours after the Petya outbreak, Defender for Cloud automatically updated its detection engine and was able to warn users that their machine was compromised, as shown in the following screenshot taken when Defender for Cloud was still called Azure Security Center:
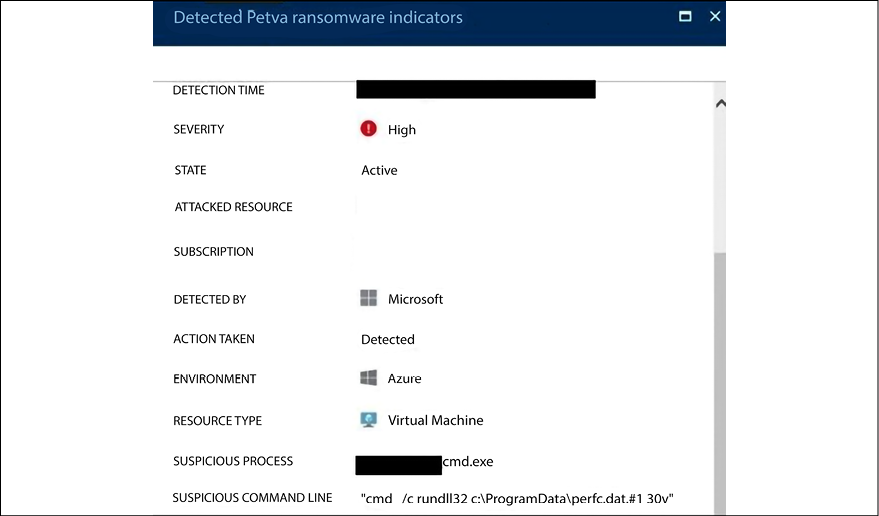
Figure 12.2: Defender for Cloud detecting the Petya ransomware and raising an alert
You can sign up with OpenIOC (http://openioc.org) to retrieve information regarding new IoCs and also contribute to the community. By using their IoC Editor (download at https://www.fireeye.com/content/dam/fireeye-www/services/freeware/sdl-ioc-editor.zip), you can create your own IoC or you can review an existing IoC. The example that follows shows the IoC Editor showing the Duqu Trojan IoC:
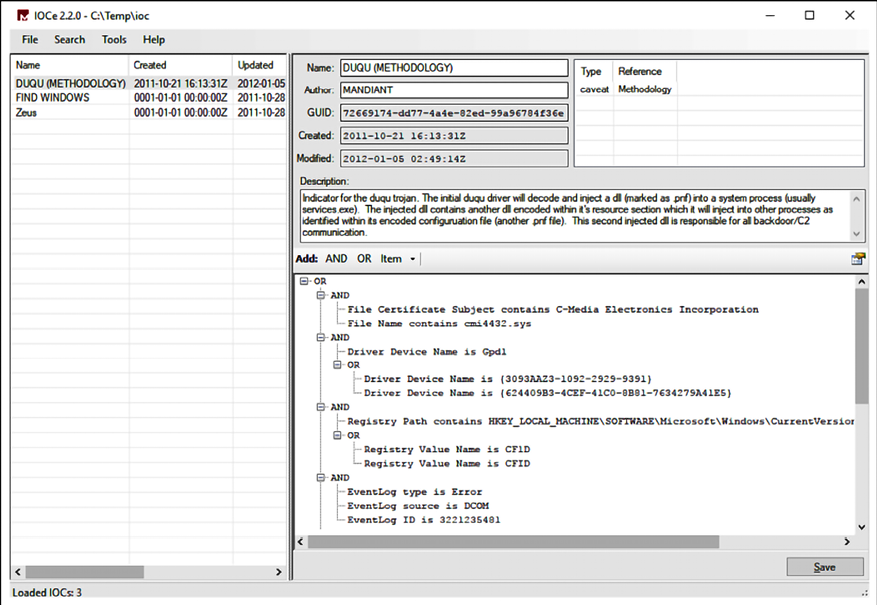
Figure 12.3: The IoC Editor displaying the Duqu Trojan IoC
If you look in the right lower pane, you will see all the IoCs and logic operators (in this case, most are AND) that compare each sequence and only return positive if everything is true. The Blue Team should always be aware of the latest threats and IoCs.
You can use the following PowerShell command to download an IoC from OpenIOC. For the following example, you are downloading the IoC for the Zeus threat:
wget http://openioc.org/iocs/72669174-dd77-4a4e-82ed-99a96784f36e.ioc"-outfile "72669174-dd77-4a4e-82ed-99a96784f36e.ioc"
Another place that you can browse for IoCs is the ThreatFox site https://threatfox.abuse.ch/browse. There, you can type in the IoC and search for it. Once you see the IoC on the screen, you can click on it to have the full visualization, as shown in the figure below:
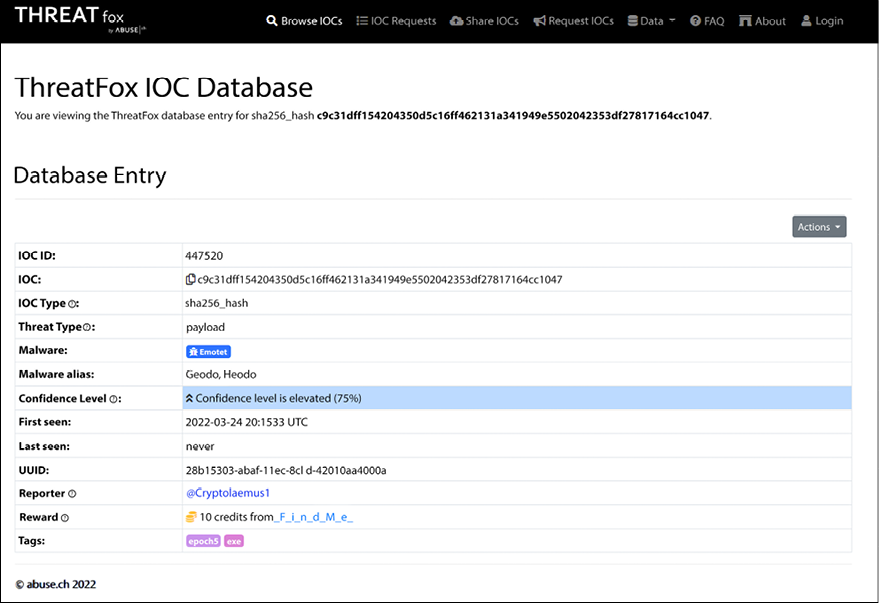
Figure 12.4: Searching for an Emotet IoC
If you have an Endpoint Detection and Response (EDR) system such as Microsoft Defender for Endpoint (MDE), you can also perform queries in the system to see if there are IoCs available. For example, to see if there is evidence of Cobalt Strike’s presence in the system, you can run the Kusto query below in MDE:
DeviceProcessEvents
| where FileName =~ "rundll32.exe"
| where InitiatingProcessIntegrityLevel in ("High", "System")
| where ProcessCommandLine matches regex
@'(?i)rundll32s+c:\windows(Error! Hyperlink reference not valid.'
The output of this command will show the presence of Cobalt Strike, which includes its IoCs. The file paths for a custom Cobalt Strike Beacon loader are listed below:
C:Windowsmssmssms.dll
C:WindowsMicrosoft.NETFramework64sbscmp30.dll
C:WindowsAUInstallAgentauagent.dll
C:Windowsapppatchapppatch64sysmain.dll
C:WindowsVssWritersApplicationAppXML.dll
C:WindowsPCHEALTHhealth.dll
C:WindowsRegistrationcrmlog.dll
C:WindowsCursorscursrv.dll
C:WindowsAppPatchAcWin.dll
C:WindowsCbsTempcbst.dll
C:WindowsAppReadinessAppapi.dll
C:WindowsPantherMainQueueOnline.dll
C:WindowsAppReadinessAppRead.dll
C:WindowsPrintDialogPrintDial.dll
C:WindowsShellExperiencesMtUvc.dll
C:WindowsPrintDialogappxsig.dll
C:WindowsDigitalLockerlock.dll
C:WindowsassemblyGAC_64MSBuild3.5.0.0__b03f5f7f11d50a3amsbuild.dll
C:WindowsMigrationWTRctl.dll
C:WindowsELAMBKUPWdBoot.dll
C:WindowsLiveKernelReportsKerRep.dll
C:WindowsSpeech_OneCoreEnginesTTSen-USenUS.Name.dll
C:WindowsSoftwareDistributionDataStoreDataStr.dll
C:WindowsRemotePackagesRemoteAppsRemPack.dll
C:WindowsShellComponentsTaskFlow.dll
Cobalt Strike Beacon:
aimsecurity[.]net
datazr[.]com
ervsystem[.]com
financialmarket[.]org
gallerycenter[.]org
infinitysoftwares[.]com
mobilnweb[.]com
olapdatabase[.]com
swipeservice[.]com
techiefly[.]com
To see the Beacon loader IoCs, visit https://www.cisa.gov/uscert/ncas/analysis-reports/ar21-148a.
Intrusion detection systems
As the name implies, an intrusion detection system (IDS) is responsible for detecting a potential intrusion and triggering an alert. What can be done with this alert depends on the IDS policy. When creating an IDS policy, you need to answer the following questions:
- Who should be monitoring the IDS?
- Who should have administrative access to the IDS?
- How will incidents be handled based on the alerts generated by the IDS?
- What’s the IDS update policy?
- Where should we install the IDS?
These are just some examples of initial questions that should help in planning the IDS adoption. When searching for an IDS, you can also consult a list of vendors at ICSA Labs Certified Products (www.icsalabs.com) for more vendor-specific information. Regardless of the brand, a typical IDS has the capabilities shown in the following diagram:

Figure 12.5: Typical IDS capabilities, visualized
While these are some core capabilities, the number of features will really vary according to the vendor and the method used by the IDS. The signature-based IDS will query a database of previous attack signatures (footprints) and known system vulnerabilities to verify that what was identified is a threat and whether an alert must be triggered. Since this is a database of signatures, it requires constant updates in order to have the latest version.
The behavior-based IDS works by creating a baseline of patterns based on what it learned from the system. Once it learns the normal behavior, it becomes easier to identify deviations from normal activity.
An IDS alert is any type of user notification to bring awareness about a potential intrusion activity.
IDS can be a host-based intrusion detection system (HIDS), where the IDS mechanism will only detect an intrusion’s attempt against a particular host, or it can be a network-based intrusion detection system (NIDS), where it detects intrusion for the network segment in which the NIDS is installed. This means that in the NIDS case, the placement becomes critical in order to gather valuable traffic. This is where the Blue Team should work closely with the IT infrastructure team in order to ensure that the IDSs are installed in strategic places across the network. Prioritize the following network segments when planning the NIDS placement:
- DMZ/perimeter
- Core corporate network
- Wireless network
- Virtualization network
- Other critical network segments
These sensors will only be listening to the traffic, which means they won’t be consuming too much network bandwidth. The diagram that follows has an example of where to put the IDS:
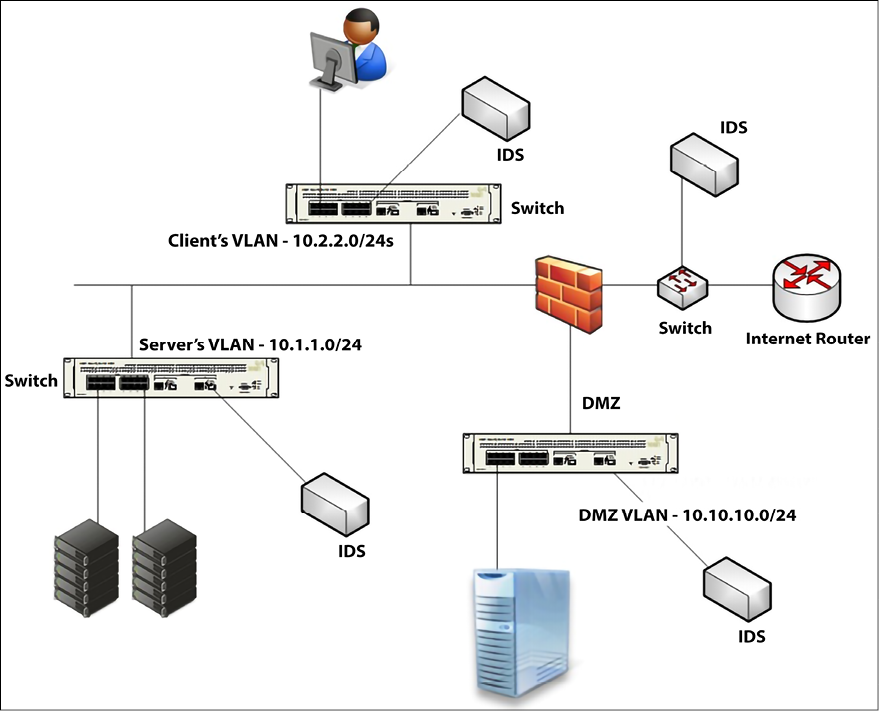
Figure 12.6: Examples of IDS placement
Notice that, in this case, an IDS (which in reality here is a NIDS) was added to each segment (leveraging a SPAN port on the network switch). Is it always like that? Absolutely not! It will vary according to your company’s needs. The Blue Team must be aware of the company’s constraints and help identify the best location where these devices should be installed.
Intrusion prevention system
An intrusion prevention system (IPS) uses the same concept as an IDS, but, as the name says, it prevents the intrusion by taking corrective action. This action will be customized by the IPS administrator in partnership with the Blue Team.
In the same way IDS is available for hosts (HIDS) and network (NIDS), IPS is also available for both, as HIPS and NIPS. The NIPS placement within your network is critical and the same guidelines that were previously mentioned are applicable here. You should also consider placing the NIPS inline with traffic in order to be able to take corrective action. IPS and IDS detections can usually operate in one or both of the following modes:
- Rule-based
- Anomaly-based
Rule-based detection
While operating this mode, the IPS will compare the traffic with a set of rules and try to verify whether the traffic matches the rule. This is very useful when you need to deploy a new rule to block an attempt to exploit a vulnerability. NIPS systems, such as Snort, are able to block threats by leveraging rule-based detection. For example, the Snort rule Sid 1-42329 is able to detect the Win.Trojan.Doublepulsar variant.
Snort rules are located under etc/snort/rules and you can download other rules from https://www.snort.org/downloads/#rule-downloads. When the Blue Team is going through an exercise with the Red Team, chances are that new rules must be created according to the traffic pattern and the attempts that the Red Team is making to infiltrate the system. Sometimes, you need multiple rules to detect a threat, for example, the rules 42340 (Microsoft Windows SMB anonymous session IPC share access attempt), 41978 (Microsoft Windows SMB remote code execution attempt), and 42329-42332 (Win.Trojan.Doublepulsar variant) can be used to detect WannaCry ransomware. The same applies to other IPSs, such as the Cisco IPS that has signatures 7958/0 and 7958/1, created to handle WannaCry.
Tip: Subscribe to the Snort blog to receive updates regarding new rules at http://blog.snort.org.
The advantage of using an open-source NIPS, such as Snort, is that when a new threat is encountered in the wild, the community usually responds rapidly with a new rule to detect the threat. For example, when the Petya ransomware was detected, the community created a rule and posted it on GitHub (you can see this rule here: https://goo.gl/mLtnFM). Although vendors and the security community are extremely quick to publish new rules, the Blue Team should be watching for new IoCs and creating NIPS rules based on these IoCs.
Anomaly-based detection
The anomaly detection is based on what the IPS categorizes as anomalous. This classification is usually based on heuristics or a set of rules. One variation of this is called statistical anomaly detection, which takes samples of network traffic at random times, and performs a comparison with a baseline. If this sample falls outside of the baseline, an alert is raised, and action will automatically be taken.
Behavior analytics on-premises
While there is a big movement to the cloud, there are many companies that operate in hybrid mode, where many resources are still on-premises. In some scenarios, organizations are leaving the critical data on-premises while migrating low-risk workloads to the cloud. As covered earlier in this book, the attacker tends to silently infiltrate your network and from there, move laterally, escalate privilege, and maintain connectivity with command and control until able to execute their mission. For this reason, having behavior analytics on-premises is imperative to quickly break the attack kill chain.
According to Gartner, it is foundational to understand how users behave, and by tracking legitimate processes, organizations can enlist user and entity behavior analytics (UEBA) to spot security breaches. There are many advantages to using UEBA to detect attacks, but one of the most important ones is the capability to detect attacks in the early stages and take corrective action to contain the attack.
The following diagram shows an example of how UEBA operates across different entities to make a decision as to whether an alert should be triggered or not:
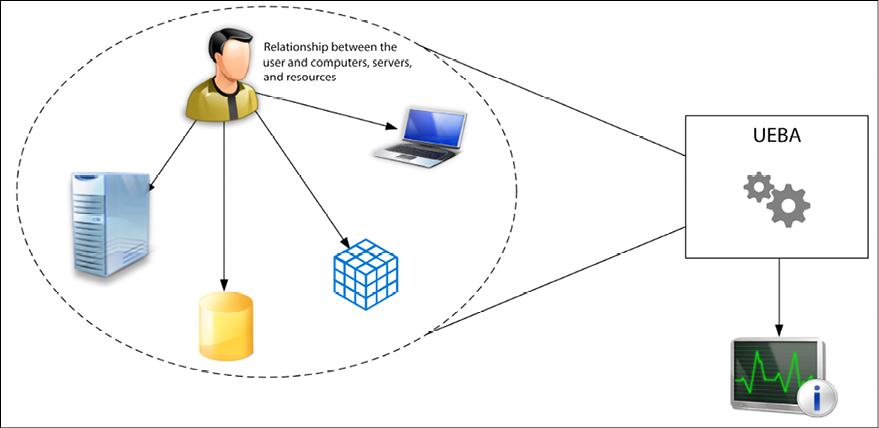
Figure 12.7: UEBA operating across different entities
Without having a system that can look broadly at all data and make correlations not only on the traffic pattern but also on a user’s profile, there is a significant chance that false positives will be detected.
For example, nowadays when you use your credit card in a place that you have never been before, or in a geographic location that you don’t normally go, someone will call you to validate that transaction if your credit card has monitoring protection. This happens because the system understands your credit card usage pattern, it knows the places that you visited before, the locations where you have made purchases, and even an average of what you usually spend. When you deviate from all these patterns that are interconnected, the system triggers an alert and the action that is taken is to have someone call you to double-check if it is really you performing this transaction. Notice that in this scenario, you are acting quickly in the early stage because the credit card company put that transaction on hold until they get your validation.
The same thing happens when you have a UEBA system on-premises. The system knows what servers your users usually access, what shares they usually visit, what operating system they usually use to access these resources, and their geo-location.
Some SIEM tools such as Microsoft Sentinel have UEBA capabilities built in. Microsoft Sentinel uses the following references to build the entity behavior analytics:
- Use cases: Prioritize attack vectors and use case scenarios based on security research, which uses the MITRE ATT&CK framework of tactics, techniques, and sub-techniques.
- Data sources: Prioritize Azure data sources but also allow ingestion from third-party data sources.
- Analytics: Leverage capabilities such as machine learning (ML) algorithms to identify anomalous activities.
The dashboard below shows a lot of insights from the selected user (JeffL), which can give you an idea of the timeline of alerts and which alerts have a relation with this user account, the activities that this user did, and which were considered suspicious, and additional insights about the user’s behavior:
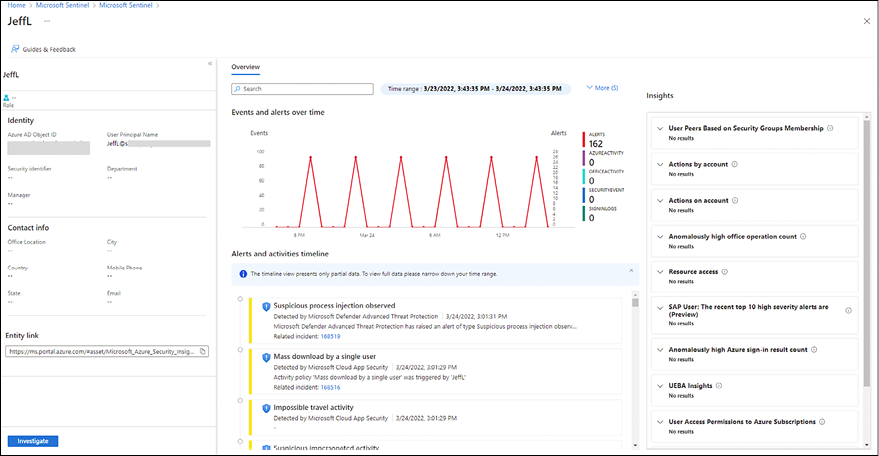
Figure 12.8: Entity behavior in Microsoft Sentinel
The lower part of the dashboard (Alerts and activities timeline) has a series of alerts that are aggregated from multiple data sources, as you can see in more detail below:
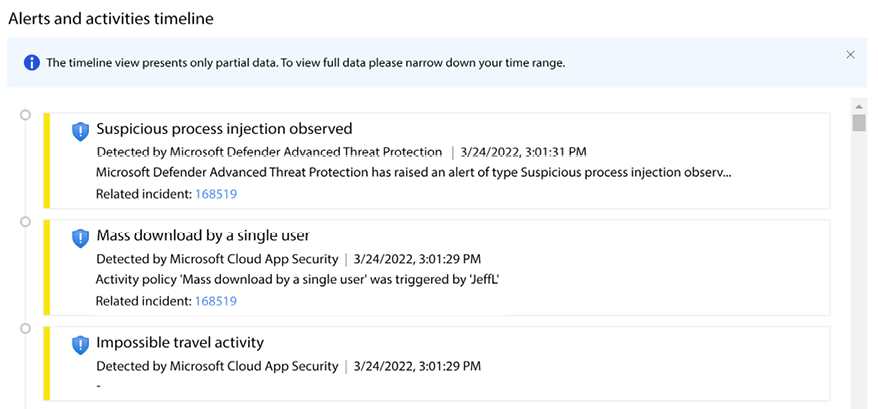
Figure 12.9: Alert timeline
If you look from top to bottom, you will see that the first alert is generated by Microsoft Defender Advanced Threat Protection (also known as MDE), while the second one was generated by Microsoft Cloud App Security (also known as Microsoft Defender for Cloud Apps). Upon clicking on one of those alerts, you will be redirected to the Log Analytics workspace that contains the data, and a query will be automatically created to give you more details about the activity, as shown in the example below:
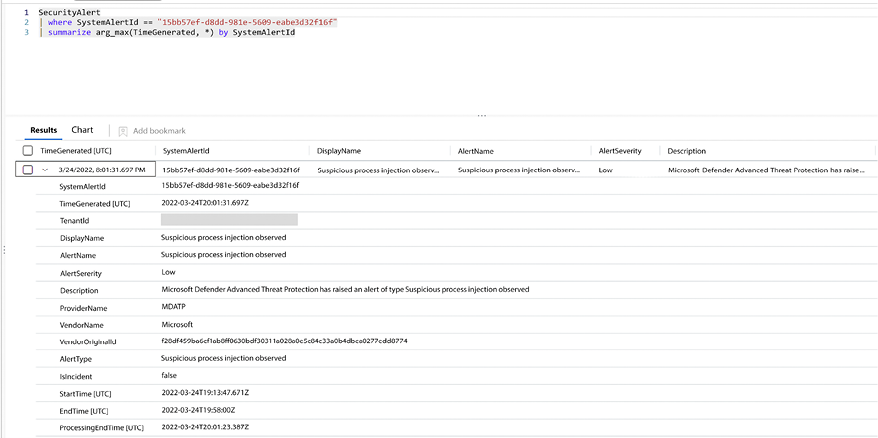
Figure 12.10: Kusto query automatically created by Microsoft Sentinel
All of this information about why the user’s behavior was flagged as suspicious can greatly help in determining whether the user’s activity might pose a larger threat to the system.
Device placement
Using the same principles that were previously discussed in the IDS section, the location where you will install your UEBA will vary according to the company’s needs and the vendor’s requirements. Some vendors will require you to configure the switch where the sensor is connected to use a port mirror to allow the traffic to be fully monitored by the sensor. Some other solutions may require only the installation of an agent. For example, Microsoft Defender for Identity will require you to install an agent on your Domain Controller (DC) to collect the necessary data. This data will be processed, and alerts may be triggered based on the type of activity detected.
These days, more and more companies are moving away from purely operating on-premises and toward working in hybrid environments, which come with additional considerations.
Behavior analytics in a hybrid cloud
When the Blue Team needs to create countermeasures to secure a hybrid environment, the team needs to expand its view of the current threat landscape and perform an assessment in order to validate continuous connectivity with the cloud and check the impact on the overall security posture. In a hybrid cloud, most companies will opt to use an IaaS model and, although IaaS adoption is growing, the security aspect of it is still the main concern, according to an Oracle report on IaaS adoption.
According to the same report, longer-term IaaS users suggest the technology ultimately makes a positive impact on security. In reality, it does have a positive impact and that’s where the Blue Team should focus their efforts on improving their overall detection. The intent is to leverage hybrid cloud capabilities to benefit the overall security posture. The first step is to establish a good partnership with your cloud provider, and understand what security capabilities they have and how these security capabilities can be used in a hybrid environment. This is important, because some capabilities are only available in the cloud, and not on-premises.
If you would like to read more about some of the benefits cloud computing can bring to your security posture, we recommend the article Cloud security can enhance your overall security posture.
Microsoft Defender for Cloud
The reason we are using Microsoft Defender for Cloud to monitor a hybrid environment is that the Log Analytics agent used by Defender for Cloud can be installed on a computer (Windows or Linux) on-premises, in a VM running in Azure, in AWS, or GCP. This flexibility and centralized management are important for the Blue Team. Defender for Cloud leverages security intelligence and advanced analytics to detect threats more quickly and reduce false positives. In an ideal scenario, the Blue Team can use this platform to visualize alerts and suspicious activities across all workloads located in different cloud providers.
A typical hybrid scenario is shown below, where the security admin is managing from one single dashboard resources located in multiple cloud providers and also on-premises resources:
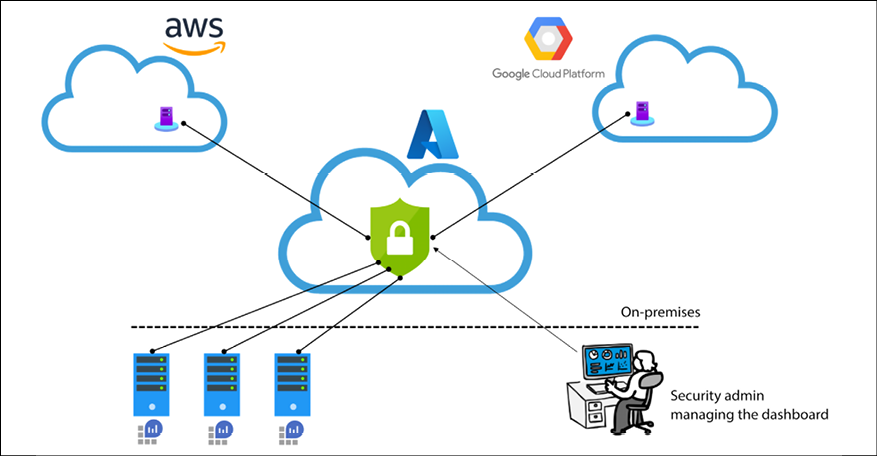
Figure 12.11: Hybrid cloud management from a centralized location
When Defender for Cloud is installed on these computers, it will collect Event Tracing for Windows (ETW) traces, operating system log events, running processes, machine names, IP addresses, and logged-in users. These events are sent to the Defender for Cloud backend where they will be analyzed and during this analysis, the following methods may be used:
- Threat intelligence
- Behavioral analytics
- Anomaly detection
Once this data is evaluated, Defender for Cloud will trigger an alert based on priority and add it to the dashboard, as shown in the following screenshot:

Figure 12.12: Azure Security Center with Defender for Cloud
The alerts are organized by priority, and you also have a column dedicated to mapping the alert to the MITRE ATT&CK tactics. This is very important information because it makes you aware of how deep into the organization the threat actor actually is. For example, the first attack on this list is a suspected brute-force attack attempt against a SQL database. This is part of the pre-attack phase, which means the threat actor is still trying to get into the environment. By having this type of alert available, you can take actions to prevent further actions, for example, by blocking the IP of the threat actor in the firewall itself.
To see more information about the alert, you have to click on it, and then you will see a blade with a more summarized version of the alert. To see all the data available, you click the View full details button and the entire page with the alert’s details appear, as shown below:
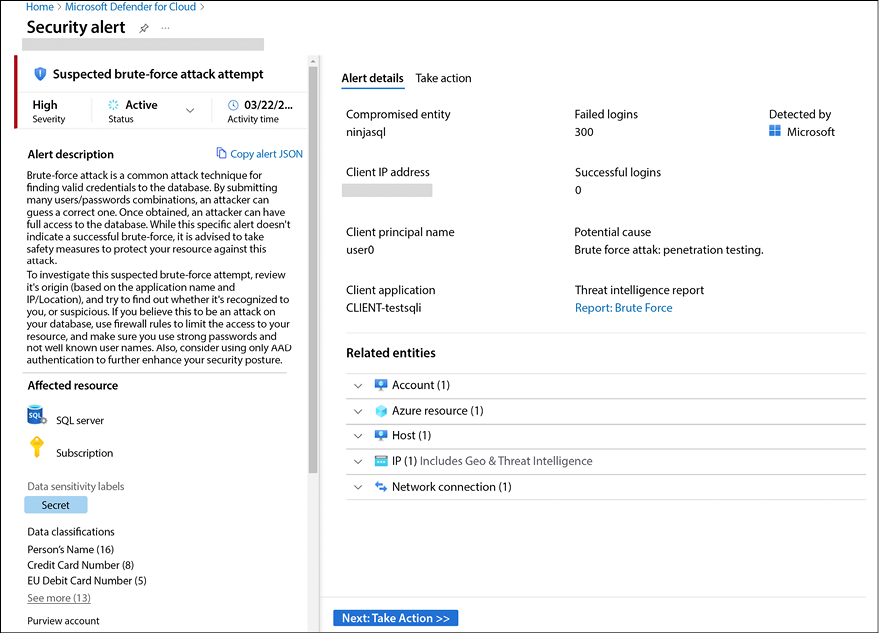
Figure 12.13: Details of a security alert in Defender for Cloud
The right side of this page has all the relevant details that can help you to investigate this alert, including the entities that were involved in this attack. On the second tab (Take action), you will also have instructions on how to respond to this alert and how to prevent this type of alert from happening in the future.
When the attempted attack is against VMs, Defender for Servers (which is a part of the Defender for Cloud plan) leverages statistical profiling to build historical baselines and alert on deviations that conform to a potential attack vector. This is useful in many scenarios; one typical example is deviations from normal activity. For example, let’s say a host starts a remote desktop connection using Remote Desktop Protocol (RDP) connections three times a day, but in a certain day, there are one hundred connections attempted. When such a deviation happens, an alert must be triggered to warn you about that.
Analytics for PaaS workloads
In a hybrid cloud, there are not only IaaS workloads; in some scenarios, it is actually very common for organizations to start their migration using PaaS (Platform as a Service) workloads. The security sensors and analytics for PaaS are highly dependent upon the cloud provider. In other words, the PaaS service that you are going to use should have threat detection capabilities with an alert system built-in.
In Azure, there are many PaaS services, and if we categorize the services from the level of security criticality, there is no question that any service that stores data is considered critical. For the Azure platform, this means that storage accounts and SQL databases are extremely critical. For this reason, Defender for Cloud has different plans to cover the threat detection of some Azure PaaS workloads. The available plans are:
- Defender for SQL: Enables threat detection for SQL in Azure
- Defender for Storage: Enables threat detection for Azure storage accounts
- Defender for Containers: Enables threat detection for Azure Container Registry and Kubernetes
- Defender for App Services: Enables threat detection for Azure Web Apps
- Defender for Key Vault: Enables threat detection for Azure Key Vault
- Defender for DNS: Enables threat detection for Azure DNS
- Defender for Resource Manager: Enables threat detection for Azure Resource Manager
The image below is an example of an alert generated by Defender for Containers:
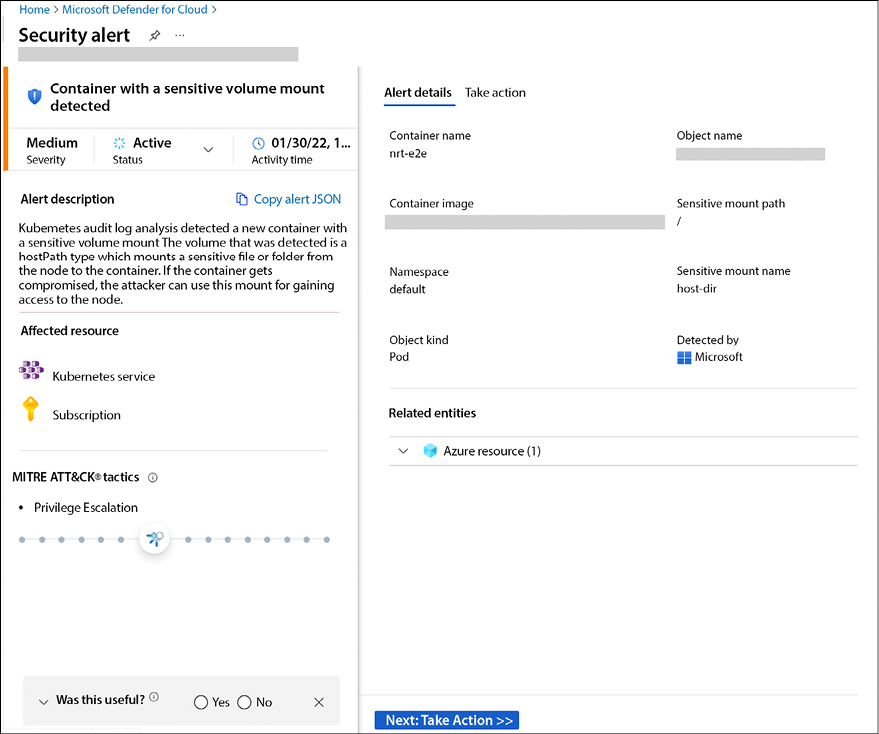
Figure 12.14: Details of a container alert
Each Defender for Cloud plan will have a different set of alerts based on the threat landscape for that particular service. For example, Defender for Storage will have alerts that are relevant for Azure Storage accounts. These alerts are important to bring awareness that something suspicious happened and this will help the incident response team to take an active security posture.
For more information about Microsoft Defender, watch the Defender for Cloud in the Field show presented by the co-author of this book Yuri Diogenes. Visit https://aka.ms/MDFCInTheField.
Summary
In this chapter, you learned about the different types of detection mechanisms and the advantages of using them to enhance your defense strategy. You learned about the indicators of compromise and how to query current threats. You also learned about IDS, how it works, the different types of IDS, and the best location to install your IDS based on your network. Next, you learned about the benefits of using an IPS, and how rule-based and anomaly-based detection works. An effective defense strategy wouldn’t be complete without good behavior analytics and, in this section, you learned how the Blue Team can benefit from this capability. Microsoft Sentinel was used to demonstrate behavior analytics, and Microsoft Defender was used as the hybrid solution for behavior analytics.
In the next chapter, we will continue talking about defense strategies; this time, you will learn more about threat intelligence and how the Blue Team can take advantage of threat intel to enhance the overall security of the defense systems.
References
- Snort Rules Explanation: https://www.snort.org/rules_explanation
- Introduction to IoC: http://openioc.org/resources/An_Introduction_to_OpenIOC.pdf.
- IoC Editor: https://www.fireeye.com/content/dam/fireeye-www/services/freeware/sdl-ioc-editor.zip
- DUQU Uses STUXNET-Like Techniques to Conduct Information Theft: https://www.trendmicro.com/vinfo/us/threat-encyclopedia/web-attack/90/duqu-uses-stuxnetlike-techniques-to-conductinformation-theft
- How to Select a Network Intrusion Prevention System (IPS): https://www.icsalabs.com/sites/default/files/HowToSelectANetworkIPS.pdf
- Detect Security Breaches Early by Analyzing Behavior: https://www.gartner.com/smarterwithgartner/detect-security-breaches-earlyby-analyzing-behavior/
- You and IaaS - Learning from the success of early adopters: https://www.oracle.com/assets/pulse-survey-mini-report-3764078.pdf
Join our community on Discord
Join our community’s Discord space for discussions with the author and other readers:

