
In this recipe, we will explore a few simple built-in SVG shape formulae and their attributes. These simple shapes are quite easy to generate and are usually created manually using D3 when necessary. Though these simple shapes are not the most useful shape generator to know when working with D3, occasionally they could be handy when drawing peripheral shapes in your visualization project.
Open your local copy of the following file in your web browser:
https://github.com/NickQiZhu/d3-cookbook/blob/master/src/chapter7/simple-shapes.html
In this recipe, we will draw four different shapes in four different colors using native SVG shape elements:
<script type="text/javascript">
    var width = 600,
        height = 500;

    var svg = d3.select("body").append("svg");

    svg.attr("height", height)
        .attr("width", width);

    svg.append("line") // <-A
        .attr("x1", 0)
        .attr("y1", 200)
        .attr("x2", 100)
        .attr("y2", 100);

    svg.append("circle") // <-B
        .attr("cx", 200)
        .attr("cy", 150)
        .attr("r", 50);

    svg.append("rect")
        .attr("x", 300) // <-C
        .attr("y", 100)
        .attr("width", 100) // <-D
        .attr("height", 100)
        .attr("rx", 5); // <-E

    svg.append("polygon")
        .attr("points", "450,200 500,100 550,200"); // <-F
</script>
The preceding code generates the following visual output:
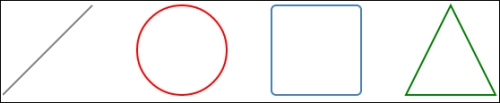
Simple SVG shapes
We have drawn four different shapes: a line, a circle, a rectangle, and a triangle in this example using SVG built-in shape elements.
A little refresher on SVG coordinate system
SVG x and y coordinate system originates from the top-left corner (0, 0) of the canvas and ends on the lower-right corner (<width>, <height>).
line: A line element creates a simple straight line with coordinate attributesx1andy1as its start point andx2,y2as its end point (see lineA).circle: Theappend()function draws a circle with coordinate attributescxandcydefining the center of the circle while the attributerdefines the radius of the circle (see lineB).rect: Theappend()function draws a rectangle with coordinate attributesxandydefining the top-left corner of the rectangular (see lineC), attributeswidthandheightfor controlling the size of the rectangle, and the attributesrxandrycan be used to introduce rounded corners. The attributesrxandrycontrol the x- and y-axis radius of the ellipse used to round off the corners of the rectangle (see lineE).polygon: To draw a polygon, a set of points that makes up the polygon need to be defined using apointsattribute (see lineF). Thepointsattribute accepts a list of point coordinates separated by space:svg.append("polygon") .attr("points", "450,200 500,100 550,200"); // <-F
All SVG shapes can be styled using style attributes directly or through CSS similar to HTML elements. Furthermore, they can be transformed and filtered using SVG transformation and filter support, however, due to limited scope in this book, we will not cover these topics in detail. In the rest of this chapter, we will focus on D3-specific supports on SVG shape generation instead.
SVG also supports ellipse and polyline elements, however, due to their similarity to circle and polygon we will not cover them in detail in this book. For more information on SVG shape elements, please visit http://www.w3.org/TR/SVG/shapes.html.
The "swiss army knife" among SVG shape elements is svg:path. A path defines the outline of any shape which can then be filled, stroked, or clipped. Every shape we have discussed so far can be mathematically defined using svg:path alone. SVG path is a very powerful construct and has its own mini-language and grammar. The svg:path mini-language is used to set the "d" attribute on an svg:path element, which consists of the following commands:
- moveto: Command M(absolute)/m(relative) moveto (x y)+
- closepath: Z(absolute)/z(relative) closepath
- lineto: L(absolute)/l(relative) lineto (x y)+, H(absolute)/h(relative) horizontal lineto x+, V(absolute)/v(relative) vertical lineto y+
- Cubic Bézier: C(absolute)/c(relative) curve to (x1 y1 x2 y2 x y)+, S(absolute)/s(relative) shorthand curve to (x2 y2 x y)+
- Quadratic Bézier curve: Q(absolute)/q(relative) quadratic Bézier curve to (x1 y1 x y)+, T(absolute)/t(relative) shorthand quadratic Bézier curve to (x y)+
- Elliptical curve: A(absolute)/a(relative) elliptical arc (rx ry x-axis-rotation large-arc-flag sweep-flag x y)+
As directly using paths is not a very pleasant method due to its cryptic language, therefore, in most cases, some kind of software, for example, Adobe Illustrator or Inkscape is required to assist us in creating the SVG path element visually. Similarly, D3 ships with a set of SVG shape generator functions that can be used to generate data-driven path formulae; this is how D3 truly revolutionizes the field of data visualization by combining the power of SVG with intuitive data-driven approach. This is also going to be the focus for the rest of this chapter.
- Please refer to http://www.w3.org/TR/SVG/Overview.html for more information on SVG-related topics
- For a complete reference on SVG path formula language and its grammar please visit http://www.w3.org/TR/SVG/paths.html