
A bar chart is a visualization that uses either horizontal (row charts) or vertical (column charts) rectangular bars with length proportional to the values that they represent. In this recipe we will implement a column chart using D3. A column chart is capable of visually representing two variables at the same time with its y axis; in other words, the bar height, and its x axis. The x axis values can be either discrete or continuous (for example, a histogram). In our example we choose to visualize continuous values on the x axis and hence effectively implementing a histogram. However, the same techniques can be applied when working with discrete values.
Open your local copy of the following file in your web browser:
https://github.com/NickQiZhu/d3-cookbook/blob/master/src/chapter8/bar-chart.html
The following code example shows the important implementation aspects of a histogram with accessors and peripheral graphic implementation details omitted.
...
var _width = 600, _height = 250,
  _margins = {top: 30, left: 30, right: 30, bottom: 30},
  _x, _y,
  _data = [],
  _colors = d3.scale.category10(),
  _svg,
  _bodyG;

  _chart.render = function () {
    if (!_svg) {
      _svg = d3.select("body").append("svg")
        .attr("height", _height)
        .attr("width", _width);

    renderAxes(_svg);

    defineBodyClip(_svg);
  }

  renderBody(_svg);
};
...
function renderBody(svg) {
  if (!_bodyG)
    _bodyG = svg.append("g")
      .attr("class", "body")
      .attr("transform", "translate("
        + xStart()
        + ","
        + yEnd() + ")")
      .attr("clip-path", "url(#body-clip)");

  renderBars();
  }

function renderBars() {
  var padding = 2; // <-A

  _bodyG.selectAll("rect.bar")
    .data(_data)
    .enter()
    .append("rect") // <-B
    .attr("class", "bar");

  _bodyG.selectAll("rect.bar")
    .data(_data)
    .transition()
    .attr("x", function (d) {
      return _x(d.x); // <-C
    })
    .attr("y", function (d) {
      return _y(d.y); // <-D
    })
    .attr("height", function (d) {
      return yStart() - _y(d.y); // <-E
    })
    .attr("width", function(d){
      return Math.floor(quadrantWidth() / _data.length) - padding;
  });
}
...
This recipe generates the following visualization:
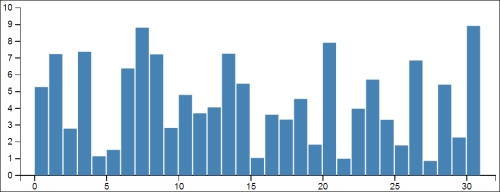
Bar chart (histogram)
One major difference here is that the bar chart implementation does not support multiple data series. Therefore instead of using a 2-dimensional array storing multiple data series as we did with other charts so far, in this implementation, the _data array simply stores a single set of data points directly. Main bar chart related visualization logic resides in the renderBars function.
function renderBars() {
  var padding = 2; // <-A
  ...
}
In the first step, we defined the padding between bars (line A), so later on we can automatically calculate the width of each bar. Afterwards we generate an svg:rect element (the bars) for each data point (line B).
_bodyG.selectAll("rect.bar")
  .data(_data)
  .enter()
  .append("rect") // <-B
  .attr("class", "bar");
Then in the update section we place each bar at the correct coordinates using its x and y attributes (line C and D) and extend each bar all the way down to touch the x axis with an adaptive height calculated on line E.
_bodyG.selectAll("rect.bar")
  .data(_data)
  .transition()
  .attr("x", function (d) {
    return _x(d.x); // <-C
  })
  .attr("y", function (d) {
    return _y(d.y); // <-D
  })
  .attr("height", function (d) {
    return yStart() - _y(d.y); // <-E
  })
Finally we calculate the optimal width for each bar using the number of bars as well as the padding value we have defined earlier.
.attr("width", function(d){
  return Math.floor(quadrantWidth() / _data.length) - padding;
});
Of course in a more flexible implementation, we can make the padding configurable instead of being fixed to 2 pixels.
Before planning to implement your own reusable chart for your next visualization project, make sure you also check out the following open source reusable chart projects based on D3:
- NVD3: http://nvd3.org/.
- Rickshaw: http://code.shutterstock.com/rickshaw/.