
In this chapter we will cover:
- Creating simple shapes
- Using a line generator
- Using line interpolation
- Changing line tension
- Using an area generator
- Using area interpolation
- Using an arc generator
- Implementing arc transition
Scalable Vector Graphics (SVG) is a mature World Wide Web Consortium (W3C) standard designed for user interactive graphics on the Web and Mobile platform. Similar to HTML, SVG can coexist happily with other technologies like CSS and JavaScript in modern browsers forming the backbone of many web applications. In today's Web, you can see use cases of SVG everywhere from digital map to data visualization. So far in this book we have covered most of the recipes using HTML elements alone, however, in real-world projects, SVG is the de facto standard for data visualization; it is also where D3's strength really shines. In this chapter, we will cover the basic concept of SVG as well as D3's support for SVG shape generation. SVG is a very rich topic. Volumes of books can be and have been devoted to this topic alone, hence, we are not planning or even going to try to cover all SVG-related topics, rather we'll focus on D3 and data visualization related techniques and features.
As its name suggests, SVG is about graphics. It is a way to describe graphical image with scalable vectors. Let's see two of the main SVG advantages:
SVG image is based on vectors instead of pixels. With the pixel-based approach, an image is composed of a bitmap with x and y as its coordinates filled with color pigmentations. While with the vector-based approach, each image consists of a set of geometric shapes described using simple and relative formulae filled with certain texture. As you can imagine, this later approach fits naturally with data visualization requirement. It is much simpler to visualize your data with lines, bar, and circles in SVG versus trying to manipulate color pigmentations in a bitmap.
The second signature capability of SVG is scalability. Since SVG graphic is a group of geometric shapes described using relative formulas, it can be rendered and re-rendered with different sizes and zoom levels without losing precision. On the other hand, when bitmap-based images are resized to a large resolution, they suffer the effect of pixelation, which occurs when the individual pixels become visible, while SVG does not have this drawback. See the following figure to get a better picture of what we just read:
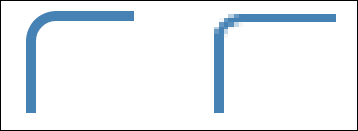
SVG versus bitmap pixelation
As a data visualizer, using SVG gives you the benefit of being able to display your visualization on any resolution without losing the crispiness of your eye-catching creation. On top of that, SVG offers you some additional advantages such as:
- Readability: SVG is based on XML, a human-readable markup language
- Open standard: SVG was created by W3C and is not a proprietary vendor standard
- Adoption: All modern browsers support SVG standard, even on mobile platform
- Interoperability: SVG works well with other web technologies, such as CSS and JavaScript; D3 itself is a perfect demonstration of this capability
- Lightweight: Compared to bitmap-based images, SVG is a lot lighter, taking up much less space
Because of all these capabilities we have mentioned so far, SVG has become the de facto standard for data visualization on the Web. From this chapter onwards, all recipes in this book will be illustrated using SVG as its most important part, with which the true power of D3 can be professed.