
In the Creating an area chart recipe in Chapter 8, Chart Them Up, we have explored how a basic layered area chart can be implemented using D3. In this recipe, we will build over what we have learned in the area chart recipe to implement a stacked area chart. Stacked area chart is a variation of the standard area chart in which different areas are stacked on top of each other giving your audience not only the ability to compare different data series individually but also their relationship to the total in proportion.
Open your local copy of the following file in your web browser:
https://github.com/NickQiZhu/d3-cookbook/blob/master/src/chapter9/stacked-area-chart.html.
This recipe is built over what we have implemented in Chapter 8, Chart Them Up, therefore in the following code example only the parts that are particularly relevant to the stacked area chart are included:
<script type="text/javascript">
function stackedAreaChart() {
  var _chart = {};

  var _width = 900, _height = 450,
    _margins = {top: 30, left: 30, right: 30, bottom: 30},
    _x, _y,
    _data = [],
    _colors = d3.scale.category10(),
    _svg,
    _bodyG,
    _line;

  _chart.render = function () {
    if (!_svg) {
      _svg = d3.select("body").append("svg")
      .attr("height", _height)
      .attr("width", _width);

    renderAxes(_svg);

    defineBodyClip(_svg);
  }

  renderBody(_svg);
};
...
function renderBody(svg) {
  if (!_bodyG)
    _bodyG = svg.append("g")
      .attr("class", "body")
      .attr("transform", "translate("
        + xStart() + ","
        + yEnd() + ")")
      .attr("clip-path", "url(#body-clip)");

  var stack = d3.layout.stack() //<-A
    .offset('zero'),
  stack(_data); //<-B

  renderLines(_data);

  renderAreas(_data);
}

function renderLines(stackedData) {
  // explained in details in the'how it works...' section
...
}

function renderAreas(stackedData) {
  // explained in details in the 'how it works...' section
...
}
...
This recipe generates the following visualization:
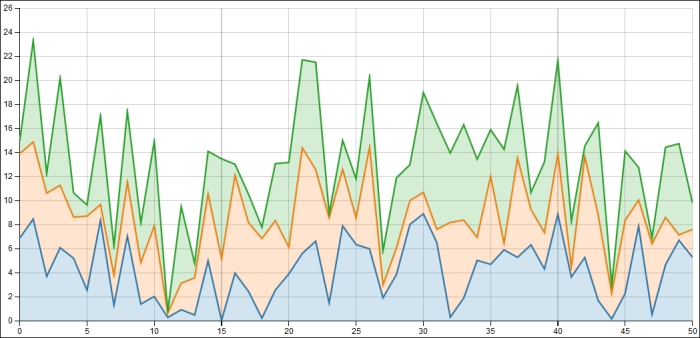
Stacked area chart
The main difference between this recipe and standard area chart as well as the focus on this recipe is the stacking. The stacking effect as illustrated in this recipe was achieved through d3.layout.stack created on line A.
var stack = d3.layout.stack() //<-A
  .offset('zero'),
stack(_data); //<-B
The only customization we have done on stack layout is setting its offset to zero. D3 stack layout supports a few different offset modes which determine what stacking algorithm to use; this is something that we will explore in this and the next recipe. In this case we use the zero offset stacking which generates a zero base-lined stacking algorithm, which is exactly what we want in this recipe. Next, on line B, we invoked the stack layout on the given data array which generates the following layout data:
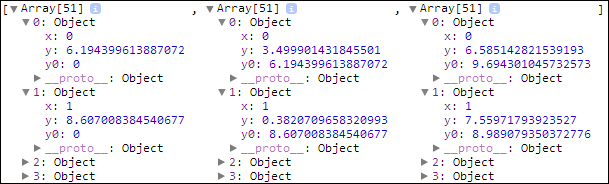
As shown, the stack layout automatically calculates a baseline y0 for each datum in our three different data series. Now with this stacked dataset in hand, we can easily generate stacked lines.
function renderLines(stackedData) {
  _line = d3.svg.line()
    .x(function (d) {
      return _x(d.x); //<-C
    })
    .y(function (d) {
      return _y(d.y + d.y0); //<-D
    });
  _bodyG.selectAll("path.line")
    .data(stackedData)
    .enter()
    .append("path")
    .style("stroke", function (d, i) {
      return _colors(i);
    })
    .attr("class", "line");

  _bodyG.selectAll("path.line")
    .data(stackedData)
    .transition()
    .attr("d", function (d) {
      return _line(d);
    });
}
A D3 line generator function was created with its x value directly mapped to the x (line C) and its y value mapped to y + y0 (line D). This is all you need to do for line stacking. The rest of the renderLines function is essentially the same as in the basic area chart implementation. The area stacking logic is slightly different:
function renderAreas(stackedData) {
  var area = d3.svg.area()
    .x(function (d) {
      return _x(d.x); //<-E
    })
    .y0(function(d){return _y(d.y0);}) //<-F
    .y1(function (d) {
      return _y(d.y + d.y0); //<-G
    });
  _bodyG.selectAll("path.area")
    .data(stackedData)
    .enter()
    .append("path")
    .style("fill", function (d, i) {
      return _colors(i);
    })
    .attr("class", "area");

  _bodyG.selectAll("path.area")
    .data(_data)
    .transition()
    .attr("d", function (d) {
      return area(d);
    });
}
Similar to the line rendering logic when rendering area, the only place we need to change is in the d3.svg.area generator setting. For areas the x value is still directly mapped to x (line E) with its y0 directly mapped with y0 and finally again y1 is the sum of y and y0 (line G).
As we have seen so far, D3 stack layout is nicely designed to be compatible with different D3 SVG generator functions. Hence, using it to generate the stacking effect is quite straightforward and convenient.
Let's take a look at a couple of variations of the stacked area chart.
We have mentioned that d3.layout.stack supports different offset modes. In addition to the zero offset we have seen so far, another very useful offset mode for area chart is called expand. With the expand mode, stack layout will normalize different layers to fill the range of [0, 1]. If we change the offset mode in this recipe and the y axis domain to [0, 1], we will get the expanded (normalized) area chart shown below.
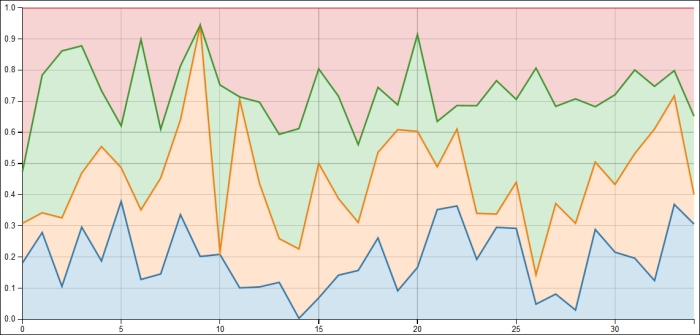
For the complete companion code example please visit: https://github.com/NickQiZhu/d3-cookbook/blob/master/src/chapter9/expanded-area-chart.html.
Another interesting variation of stacked area chart is called streamgraph. Streamgraph is a stacked area chart displayed around a central axis creating a flowing and organic shape. Streamgraph was initially developed by Lee Byron and popularized by its use in a New York Times article on movie box office revenues in 2008. The D3 stack layout has built-in support for this kind of stacking algorithm therefore changing a zero based stacked area chart to streamgraph is trivial. The key difference is that streamgraph uses wiggle as its layout offset mode.
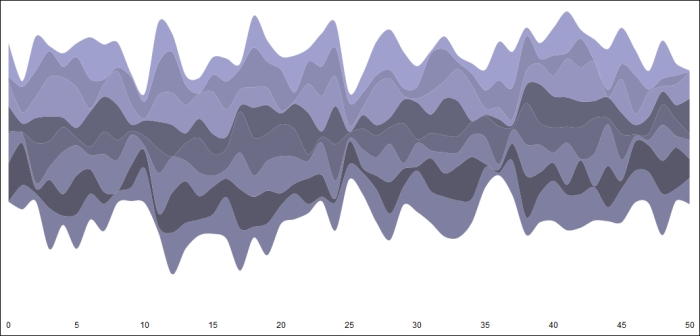
For the complete companion code example please visit: https://github.com/NickQiZhu/d3-cookbook/blob/master/src/chapter9/streamgraph.html.
d3.layout.stackoffers several additional functions to customize its behavior; for more information on stack layout visit https://github.com/mbostock/d3/wiki/Stack-Layout- The Creating an area chart recipe in Chapter 8, Chart Them Up