
In this recipe, we will examine the most commonly-used scales provided by D3—the quantitative scales including linear, power, and logarithmic scales.
Open your local copy of the following file in your web browser:
https://github.com/NickQiZhu/d3-cookbook/blob/master/src/chapter4/quantitative-scales.html
Let's take a look at the following code example:
<div id="linear" class="clear"><span>n</span></div>
<div id="linear-capped" class="clear">
<span>1 <= a*n + b <= 20</span>
</div>
<div id="pow" class="clear"><span>n^2</span></div>
<div id="pow-capped" class="clear">
<span>1 <= a*n^2 + b <= 10</span>
</div>
<div id="log" class="clear"><span>log(n)</span></div>
<div id="log-capped" class="clear">
<span>1 <= a*log(n) + b <= 10</span>
</div>
<script type="text/javascript">
var max = 11, data = [];
for (var i = 1; i < max; ++i) data.push(i);
    var linear = d3.scale.linear() // <-A
        .domain([1, 10]) // <-B
        .range([1, 10]); // <-C
    var linearCapped = d3.scale.linear()
        .domain([1, 10])
        .range([1, 20]); // <-D
var pow = d3.scale.pow().exponent(2); // <-E
    var powCapped = d3.scale.pow() // <-F
        .exponent(2)
        .domain([1, 10])
        .rangeRound([1, 10]); // <-G
var log = d3.scale.log(); // <-H
    var logCapped = d3.scale.log() // <-I
        .domain([1, 10])
        .rangeRound([1, 10]);
function render(data, scale, selector) {
d3.select(selector).selectAll("div.cell")
.data(data)
.enter().append("div").classed("cell", true);
d3.select(selector).selectAll("div.cell")
.data(data)
.exit().remove();
d3.select(selector).selectAll("div.cell")
.data(data)
.style("display", "inline-block")
.text(function (d) {
return d3.round(scale(d), 2);
});
}
render(data, linear, "#linear");
render(data, linearCapped, "#linear-capped");
render(data, pow, "#pow");
render(data, powCapped, "#pow-capped");
render(data, log, "#log");
render(data, logCapped, "#log-capped");
</script>The preceding code generates the following output in your browser:
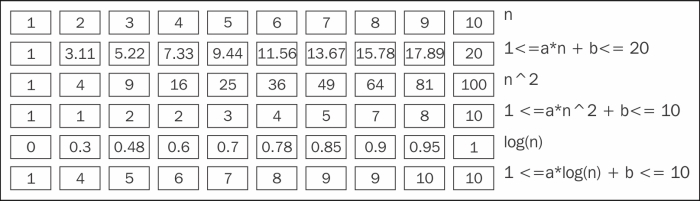
Quantitative scale output
In this recipe, we have demonstrated some of the most common scales provided by D3.
Linear Scale
In the preceding code example, we have our data array filled with integers from 0 to 10—as shown on the line marked as A—we created a linear scale
by calling the d3.scale.linear() function. This returns a linear quantitative scale with the default domain set to [0, 1] and the default range set to [0, 1]. Thus the default scale is essentially the identity function
for numbers. Therefore, this default function is not that useful to us, but typically needs to be further customized by using its domain and range functions on line B and C. In this case, we set them both to [1, 10]. This scale basically defines the function f(n) = n.
var linear = d3.scale.linear() // <-A
.domain([1, 10]) // <-B
.range([1, 10]); // <-C Identity scale
The second linear scale is a little bit more interesting and it illustrates the mapping between two sets better. On line D, we set the range as [1, 20], which is different from its domain. Hence, now this function is essentially representing the following equations:
- f(n) = a * n + b
- 1 <= f(n) <= 20
This is by far the most common case when using D3 scales because your data set will be an identical match of your visual set.
var linearCapped = d3.scale.linear()
.domain([1, 10])
.range([1, 20]); // <-DLinear scale
In this second scale, D3 will automatically calculate and assign the value of constants a and b to satisfy the equation.
Pow Scale
The second scale we have created is a
power scale
. On line E, we defined a power scale with exponent of 2. The d3.scale.pow() function returns a default power scale function with its exponent set as 1. This scale effectively defines the function f(n) = n^2.
var pow = d3.scale.pow().exponent(2); // <-E
Simple power scale
On line F, a second power scale was defined, this time with a different range set on line G with rounding; the rangeRound() function works pretty much the same as the range() function, which sets the range for a scale. However, the rangeRound function rounds the output number so that there are no decimal fractions. This is very handy since scales are commonly used to map elements from the data domain to visual domain. So, the output of a scale is very likely to be a number describing some visual characteristics, for example, the number of pixels. Avoiding sub-pixel numbers is a useful technique that prevents anti-alias in rendering.
The second power scale defines the following function f(n) = a*n^2 + b, 1 <= f(n) <= 10.
var powCapped = d3.scale.pow() // <-F
.exponent(2)
.domain([1, 10])
.rangeRound([1, 10]); // <-GPower scale
Similar to the linear scale, D3 will automatically find the suitable constants a and b to satisfy the constraints defined by domain and range on a power scale.
Log Scale
On line H, a third kind of quantitative scale was created using the d3.scale.log() function. The default log scale has a base of 10. Line H essentially defines the following mathematical function f(n) = log(n).
var log = d3.scale.log(); // <-H
Simple log scale
On line I, we customized the log scale to have a domain of [1, 10] and a rounded range of [1, 10], which defines the following constrained mathematical function f(n) = a*log(n) + b, 1 <= f(n) <= 10.
var logCapped = d3.scale.log() // <-I
.domain([1, 10])
.rangeRound([1, 10]);Log scale
D3 also provides other additional quantitative scales including quantize, threshold, quantile, and identity scales. Due to limited scope in this book and their relatively less common usage, they are not discussed here, however, the basic understanding of scales discussed and explained here will definitely help your understanding of other additional quantitative scales provided by the D3 library. For more information on other types of quantitative scales please visit https://github.com/mbostock/d3/wiki/Quantitative-Scales#wiki-quantitative