
It is sometimes necessary to interpolate colors when you are interpolating values that do not contain numbers but rather RGB or HSL color code. This recipe addresses the question how can you define scales for color codes and perform interpolation on them?
Open your local copy of the following file in your web browser:
https://github.com/NickQiZhu/d3-cookbook/blob/master/src/chapter4/color-interpolation.html
Color interpolation is such a common operation in visualization that D3 actually provides four different kinds of interpolators dedicated for color supporting—RGB, HSL, L*a*b*, and HCL color space. In this recipe, we will demonstrate how color interpolation can be performed in RGB color space. However, all other color interpolators work in the same way.
<div id="color" class="clear">
    <span>Linear Color Interpolation<br></span>
</div>
<div id="color-diverge" class="clear">
    <span>Poly-Linear Color Interpolation<br></span>
</div>

<script type="text/javascript">
    var max = 21, data = [];

    var colorScale = d3.scale.linear() // <-A
        .domain([0, max])
        .range(["white", "#4169e1"]);

    function divergingScale(pivot) { // <-B
        var divergingColorScale = d3.scale.linear()
            .domain([0, pivot, max]) // <-C
            .range(["white", "#4169e1", "white"]);
        return divergingColorScale;
    }

    for (var i = 0; i < max; ++i) data.push(i);

    function render(data, scale, selector) { // <-D
        d3.select(selector).selectAll("div.cell")
                .data(data)
            .enter()
                .append("div")
                    .classed("cell", true)
                .append("span");

        d3.select(selector).selectAll("div.cell")
                .data(data)
            .exit().remove();

        d3.select(selector).selectAll("div.cell")
                .data(data)
            .style("display", "inline-block")
            .style("background-color", function(d){
                return scale(d); // <-E
            })
            .select("span")
                .text(function(d,i){return i;});
    }

    render(data, colorScale, "#color");
    render(data, divergingScale(5), "#color-diverge");
</script>
The preceding code produces the following visual output:
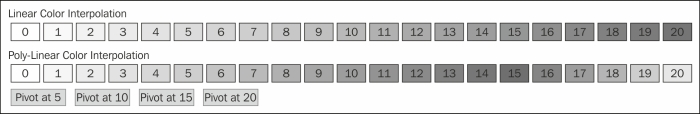
Color interpolation
The first step in this recipe is defining a linear color scale on line A with its range set as ["white", "#4169e1"].
var colorScale = d3.scale.linear() // <-A
    .domain([0, max])
    .range(["white", "#4169e1"]);
One new technique used in this recipe, that we haven't encountered yet, is the poly-linear scale
, which is defined in the divergingScale function on line B.
function divergingScale(pivot) { // <-B
    var divergingColorScale = d3.scale.linear()
        .domain([0, pivot, max]) // <-C
        .range(["white", "#4169e1", "white"]);
    return divergingColorScale;
}
A poly-linear scale is a scale with non-uniformed linear progression. It is achieved by providing a poly-linear domain on a linear scale as we can see on line C. You can think of a poly-linear scale as stitching two linear scales with different domains together. So this poly-linear color scale is effectively the two following linear scales combined together.
d3.scale.linear()
    .domain([0, pivot]).range(["white", "#4169e1"]);
d3.scale.linear()
.domain([pivot, max]).range(["#4169e1", "white "]);
No surprise in the rest of the recipe. The render() function defined on line D generates 20 cells that are numbered by its index and colored using the output of two color scales we defined earlier. Clicking the buttons on the web page (such as Pivot at 5) will show you the effect of pivoting at different positions in a poly-linear color scale.
- For a complete list of supported color keywords in CSS3, please refer to W3C official reference http://www.w3.org/TR/css3-color/#html4