


Global–Local Tensions:
Key Issues for Design
in an Unsustainable World
This chapter charts how our world is changing in order to highlight the key issues that all designers need to engage with now and tomorrow. The extent and speed of these changes to our global environment, to the human condition and to the man-made and natural world are astounding. All trends point to a reduction in biodiversity and a deterioration of the life-giving support provided by global ecosystems. One species – humans – are causing the demise of tens of thousands of the estimated 5–10 million species that inhabit planet Earth. If all humans were benefiting from this exploitation of natural capital then the global human consciousness could sleep easier. But in reality there are billions of people in abject poverty living in conditions where improving quality of life (QoL), and thereby the potential for human development, remains a considerable challenge. There is a daunting task ahead, during the early to mid-21st century, to try to balance the Earth’s ability to provide biological sustenance with a growing human population, and to simultaneously nurture a ‘better life’ for humans. This task is made immeasurably more difficult against a background of climate change.
Significant changes are taking place within the global ‘commons’ – such as climate change,1 changing sea levels,2 water availability from the hydrosphere3 – and within more local socio-economic, political and bio-regional circumstances (see for example the challenge in China).4 Change is global and local, and inseparable, because even local economies are caught up in the global economy and the phenomenon of globalization. Aside from this global–local dualism, there is another major dualism that needs to be highlighted. 80 per cent of the world’s population, 5.4 billion out of a total of today’s 6.7 billion people, still struggle to maintain a QoL due to low income, and are subject to the vagaries of variable potable water supply, poor sanitation and disease, often coupled with socio-economic and political instability.5 Based on data from 2005, almost 2.6 billion people are caught in ‘absolute poverty’ – defined as an income of less than US$2 a day – and 5.12 billion earn less than US$10 per day.6
It is proposed that this majority of the world should therefore be called the underconsumers – they actually need to consume more to elevate their very basic standard of living. The remaining 20 per cent of the world, the rich, are the profligate over-consumers. This 20 per cent of the population uses approximately 83 per cent of the world’s resources,7 a situation that most societies would recognize as grossly unfair. The basic human ‘physiological and safety needs’ as envisaged by Abraham Maslow or ‘subsistence needs’ as framed by Manfred Max-Neef, in their respective needs typologies,8 are met for this global minority. However, meeting these needs requires phenomenal quantities of raw materials, finished products and energy, all originating from finite natural capital (often the natural capital of other poorer nation states, in the form of imports). The excessive consumption patterns of this minority are causing a severe strain on global life-supporting ecosystems, generating new social problems and pre-empting options for future generations worldwide.9
Is there any good news? A 2006 report by the World Wide Fund for Nature (WWF) noted that, of the countries with total populations exceeding 1 million, Cuba was the only country in the world that was living within its ecological capacity and encouraging improvement of the human development index (HDI) of its citizens to what the United Nations Development Programme (UNDP) considers ‘high human development’, an HDI of 0.8 where 0.2 is the lowest and 1.0 the highest.10 This is not to say that Cuba is a model for a sustainable nation state, but there are valuable lessons in Cuba’s development over the past two to three decades that have taken place despite international economic and trade embargoes and limited oil imports. In a sense, Cuba has already made the transition to a post-peak oil economy because it was denied oil imports, and the embedded economic model that the oil economy supports, that other countries took for granted. What has happened in Cuba has required a re-learning about the ecology of the country’s land mass and a social journey to understand how to live better on that land.
A Precarious Balance in a Changing Climate
The world came together to discuss the global environmental crisis in 1972 at the United Nations Conference on the Human Environment,11 but it took another 20 years for widespread recognition of the criticality of the situation. In 1992, representatives from more than 190 nations gathered in Rio de Janeiro for the United Nations’ Earth Summit.12 The urgency of the debate had, in part, been accelerated by a landmark report, Our Common Future, prepared by the World Commission on Environment and Development (WCED) some five years earlier. The WCED definition of sustainable development – ‘development that meets the needs of the present without compromising the ability of future generations to meet their own needs’ – is one of the most frequently cited definitions.13 It encourages anyone thinking about development to address key issues now and to take a long-term view.
The Earth Summit generated a raft of agreements and principles, including Agenda 21, which called for a radical shift in socio-economic and political governance to more open and participatory forms in order to effectively combat the most severe global environmental problems. Other important documents included the Framework Convention on Climate Change, Convention on Biological Diversity, Statement on Forest Principles and the Rio Declaration.14 Principle 15 of the Rio Declaration was the ‘precautionary principle’, which states that even if there were an absence of scientific consensus that an action or policy may cause severe or irreversible harm to humans or the environment, the onus falls on those who would advocate taking the action to prove it is not harmful. It was intended to encourage self-editing action among the world’s nations to develop in a way that would not irrevocably harm the Earth’s ecosystems or social systems on which we all depend. In Rio, the United Nations also laid the foundations for further international research, negotiation and agreements on combating climate change. The continued work of the UN’s Intergovernmental Panel on Climate Change (IPCC) helped guide the path towards development of the Kyoto Protocol in 1997. The Protocol achieved an international agreement between the industrialized nations to reduce greenhouse gas emissions by 5.2 per cent, compared with 1990 data, in the period 2008–2012.15
What has happened since the Rio Earth Summit? Negotiations on climate change have been protracted and largely ineffectual in changing trends due to the abstention of some developed nations, notably the US and Australia, and some emerging nations, notably India and China, from making positive contributions to the process. Talks in Bali in late 2007 – about what happens after the Kyoto Protocol’s first period ends in 2012 – did win some consensus, brought Australia into line, got China and India involved, and ended with the Americans being isolated (again).16 The real crunch is in Copenhagen in 2009 when the post-2012 deal will be brokered. Pre-industrial concentrations of carbon dioxide were 280ppm (parts per million); today it is about 385ppm rising at 2ppm per annum. By 2009 there may be more evidence as to the criticality of imposing a threshold of 450ppm of carbon dioxide, which the IPCC predicts will result in a 2°C rise in global temperature – a global temperature rise not experienced on the planet for over 3 million years. Lynas actually sees carbon dioxide concentrations of 450ppm as beyond a key threshold because at this juncture significant positive carbon feedback cycles kick in, with an acceleration of melting of ice at the poles and in frozen soils in northern latitudes of Russia and Canada, releasing vast quantities of methane, a powerful greenhouse gas.17 Lynas notes that global emissions must peak at 2015 under a 400ppm target to keep the temperature rise below the 1.1–2°C increase. On current international agreements this simply does not look feasible.
The Fourth Assessment Report of the IPCC, released in 2007, specified a number of scenarios for climate change.18 The most optimistic – the low-emission scenario – forecasts a sharp reduction in greenhouse gas emissions to keep global warming to 1.1°C, the most pessimistic predicts a rise of 6.4°C by 2100. The impact of each scenario reveals an increasingly polarized world where freshwater distribution changes radically, ecosystems become degraded, food production systems disrupted, coastlines severely damaged and human health takes a downturn (Figure 3.1). Lynas gives a graphic account of what this may mean for humans and other forms of life.19 Whether you are a dissenter20 or an advocate21 there are two events in recent memory which demonstrate that significant climate change is already dramatically affecting people’s lives. Hurricane Katrina arrived in New Orleans in August 2005 making millions homeless in the city and the environs of the Gulf of Mexico. Nearly half a million refugees continue to live in Texas today.22 Another rather less spectacular incident, that remains more of a footnote in the international media, is the case of the Carteret Islands in the Pacific Ocean. In November 2003, the Papua New Guinean government backed a progressive evacuation of the Carteret Islands over a decade as the islanders became the world’s first ‘climate refugees’.23 Over the next few years, rising sea water levels will further contaminate drinking water and agricultural activities. Evacuation is now under way and it is expected that by 2015 the islands will be uninhabitable. These rather insidious changes may be a foretaste of things to come.
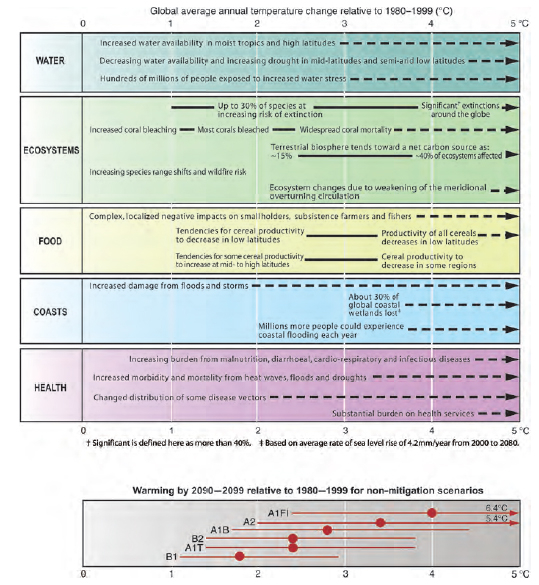
Figure 3.1
IPCC impacts associated with global average temperature rise
Invoking the precautionary principle seems an eminently sensible position regarding climate change, for ourselves, future generations and for a wider living world. As Al Gore noted, climate change is the inconvenient truth because most models of economic development do not factor in the true costs of climate change, and most governments are not asking basic questions about how the economic model(s) need to change.24 The publication of Sir Nicholas Stern’s report for the UK government on the costs of climate change certainly focused the economists with its prediction that it would take 1–2 per cent of world GDP to avert the worst consequences of climate change if we act now, and 15–20 per cent of world GDP if we do nothing.25 Whereas governments had hardly heard the voices of diverse climate change activists over the previous decade, Gore and Stern made them sit up.
The definition of who and what are the major contributors to carbon dioxide and other greenhouse gas emissions is a science fraught with different approaches. The top five nations vary according to the metric used (Table 3.1). Key to the debate to reduce carbon emissions is the political position of the US, the European Union, Russia, China and the Middle Eastern states. If they do not reach agreement then the expectation of increasing levels of carbon dioxide and irrevocable climate change in the 21st century will forge a new global reality. The main sectors contributing to carbon dioxide emissions are industry (40 per cent), buildings – homes, offices and so on (31 per cent), transportation (22 per cent) and agriculture (4 per cent). Design can be a powerful intermediary for new and retrofitted solutions in all these areas.26 Solutions are most likely to involve eco-efficient technologies and behavioural change, for example, Lynas27 suggests:
• halve the distances people drive each year and double the vehicle fuel economy (this is a ‘Factor 4’ gain)
• dramatically increase the energy efficiency of buildings
• dramatically increase the efficiency of fossil-fuelled power stations
• construct 2 million 1MW wind turbines to generate electricity
• cover 2 million hectares of land with solar panels
• stop the destruction of tropical rainforests and dramatically increase tree planting elsewhere
• choose between carbon dioxide injection and capture in underground reservoirs and investing in 1400 new gas power plants to produce electricity
• move towards a slower lifestyle strategy by not driving or flying, shopping locally, growing one’s own food and focusing on local communities.
Three metrics to measure the nations contributing most to carbon dioxide emissions (data year 2000)
Percentage of global | Emissions per capita | Carbon intensity (tonnes | ||
| US 20.8 | Qatar 18.5 | Ukraine 483 | ||
| China 14.8 | UAE 10.1 | Russia 427 | ||
| EU (collectively) 14.0 | Kuwait 9.5 | Saudi Arabia 260 | ||
| Russia 5.7 | Bahrain 7.0 | Poland 230 | ||
| India 5.5 | Australia and US 6.8 | Iran 223 | ||
| Source: Henson (2006)28 | ||||
There is a broad coalition of activist organizations that are lobbying governments to take more action to avert the worst forecasts of global warming, from well-known environmental organizations, such as Friends of the Earth,29 to single-issue organizations, such as Plane Stupid,30 fighting to prevent new airports being built in the UK. Governments are also taking action at a national and regional level, for example, the UK government initiated The Carbon Trust as a means to accelerate the move towards a low-carbon economy.31 It therefore seems important for designers to take on a larger role in addressing climate change issues. Those who have looked at improving the energy efficiency of technologies using nonrenewable energy sources (oil, gas, coal), or who create new designs using renewable energy sources (wind, solar, water, geothermal), or who reduce the energy requirements of their products, or who use light-weighting to reduce materials, or who encourage recycling at ‘end-of-life’, are all ‘default’ design activists since their intention is to reduce dependence on non-renewable energy sources and/or help transition towards genuinely sustainable energy-based economies. However, eco-efficiency improvement in products, services and buildings can only go so far. Designers will need to encourage positive eco-efficient behavioural changes to significantly reduce per capita carbon footprints.
Resource Depletion
One of the most dramatic psychological shifts we need to make about the future is our perception about the amount and condition of natural capital in the world. A screaming headline in a UK national newspaper, ‘Two-thirds of world’s resources “used up”’ was written by a respected newspaper science editor, Tim Radford, on the publication of the Millennium Ecosystem Assessment (MEA).32 The statistics are thought provoking: 24 per cent of the land surface is now appropriated for agriculture; 40–50 per cent of all available fresh water running off the land is used by humans; groundwater sources are being used up faster than they are replenished; the Yellow River in China, the Nile in north Africa and the Colorado in the US now dry up completely for parts of the year; 12 per cent of bird species, 25 per cent of mammals and 30 per cent of amphibians are threatened with extinction during the next century. And then we are running out of an energy source that, literally, fuelled the last 100 years of the industrial and consumer revolutions – oil from fossil fuels. All designers, as specifiers, are implicit in resource use and so have a key role to play in averting resource depletion. Current rates of consumption of resources actually mean we require the equivalent of two planets for energy, construction materials and metals to maintain growth and development.33 Sometime in the 1980s, the rate of consumption of global resources exceeded the capacity of natural capital to regenerate itself by 25 per cent and consumption rates are still increasing. Over the past decade, rates of consumption have increased due to an increasing world population (from 6 billion in 2000 to 6.7 billion in 2008) and phenomenal economic growth in India, China and Asia in general. Short-term adjustments are needed to improve eco-efficient use of these resources by 50 per cent, or a factor of two times (Factor 2) and much higher factors will be required for longer-term social, political, economic and environmental stability.
Oil and peak oil
The spectre of running out of fossil fuel reserves, and having to find alternative energy sources was first raised by a geologist, Marion King Hubbert in 1956, working then for Shell and from 1964 onwards for the US Geological Survey. He predicted that US oil would reach peak production in 1970 and decline thereafter.34 It peaked in 1971. He further predicted a similar phenomenon for the world oil supply by the turn of the millennium, a view supported by the Association for the Study of Peak Oil and Gas (Figure 3.2). His thinking has come to fruition some 50 years later, with a growing acceptance of the concept that we have just passed/reached ‘peak oil’, i.e. we have used more than 50 per cent of the world’s oil reserves. This realization has garnered many commentators and activists to talk about life after peak oil35 and ‘energy descent’ to transition to a post-peak oil economy.36 Peak oil also means peak synthetic plastics, as oil is the main raw ingredient for these materials. It is presently difficult to conceive a world without oil and plastics, but perceptions will undergo some adjustment in the next generation or two. Receiving less debate, but possibly more important than the depletion of one energy source (the world’s oil reserves), is the depletion of essential minerals, land for food production and potable water.
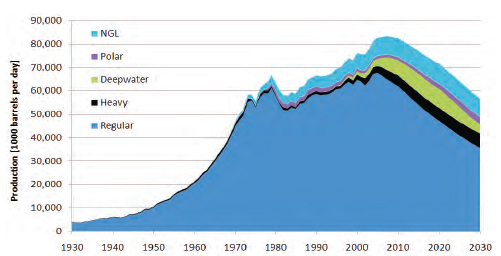
Figure 3.2
Peak oil and gas liquids, 2004 scenario
Essential minerals
It is possible that the world’s businesses, especially the manufacturing sector, are sleepwalking into the future. In 2006, reports collated from some of the most respected international institutions, with expertise in materials and resources, indicated that supplies of some essential minerals would be depleted within a decade while others would last only for a generation.37
Land for food production
As the population increases, so does the demand for food and for land that can be converted to some form of agriculture. In addition to these demands there is a more recent demand for the growing of biofuels to replace fossil fuels and to meet carbon dioxide emission agreements that is putting additional strain on food production and tropical rainforest destruction. The United Nations’ Food and Agriculture Organization (FAO) has examined how some of these issues are evolving in terms of food insecurity and the notion of paying farmers for looking after land to provide environmental, or ecosystem, services.38 Add the phenomenon of peak oil into the equation and agriculture looks set to make a paradigm shift in its fundamental practices over the next 50 years. Organic farming, urban farming and permaculture-based systems with their low fossil fuel inputs (reduced oil and oil derivatives such as fertilizers and pesticides) already set the benchmark. Cuba’s collective experiment over the past 20 years may provide a blueprint for new directions for agriculture to pursue.
Water for humans and agriculture
The pressures on the world’s freshwater reserves are steadily increasing due to population growth, increased demand from consumers and industry, urbanization and changes to global hydrology systems. Since 1998, World Water has been tracking the state of global water reserves and consumption39 and the increasing number of conflicts about these finite resources.40 WWF reports a doubling of demand for world water between 1960 and 2000, with agriculture currently using 70 per cent and industry 20 per cent of available reserves.41 Data on the withdrawals of water to availability ratio (wta ratio) show that 40 per cent of countries with a population over 1 million are showing severe water stress; 20–40 per cent moderate stress and 5–20 per cent mild stress. As the climate warms, the mid-latitudes in the Northern hemisphere will be subject to even more reduced water availability. It is therefore not surprising that well- known international aid agencies, like Christian Aid, are running media campaigns asking the ‘over-consumers’ to turn their thermostats down a degree.
Ecological Capacity and Biodiversity
The demands of anthropogenic activities are putting the world’s ecosystems under stress. Nature is struggling to cope with the rate of consumption of its resources and its capacity to absorb the outputs of the global, regional and local economies. The MEA system was set up by the United Nations in 2000 to scientifically review the state of the world’s ecosystems, assess what this may mean for human well-being and propose sensible policies to mitigate change and instigate improvements.42 The first report by the MEA revealed that of the five main ecosystem types studied (agro-ecosystems, coastal systems, forest systems, freshwater, grasslands), the vast majority were showing a decline in ecosystem capacity to provide adequate food and fibre production, water quality and quantity, biodiversity and carbon storage.43 In other words, the natural capital working to maintain the Earth’s ecosystems is struggling to renew and regenerate itself because humankind is extracting too much and/or polluting or disturbing the ecological balance of these systems (Figure 3.3).
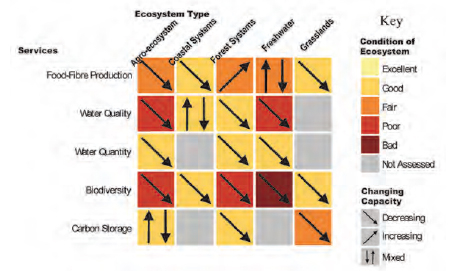
Figure 3.3
The condition of many global ecosystems has been declining
The data on reductions of biodiversity and species in danger of extinction are even more disturbing. Over 41,500 species, including 12,000 plants, are currently listed on the International Union for Conservation of Nature and Natural Resources (IUCN) Red List, i.e. those under real threat of disappearing forever.44 It is estimated that the list will grow to 50,000–60,000 species during 2008. Data going back 50 years indicate that the current state of affairs is part of a longer-term trend. Between 1950 and 1997, the world elephant population decreased by 90 per cent, as a result of habitat destruction, habitat alteration, restriction of population movements and illegal poaching, and the global rainforest cover decreased by 30 per cent.45 Every choice a designer makes when specifying materials has an effect on the habitat of other living species, so knowing where materials come from is an essential design skill.
In an effort to examine just how much of natural capital different nation states were using, Rees and Wackernagel devised a model of accounting called ‘ecological footprinting’.46 At the core of the model is the idea that each country has a measurable ecological capacity, i.e. ecological productive land (and sea) and mineral wealth, and that it has a specific population in a given land area. The consumption of the citizens of each nation state is measured by examining data from within the country and data concerning exported and imported goods and products. An estimate can then be made as to whether citizens of a nation are living within their ecological capacity (and are in ecological credit) or are borrowing from other people’s ecological capacity (and are in therefore in ecological debt). Figure 3.4 reveals that the majority of the developed countries – the ‘North’ – are in ecological debt; they are borrowing significant amounts of ecological capacity by importing food, raw materials, energy and goods. If ecological capacity were shared out equally between all the citizens of the world, we would each have about 1.8 global hectares (ha) per capita equivalent on which to survive. Typically, the citizens of developed nations of the North have footprints in excess of 4 and up to nearly 12 global ha per capita, whereas most citizens in the South have well below the global average. The New Economics Foundation (NEF) mapped the UK’s global ecological footprint revealing just how extensive the reach of a developed nation for other nation’s resources can be (Figure 3.5).47 The WWF’s Living Planet Report48 reveals ecological footprint (EF) data for 148 countries. Seventeen of these countries have an EF of more than three times the global average, with North Americans (USA and Canada), two oil-rich Middle Eastern states (UAE and Kuwait) and two Scandinavian countries (Finland and Sweden) showing the highest EFs of all (Figure 3.6).
Ecological footprinting has its weaknesses as an ecological accounting model.49 A key underlying assumption of the ecological footprinting methodology, and one the deep ecologists and biocentric thinkers do not subscribe to, is that only a very small percentage of the globe’s biocapacity, 12.5–13.4 per cent, is allocated to all the other living species. This appears rather ungenerous and possibly is a dangerously low figure as we absolutely depend upon other living organisms to help regulate nature’s support systems.

Figure 3.4
Countries in ecological deficit or credit

Figure 3.5
The UK’s global ecological footprint
Add the inequity in use of our global ecological capacity to the anticipated changes in global climate, and its likely consequences on nature’s ecosystems and food production hint at future problems for nations’ food security. The fragility of global food production systems was further reinforced by perturbations of world food prices following the ‘credit crunch’ and oil price rises between mid-2007 and late 2008. Threats to the world’s ecosystems directly impact on human welfare and survival, placing the poorest at most risk.
Unsustainable Consumption and Production
Whichever metric is applied – from ecological footprinting to environmental space50 – it is abundantly clear that current rates of consumption of many resources are unsustainable. This is inextricably linked to our current systems of consumption and production. Climate change, resource depletion, the potential instability of ecosystems and our erosion of ecological capacity are some of the manifest symptoms of these consumption trends. The response by designers to the consumption and production agenda is diverse, ranging from discussions about systems change at a manufacturing level to notions of ‘cradle-to-cradle’, ‘life cycle thinking’ and ‘industrial ecology’ 51 to detailed design for the environment 52 or eco-design approaches in product design and manufacturing.53 It also embraces ideas of dematerializing products by the provision of more product service systems (PSS).54 Wider issues of consumption are covered in the green and ethical consumption debate and there is an emerging body of work reexamining the human motivational and economic drivers required for more sustainable consumption and production (SCP).55
The ‘back story’ to each product, what happens upstream of the product and its associated rucksack of environmental impacts, has encouraged a variety of approaches including light-weighting and materials intensity per unit service (MIPS).56 Upstream and downstream impacts are covered for a variety of everyday products in the Worldwatch Institute’s Good Stuff guide.57
Social Inequality, Poverty and Migration
At the heart of the sustainability prism (page 24) is a call for fairer distribution of economic, ecological, social and institutional capital between and within members of societies. Taking the economic dimension, statistics from the World Bank indicate that poverty levels remain shockingly high for the vast majority of the world’s citizens and the rich-poor income differential is widening.58 The richest 20 per cent account for 75 per cent of world income, whereas the poorest 40 per cent account for only 5 per cent of world income. This economic inequality is matched by great disparities in a wide range of social indicators from poor provision for schools, low literacy levels, poor health (often linked with inadequate access to clean water and appropriate sanitation), malnourishment and poor life expectancy. While many of these disparities are recognized and specific goals have been set, for example, within the United Nations’ Millennium Development Goals, progress is slow. Poverty, and its legion effects, remains one of the most shameful issues of the 21st century for all humankind. As does the issue of gender equality as recognition of women’s rights is still woefully inadequate within many nation states.
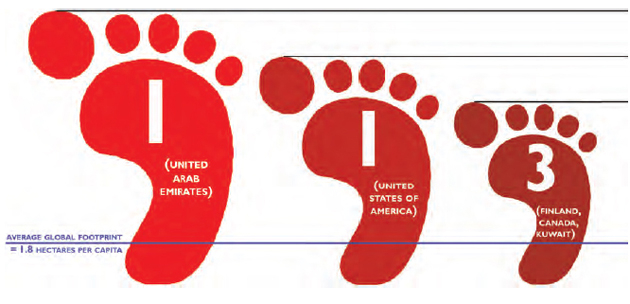
Figure 3.6
The ecological footprint of the ‘over-consumers’
With an increasing world population likely to rise from the current 6.7 billion to 8.9 billion by 2050,59 social inequalities look set to increase unless there is a significant redistribution of wealth. The main population gains are going to be in the poorer countries, where the migration to urban centres coupled with a bulge in the demography towards the young could create significant future hardship.60 To add to this pretty toxic mix of trends, it is predicted that climate change will force migrations unprecedented since the beginning of the Industrial Revolution. Current migration trends reported by the United Nations show 13.5 million refugees in 2005;61 and The Migration Policy Institute reveals a world on the move.62 In our polyglot world there are numerous reasons for this migration, from economic necessity to political/ethnic persecution and refugees from hunger, war and, now, climate change; migration looks set to increase in the next 25–40 years.

Economic Inequity and New Visions of Enterprise
The global economy is still struggling to come to terms with the implications for finite limits of resources against a background of a rising global population, very high economic growth rates in two emerging nations, India and China (together accounting for more than one-third of world population) and the uncertainties introduced by climate change and peak oil. The financial world is also experiencing a collective shock as the ongoing ‘credit crunch’ of 2007 continues, reducing global cash available to banks and lenders alike and causing uncertainties around future employment and economic growth. However, this may be a blessing in disguise as Spangenberg63 points out that, ‘economic growth can only be environmentally sustainable if it is accompanied by resource productivity increases that are higher than the rate of growth’. This implies striving for and reaching much higher levels of eco-efficient production such as Factor 4 – a halving of resource use and a doubling of outputs64 – and Factor 10 – a 90 per cent improvement on current efficiencies.65 The current economic models of capitalism do not appear to be factoring these calculations into their immediate or long-term business plans, although some transnational businesses have adopted a downshifting view of resource use by applying The Natural Step model which accepts drastic future cuts in material resource flows.66 PricewaterhouseCoopers, a leading global financial consultancy, think that sustainability is about creating new business value beyond the traditional view of assets, financial rewards, investors and customers (Figure 3.7). This involves a desire to include a wider range of stakeholders who will contribute to the creation of new values, including brand and intellectual value and also adding to human, social and environmental value, and so helping to expand or restore these capitals.
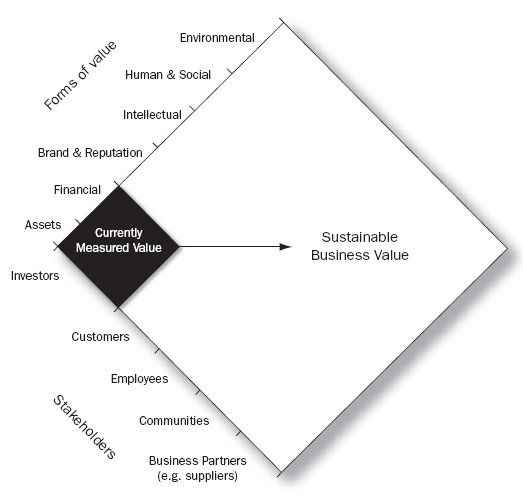
The future of ‘sustainable business value’
The steady rise of the global economy, and its attendant benefits and woes, has also spawned visions of alternative economies, many being stimulated by a much earlier vision proposed by E. F. Schumacher in his 1973 book Small is Beautiful: Economics as if People Mattered.67 Schumacher berated the materialism values of the dominant economic system and advocated a re-rationalization of resource use and diversification of regional economies, the application of intermediate (appropriate) technology, new patterns of ownership and a refocusing on the importance of local economies; all these themes still resonate today. The 1986 Towards Other Economic Systems (TOES) conference paralleled the G8 meeting of economic heads and generated a new but diverse movement of alternative economic thinking. One group, the New Economics Foundation68 in London, a ‘think-do’ tank, emerged from TOES. NEF examines economic possibilities from the point of view of social welfare and environmentalism. It has examined ideas of happiness and wealth69 and found that in Western societies life satisfaction has not increased significantly since the 1970s despite significant economic growth. NEF prefers to use the measure of domestic progress (MDP) as an indicator of economic growth. MDP is gross domestic product (GDP) minus the real (negative) costs of environmental damage and individual/social ill health associated with that economic growth. NEF feels this is a more realistic measure of economic progress and better mirrors people’s perceptions of their happiness and general satisfaction with life.
As the ‘haves’ and ‘have nots’ of the global economy have emerged, new visions and models of enterprise are attracting more attention in order to improve the positive effects of economic growth without disastrous negative consequences being felt by others. These include models with a new range of stakeholders focused on local needs and circumstances (e.g. community interest companies); enterprises with a focus on a disadvantaged or under-represented group and/or those providing social/health services (e.g. social enterprises); and a diverse range of alternative economies from non-monetary systems (such as the Local Exchange Trading System (LETS), and the gift economy) to fairer trading schemes (e.g. Fairtrade) and to innovative ‘micro-credit’ schemes for the world’s poor (such as the very successful Grameen Bank).70 These alternative models recognize those left behind, those held in wage slavery and those not benefiting from the dominant capitalist economic model.
Other Significant Issues
The United Nations Millennium Development Goals, published in 2000, set targets for basic economic and social rights.71 The base level was set at 1990 levels and minimum targets have to be reached by 2015. There are eight goals with 21 quantifiable targets that are measured by 60 indicators (see Appendix 2 for the details).
• Goal 1:Eradicate extreme poverty and hunger
• Goal 2: Achieve universal primary education
• Goal 3: Promote gender equality and empower women
• Goal 4: Reduce child mortality
• Goal 5: Improve maternal health
• Goal 6: Combat HIV/AIDS, malaria and other diseases
• Goal 7: Ensure environmental sustainability
• Goal 8: Develop a global partnership for development.
Progress is variable, but each goal encompasses a unique collection of problems, each of which becomes a design challenge.
Institutional change is happening in government, business and social sectors as legislation and regulation improves protection of the environment and encourages organizations to adopt corporate social responsibility measures. There are various portals offering an independent view of corporate progress in environmental and social issues. The European Union’s record on environmental legislation has been exemplary and there is a growing raft of Directives covering a wide range of design-related activities from packaging, recycling, electronics and electrical equipment, and a growing number of energy-using products.
Technological change is a perennial key issue for sustainability and design. The internet, ICT developments and social networking platforms are changing the way everyday communication and collaboration is happening (see Chapter 6), opening up new ways of co-designing and more open-source and participatory design practices. Other technologies important to the sustainability journey include: technologies for renewable energy sources (solar, wind, wave, geothermal, biofuel); biomimetics and bionics; light-weighting; ‘smart’ materials, e.g. shape memory alloys and polymers, ultra-strong ceramics and fibres and ‘eco’ materials, e.g. biological materials easily recycled by nature, synthetic materials containing a high recycle fraction; and nanotechnologies, e.g. coatings for self-cleaning surfaces.
Having knowledge about all the issues above equips a designer with a broader awareness of how design decisions can have a significant knock-on effect to distant ecosystems, lands and peoples. It also opens up new opportunities to focus the lens of the design activist.
Notes
1 Lynas, M. (2008) Six Degrees: Our Future on a Hotter Planet, Harper Collins, London; Henson, R. (2006) The Rough Guide to Climate Change, Rough Guides, London.
2 Lynas, M. (2005) High Tide: The Truth about our Climate Crisis, Harper Perennial, London.
3 Shiva, V. (2002) Water Wars: Privatisation, Pollution and Profit, Pluto Press, London; Pearce, F. (2006) When the Rivers Run Dry: Water – The Defining Crisis of the 21st Century, The Eden Project, London.
4 Day, K. A. (2004) China’s Environment and the Challenge of Sustainable Development, M. E. Sharpe, Armonk, NY.
5 Global Issues, www.globalissues.org/article/26/poverty-facts-and-stats
6 World Bank Development Indicators, 2008.
7 Fussler, C. with James, P. (1996) Driving Eco-innovation: A Breakthrough Discipline for Innovation and Sustainability, Pitman Publishing, London, p39.
8 Maslow, A. (1943) ‘A theory of human motivation’, Psychological Review, vol 50, pp370–396, http://psychclassics.yorku.ca/Maslow/motivation.htm, accessed September 2008; Huitt, W. (2004) ‘Maslow’s hierarchy of needs’, Educational Psychology Interactive, Valdosta State University, Valdosta, GA, http://chiron.valdosta.edu/whuitt/col/regsys/maslow.html, accessed September 2008; Max-Neef, M. A. (1991) Human Scale Development: Conception, Application and Further Reflections, Zed Books, London; Rainforest Information Centre, ‘Max-Neef on human needs and human-scale development’, www.rainforestinfo.org.au/background/maxneef.htm, accessed September 2008.
9 See for example the Millennium Ecosystem Synthesis Assessment Report, 2005; Worldwatch Institute, 2000–2009.
10 World Wide Fund for Nature (2006) The Living Planet 2006, C. Hails (ed), WWF International, Gland, Switzerland. www.panda.org/news_facts/publications/living_planet_report/index.cfm
11 United Nations (2009) ‘Stockholm 1972, Report on the United Nations Conference on the Human Environment’ www.unep.org/Documents.Multilingual/Default.asp?documentID=97, accessed January 2009.
12 Wikipedia (2008) ‘Earth Summit’, http://en.wikipedia.org/wiki/Earth_Summit
13 World Commission on Environment and Development (1987) Our Common Future, Oxford University Press, Oxford. The WCED is often referred to as the ‘Brundtland Commission’ after the head of the commission, Gro Harland Brundtland.
14 Dresner, S. (2008) The Principles of Sustainability, 2nd edn, Earthscan, London, p54.
15 Ibid. p54.
16 Ibid. p63.
17 Lynas (2008), op. cit. Note 1, p255.
18 Intergovernmental Panel on Climate Change (2007) Climate Change 2007, Cambridge University Press, Cambridge, www.ipcc.ch/
19 Lynas (2008), op. cit. Note 1.
20 See for example Lomburg, B. (2001) The Skeptical Environmentalist, Cambridge University Press, Cambridge.
21 Lynas (2008), op. cit. Note 1.
22 Wikipedia (2008) ‘Hurricane Katrina’, http://en.wikipedia.org/wiki/Hurricane_Katrina
23 Wikipedia (2008) ‘Carteret Islands’, http://en.wikipedia.org/wiki/Carteret_Islands
24 Gore, A. (2006) An Inconvenient Truth: The Planetary Emergency of Global Warming and What We Can Do About It, Bloomsbury Publishing, London.
25 Stern, N. (2006) The Economics of Climate Change: The Stern Review, Cambridge University Press, Cambridge, available from Her Majesty’s Treasury, www.hm-treasury.gov.uk/independent_reviews/sertn_review_economics_climate_change/sertn_review_report.cfm
26 Henson (2006), op. cit. Note 1, p35.
27 Lynas (2008), op. cit. Note 1, pp276–277.
28 Henson, J. (2006) The Rough Guide to Climate Change, Rough Guides, London, Table ‘Climate data: Insights and observations’, data for the year 2000 as presented in the 2004 Pew Center Report, p40.
29 FOE, www.foe.org
30 Plane Stupid, www.planestupid.com
31 The Carbon Trust, www.carbontrust.co.uk/about
32 Radford, T. (2005) ‘Two-thirds of world’s resources “used up”’, The Guardian, 30 March 2005; Millennium Ecosystem Assessment Synthesis Report, 2005.
33 McLaren, D., Bullock, S. and Yousuf, N. (1998) Tomorrow’s World: Britain’s Share in a Sustainable Future, Earthscan, London.
34 Wikipedia (2008) ‘M King Hubbert’, http://en.wikipedia.org/wiki7M._King_Hubbert
35 Heinberg, R. (2007) Peak Everything: Waking up to the Century of Decline in the Earth’s Resources, Clairview Books, Forest Row.
36 Hopkins, R. (2007) The Transition Handbook: From Oil Dependency to Local Resilience, Green Books, Dartington, Totnes.
37 Cohen, D. (2007) ‘Earth’s natural wealth: an audit’, New Scientist, issue 2605, pp34–41.
38 FAO (2006) The State of Food Insecurity in the World 2006, Food and Agriculture Organization, Rome, ftp://ftp.fao.org/docrep/fao/009/a0750e/a0750e00.pdf, retrieved September 2008; FAO (2007) The State of Food and Agriculture 2007: Paying Farmers for Environmental Services, Food and Agriculture Organization, Rome, ftp://ftp.fao.org/docrep/fao/010/a1200e/a1200e00.pdf, retrieved September 2008.
39 World Water reports, 1998–2006, www.worldwater.org/books.html
40 Gleick, P. H. (2008) Water Conflicts Chronology, Pacific Institute for Studies in Development, Environment and Security, retrieved September 2008, www.worldwater.org/conflictchronology.pdf
41 WWF (2006), op. cit. Note 10.
42 Millennium Ecosystem Synthesis Assessment Report (2005) www.millenniumassessment.org/en/Synthesis.aspx
43 Millennium Ecosystem Assessment Series (2003) Eco-systems and Human Well-being, Island Press and Millennium Ecosystem Assessment Series.
44 IUCN (2008) www.iucnredlist.org/
45 Curran, S. (1998) The Environment Handbook, The Stationery Office, London, pp5, 7.
46 Rees, W. and Wackernagel, M. (1995) Our Ecological Footprint: Reducing Human Impact on Earth, New Society Publishers, Philadelphia, PA.
47 New Economics Foundation (2006) The UK Interdependence Report, Mary Murfphy (ed), New Economics Foundation, London.
48 WWF (2006), op. cit. Note 10.
49 See the pros and cons at Wikipedia (2008) ‘Ecological footprints’, http://en.wikipedia.org/wiki/Ecological_footprints
50 Rees and Wackernagel (1995), op. cit. Note 46, for ‘ecological footprinting’ concept; McLaren et al (1998), op. cit. Note 33, for ‘environmental space’ concept.
51 See for example, McDonough, W. and Braungart, M. (2002) Cradle to Cradle: Remaking the Way We Make Things, North Point Press, New York.
52 Lewis, H. and Gertsakis, J. with Grant, T., Morelli, N. and Sweatman, A. (2001) Design + Environment: A Global Guide to Designing Greener Goods, Greenleaf Publishing, Sheffield.
53 Fuad-Luke, A. (2002, 2004) The Eco-design Handbook, Thames & Hudson, London; Datchefski, E. (2001) The Total Beauty of Sustainable Products, RotoVision, Crans-Près-Céligny, Switzerland.
54 SusProNET (2008), www.suspronet.org/, accessed September 2008.
55 Jackson, T. (ed) (2006) The Earthscan Reader in Sustainable Consumption, Earthscan, London.
56 Beukers, A. and van Hinte, E. (1999) Lightness: The Inevitable Renaissance of Minimum Energy Structures, 010 publishers, Rotterdam; see the Wuppertal Institute for more on MIPS, www.wupperinst.org/en/projects/topics_online/mips/index.html
57 Worldwatch Institute, www.worldwatch.org/taxonomy/term/44; Worldwatch Institute’s ‘State of the World’ reports, 2000–2009, www.worldwatch.org/taxonomy/term/38
58 Global Issues, www.globalissues.org/article/26/poverty-facts-and-stats, World Bank Development Indicators.
59 UN (2004) www.un.org/esa/population/publications/sixbillion/sixbilpart1.pdf; Wikipedia (2008) ‘World population’, http://en.wikipedia.org/wiki/World_Population
60 UN (2002) United Nations Population Fund, www.unfpa.org/swp/2002/english/ch1/
61 UN (2005) http://esa.un.org/migration/
62 Migration Policy Institute, world migration map, www.migrationinformation.org/datahub/wmm.cfm
63 Spangenberg, J. H. (2001) ‘Sustainable development: From catchwords to benchmarks and operational concepts’, in M. Charter and U. Tischner (eds) Sustainable Solutions: Developing Products and Services for the Future, Greenleaf Publishing, Sheffield, pp24–47.
64 Von Weizsacker, E., Lovins, A. B. and Lovins, L. H. (1998) Factor Four: Doubling Wealth, Halving Resource Use, Earthscan, London.
65 Schmidt-Bleek, F. (2000) www.factor10-institute.org/files/MIPS.pdf; Factor 10 Manifesto, www.factor10-institute.org/files/F10_Manifesto_e.pdf, accessed September 2008.
66 The Natural Step, www.naturalstep.org/com/nyStart/, and Interface Flooring, www.interfaceinc.com/getting_there/natural.html
67 Schumacher, E. F. (1973) Small is Beautiful: Economics as if People Mattered, Harper & Row, London.
68 New Economics Foundation (NEF), www.neweconomics.org
69 NEF (2007) The European (Un)Happy Planet Index, www.neweconomics.org/gen/uploads/zeyhlcuhtfw0ge55lwnloi4520082007141551.pdf; NEF (2006) The (Un)Happy Planet Index, www.neweconomics.org/gen/uploads/dl44k145g5scuy453044gqbu11072006194758.pdf
70 LETS, www.letslinkuk.net/; Fairtrade, www.fairtrade.org.uk/; Grameen Bank, www.grameen-info.org/
71 United Nations Millennium Development Goals, www.undp.org/mdg/ and the latest report (2008) www.undp.org/publications/MDG_Report_2008_En.pdf