
6
Expert Hacks to Create Your Own Professional-Looking Designs
In this chapter, we’re going to delve a little deeper into some of the features that will really help you understand how to quickly create graphics in Canva that look great, are branded, and include some great elements such as grids and frames. These are both fantastic features of Canva and ones I love to use myself.
In this chapter, we are going to cover the following main topics:
- Adding gradients to achieve depth
- Using the Quick Create feature
- Using grids for quick, effective designs
- Creating with frames
- Creating graphs for your documents
By the end of this chapter, you will be able to add gradients, grids, frames, and graphs to your designs, as well as knowing how to use the Quick Create feature to create branded graphics for multiple platforms.
Adding gradients to achieve depth
Gradients within a design can really help to make the information stand out. It gives a design that little something extra. Adding a gradient to the background will help to increase your visibility on social media channels, potentially catching someone’s eye and stopping them from scrolling on by. Adding a gradient in Canva is a really simple and quick thing to do. Let’s look at how.
First of all, we need to open up a template. It could be a blank one or an existing template that you would like to edit and use. Here, I’m going to use one I’ve created:

Figure 6.1 – Floral graphics with a block color background
The template here is perfectly fine as is. It has a plain block color for the background and pretty floral elements that match, but we can make this better by adding a gradient. To find the gradient, just type Gradient into the search bar for the elements. You will find hundreds of different styles appear, all different shapes and sizes. The one we need is further down. It’s a free element and is a square with two colors that you can change. Both are shades of blue within the original element:
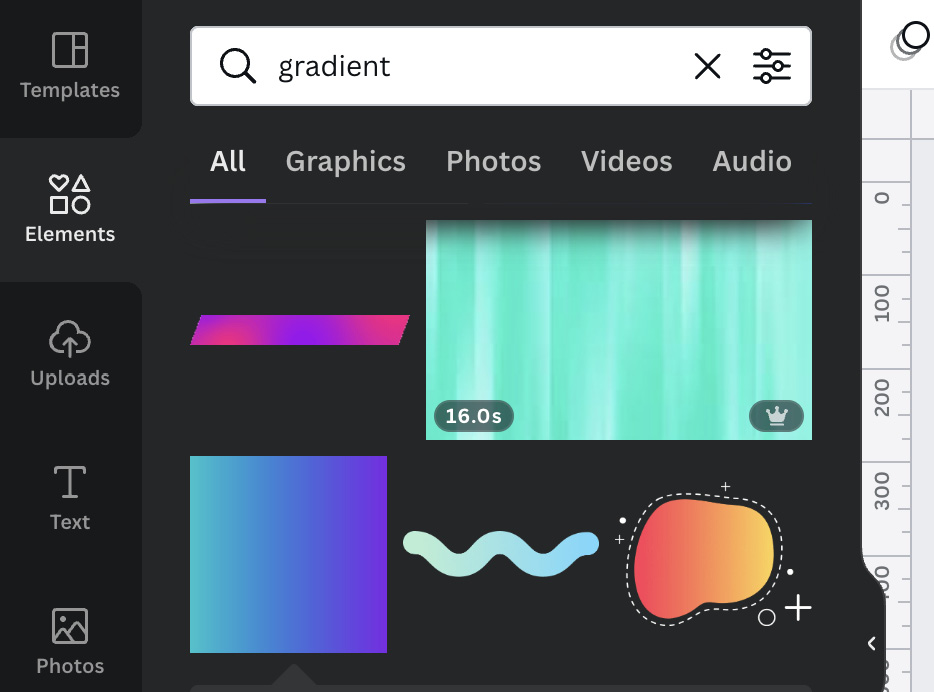
Figure 6.2 – Searching for gradients in the Elements section
Once you have selected the gradient and added it to your design, use the white circles in the corners to drag it out to cover the full size of your design:
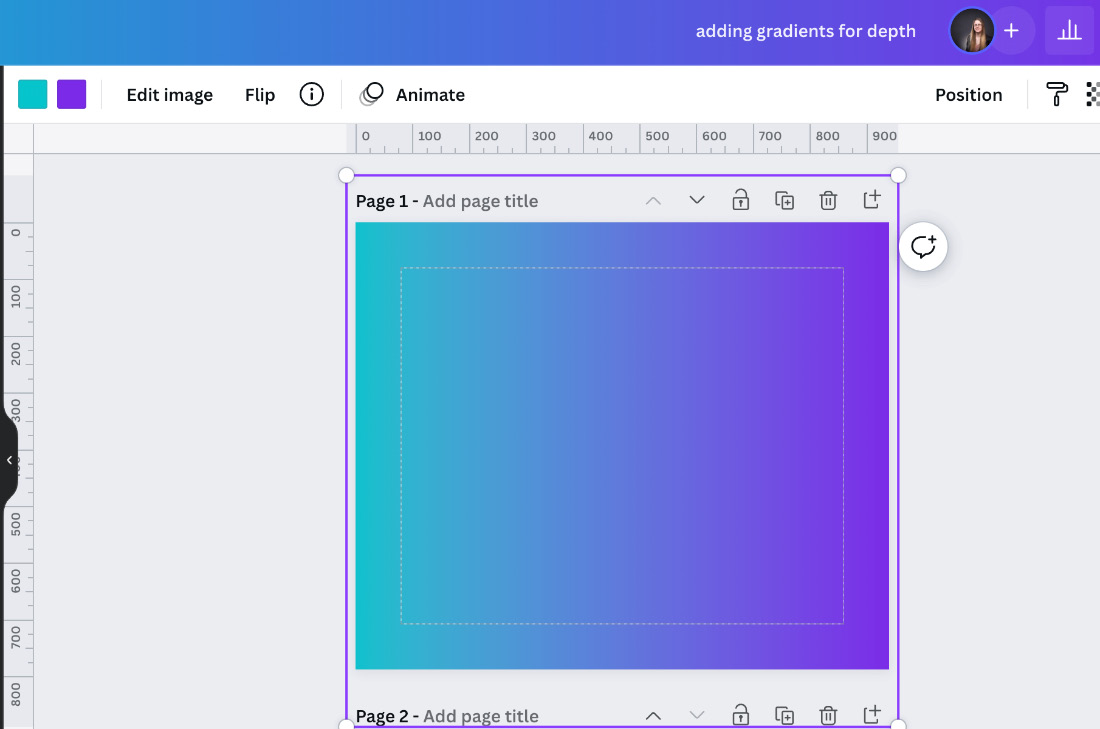
Figure 6.3 – Adding a gradient to your design
Select Position in the top-right corner and then click the Backward option in the dropdown. It will then place itself as the background to your design:
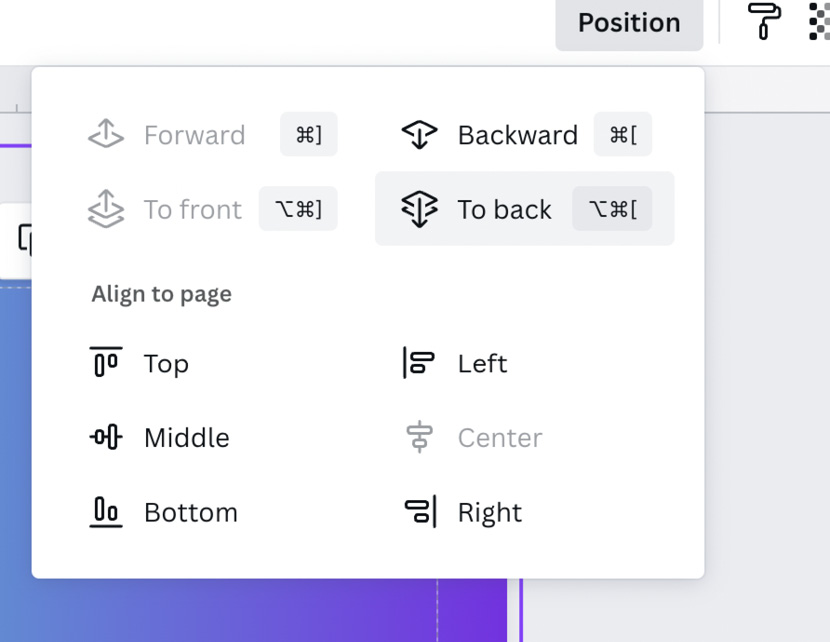
Figure 6.4 – To back option
Next, we need to change the colors, we can use our branding colors or use the colors within the design. So in this case, I will use the colors from the elements themselves. First I must select one of the two color options in the top-left corner and the color palette will open. Here, Canva has a color picker tool – the paint dropper icon shown in the following screenshot. It allows you to hover over any part of the page and select the color to use within your design:

Figure 6.5 – Changing the color of gradients
I have selected the light pink color from the petals and the green from the leaves for my two background gradient colors. Here is the finished effect:

Figure 6.6 – Finished design with gradient background
Compare this image to the original one and you can see the difference a simple background gradient can make to a design. Try adding a gradient to one of your own designs and experiment with different colors to see what you can create.
Next, we will look at another great feature of Canva, which can save you time.
Using the Quick Create feature
The Quick Create feature is a relatively new one to Canva. I’ve found it so useful for creating graphics for multiple platforms when I need something quick but I also need them to match in terms of style. So if you have a project, e-book, course, or something else you would like to promote, have a look at this feature.
To open the Quick Create feature, you need to go over to the Social media section on the Canva home page – it’s the fourth icon along:

Figure 6.7 – Canva option icons on the home page
Here you will find lots of social media templates, images, and content ideas, but we’re looking for the very first section, Quick Create Collection. Click on the image of the four pink and blue graphics and it will open up the step-by-step page to create with this feature.

Figure 6.8 – The Quick Create feature
The first thing we need to decide is which platforms we would like to create graphics for. Choose a platform by selecting the white boxes next to each one:

Figure 6.9 – Step 1 of the Quick Create feature – picking the formats
I’ve chosen, Instagram, Facebook, Twitter, Pinterest, and LinkedIn. Once you have selected your platforms, click Continue and it will take you to the next step.

Figure 6.10 – Step 2 of the Quick Create feature – adding text
On this page, you will find lots of different template styles on the right and two textboxes on the left. Add your main information to the first one and then any additional information to the second:
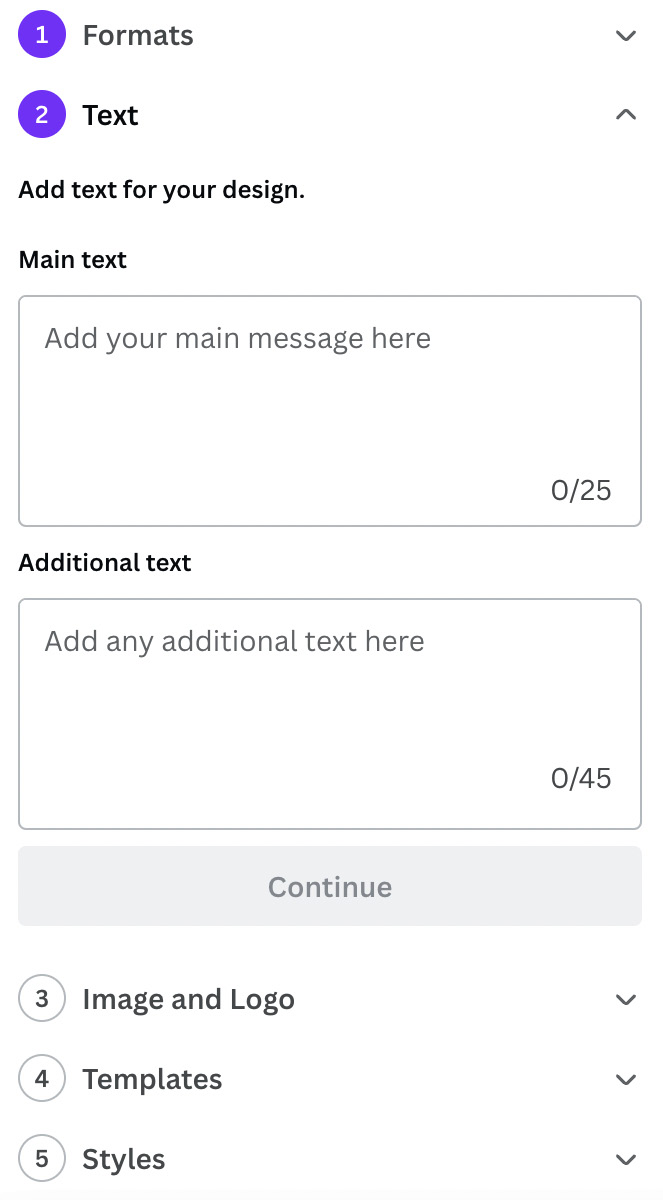
Figure 6.11 – Step 2 of the Quick Create feature
When you add in your information, it automatically shows it on the templates to the right, so you can see how it will look. Once you have finished, press Continue and it will take you to the next step.
This is where you can now add your images and logo to the design. It will bring up your uploaded file so you can select an image you already have available, or you can upload one directly. Select an image and it will populate the template for you; the same happens with your logo. Once done, press Continue:

Figure 6.12 – Step 3 of the Quick Create feature – adding images and a logo
Now it’s the fun part – selecting which template style you would like to use. Have a look through and find one that suits your project. Don’t worry about colors or fonts yet as that is the next stage.
Once you’ve selected your style and pressed Continue, it will show you each template laid out:

Figure 6.13 – Step 4 of the Quick Create feature – picking a template
You can now select your colors. You have a few choices here: you can use your branded colors or any color palettes that you have saved, and if you scroll down, Canva gives you multiple color palettes to choose from. I’ve gone with my branded colors in this example, so it matches everything else I have. Once you are happy with the colors, select the Fonts option:

Figure 6.14 – Step 5 of the Quick Create feature – styles
Canva offers multiple font choices. You can use the ones from the template, your branded fonts, or a combination of other fonts. I’ve gone for a large bold font that suits the template style. Once done, select Finish, and your templates will be created:

Figure 6.15 – Downloading your finished designs
You can now download the collection to use, or select See my collection and the templates will open within your Canva account. From here, you can make any edits to them individually if needed:

Figure 6.16 – Your designs are now saved in your Canva account
Now you have a collection of templates that you can use, but you only had to create the content once and you don’t have to then resize any of them. This is a brilliantly useful feature. Another feature that helps save time is using grids, so let’s have a look at them next.
Using grids for quick, effective designs
I love grids. For those of you that have ever been to one of my training courses or watched my tutorials, I always mention grids. They can help you to create a lovely-looking graphic in mere minutes, giving you space for your images, business name, branding, and information. So, let’s dive straight into how to add a grid to your template.
Grids can be found in the Elements section on Canva, so once you have your blank template open, head over to the Elements section and type in grids:

Figure 6.17 – Finding grids in the Elements section
You will notice that you now have a long list of straight-edged elements that include a green hill, a blue sky, and a white cloud – any element in Canva that has the white cloud, green hill, and blue sky within, can have either a color, image, or video added to it. Scroll down and select one that has a few different size squares. I’ve selected the one that has seven different sections for this example:

Figure 6.18 – Adding a grid to your design
Now, bring in the corners using the white circles to give your grid a border, and start dragging and dropping in your images. These can be from the Uploads section or the Canva image library. I’ve added some autumn shopping-based images to create a sales post:
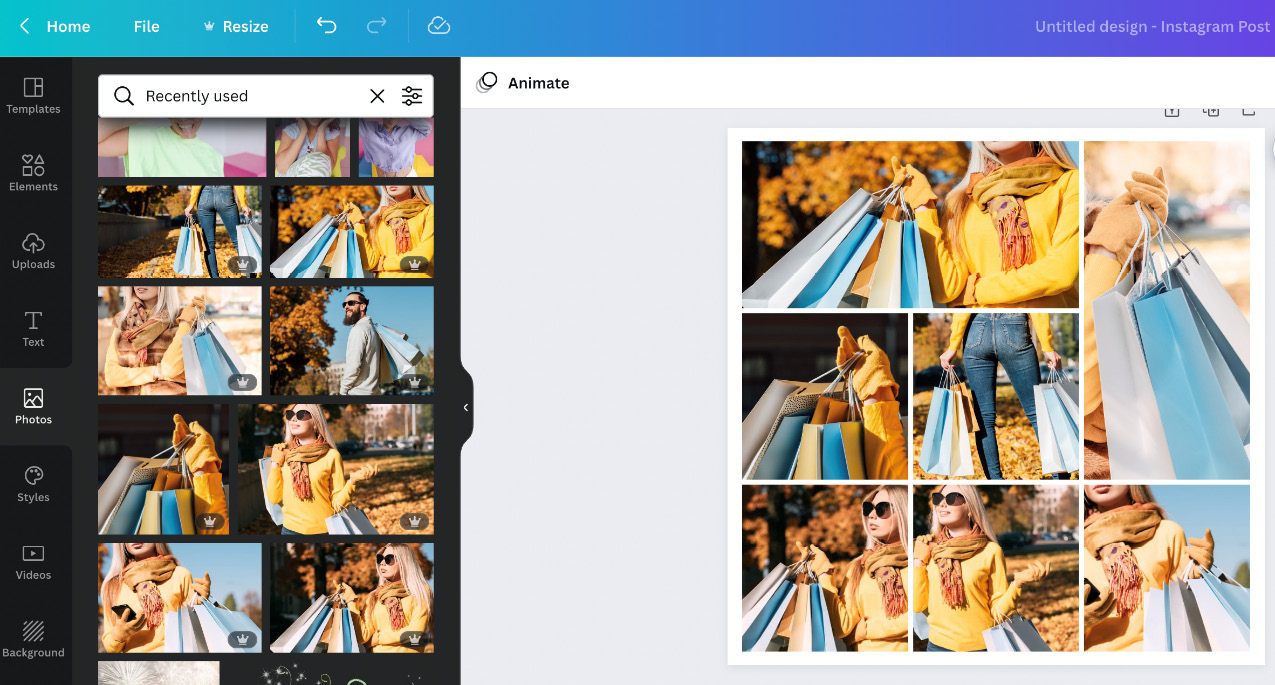
Figure 6.19 – Adding images to your grid
After filling your grid with images, you may like to add some information, perhaps a business name, logo, or sale location. Select the central image and hit Delete, then go to the color palette and change the square to the same color as the background.
This has created a lovely space to now add any extra information:
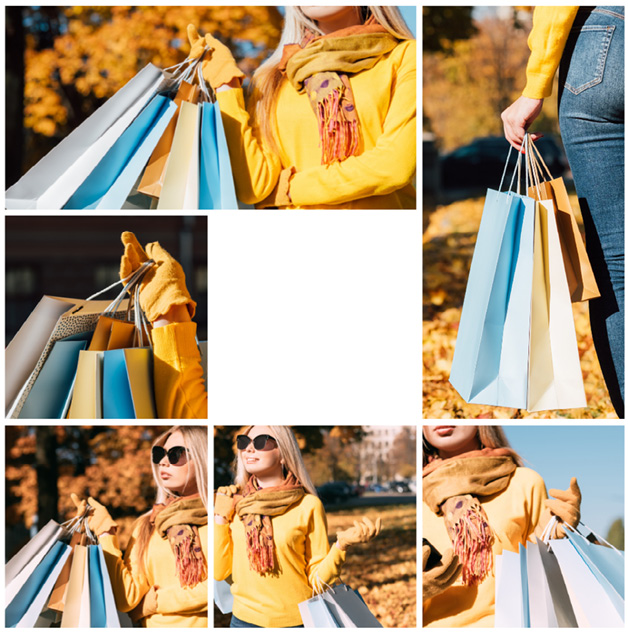
Figure 6.20 – Finished design with space for information
In this example, I have added three textboxes and a leaf icon to the central box, keeping within the space. This is my finished design:

Figure 6.21 – Finished design
With just a few clicks, you have a great image that you can now use on your social media profile. In this example, I now have an image to promote my autumn sale, created using a grid and textboxes.
Let’s look at creating a graphic using frames next – a very similar process to grids but a bit more fun.
Creating with frames
Frames are similar to grids in that you can add an image, color, or video to them, but they are different shapes rather than just square. These can be great to create fun graphics. They can be found in the same place as grids, but you can use the frames keyword instead.
I’ve added a scribble-style frame as the basis of my design example:
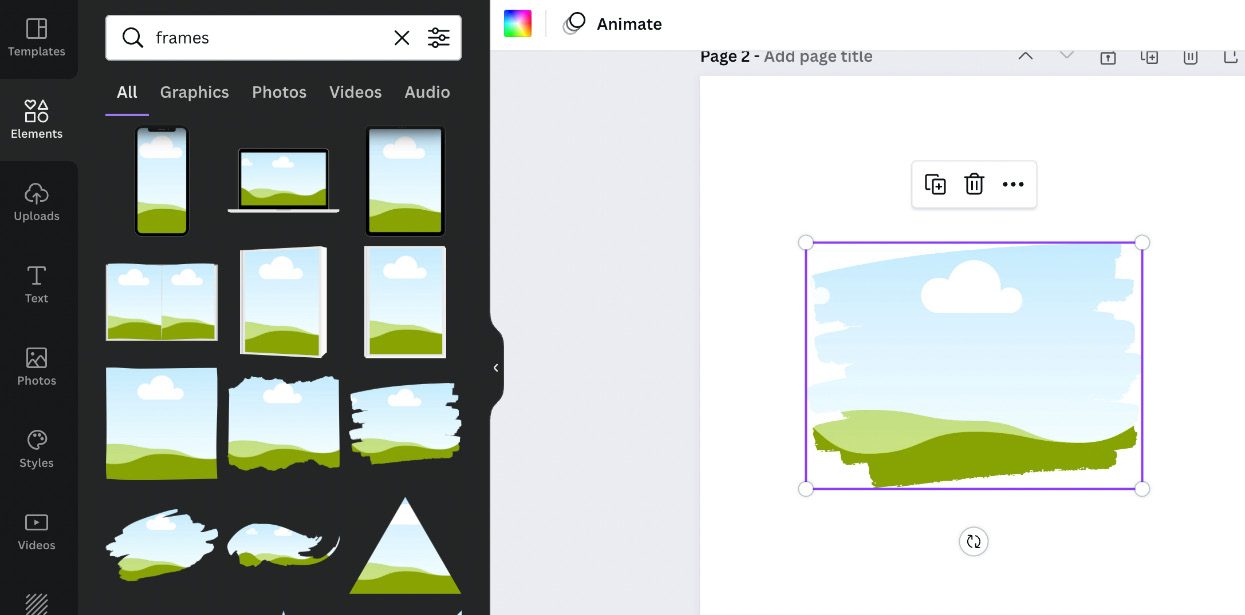
Figure 6.22 – Adding frames to templates
I will be creating a video blog-based template for this example, but you can create any style of your choice. Add a flat lay image, which is a photo taken from directly above, this could be of a notebook, pens, and a tablet arranged on a desk in a pleasing way. These can be found in the Photos section of Canva. Also, add a textbox at the top. At the bottom, add a square shape that can be stretched across the template. Then, add another template box for your information and website details at the bottom:

Figure 6.23 – Nearly complete frame-based design
You’re beginning to build up a usable design for your business, but it feels like there is something missing from this design. As we now know, we can add colors to grids. We can also do the same with frames, so duplicate the frame and select the color option. Then, change the frame to a color that matches your design:

Figure 6.24 – Changing a frame’s color
Lastly, use the Position option to send the colored frame to the back, giving the frame with the image in place a background shadow. Now, the design looks finished:

Figure 6.25 – The finished design
This is the finished design. You can see the effect the frame shape with the image has, as well as the effect of the background color and shape on the overall design. It stands out so much more than a plain square or oblong image would.
Frames and grids are great for creating quick social media graphics, but sometimes we want to add in a bit more information. This can be done using graphs in Canva, so let’s look at how we can add these in next.
Creating graphs for your documents
Graphs can be used for a variety of graphics, including calendars, planner pages, and infographics, so knowing how to add a graph to your design will allow you to offer more information in a well-presented way.
Graphs and tables are both found in the Elements section. Type in graph and you will see lots of different styles.
Graphs
Let’s select one of these graphs. Canva will give you different options to help you edit your chosen graph :
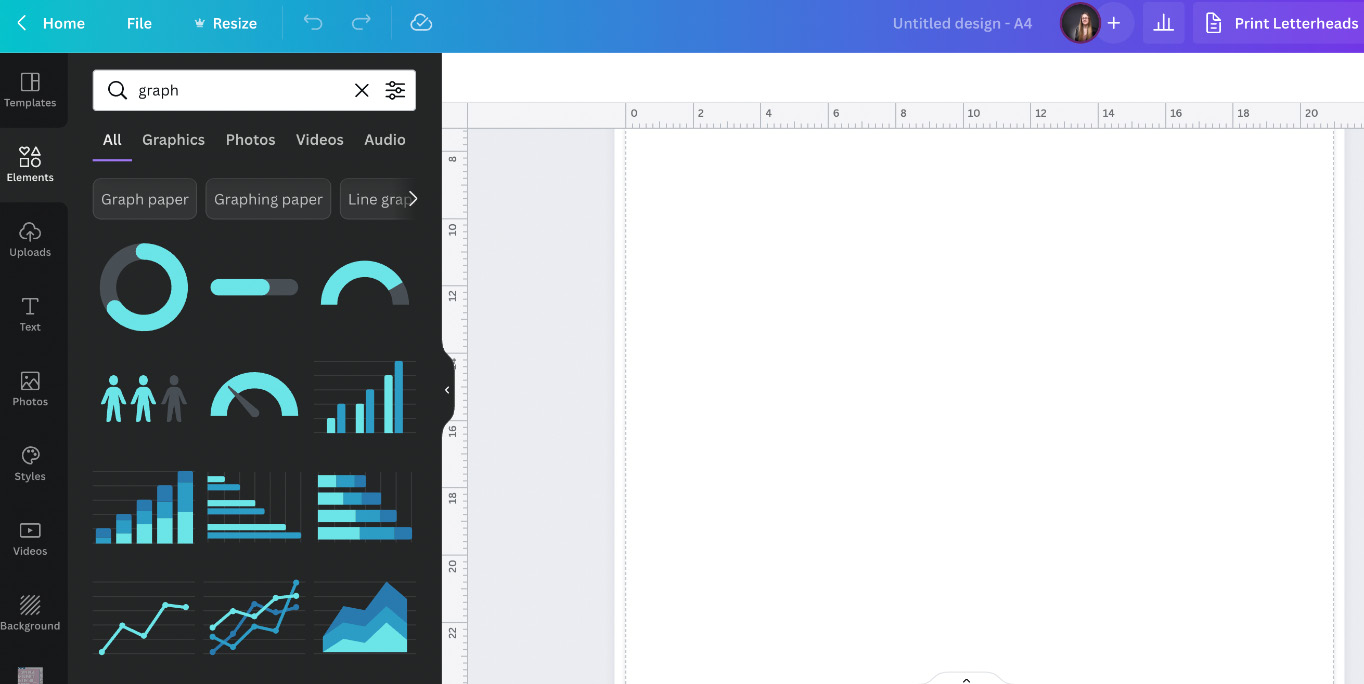
Figure 6.26 – Finding graphs in Canva
The simplest graph is the Progress ring graph. On the left, you have two slide bars: Percentage, which moves the blue ring around, and Line weight, which changes the thickness of the ring. You also have the option to add the percentage number to the middle of the graph and change the roundness of the endpoints:
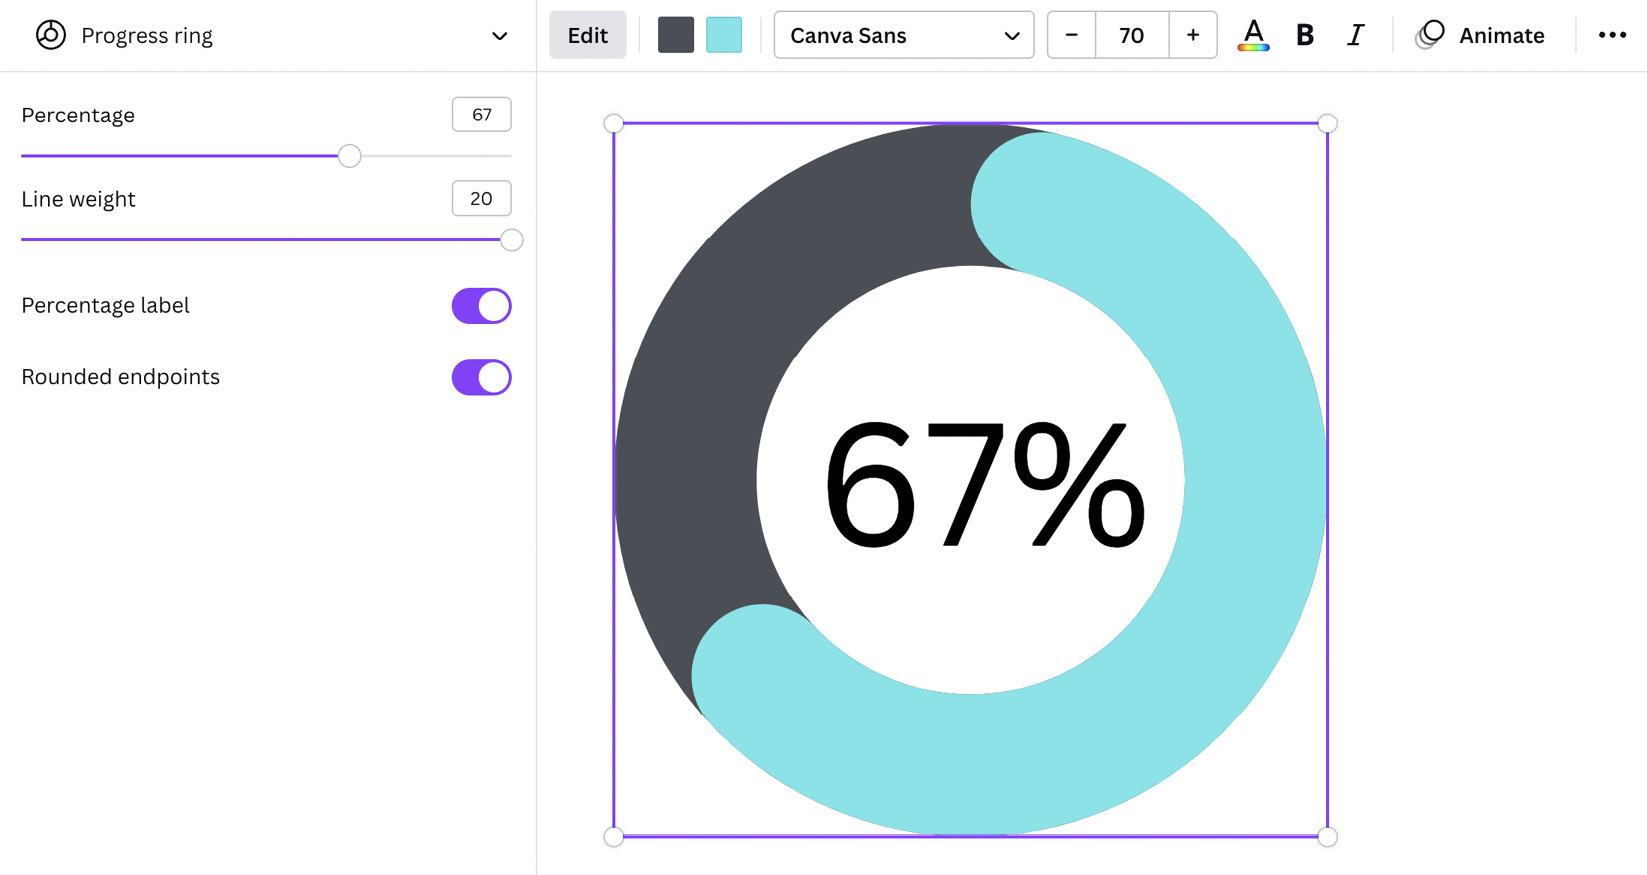
Figure 6.27 – Editing a basic graph
If you’re looking for a graph with a lot more detail and different options that you can add yourself, select the Stacked bar chart option or a similar graph. This gives you the option to upload your own CSV file of information or you can manually type it into the boxes on the left. As you do so, the graph on your design will start to change:
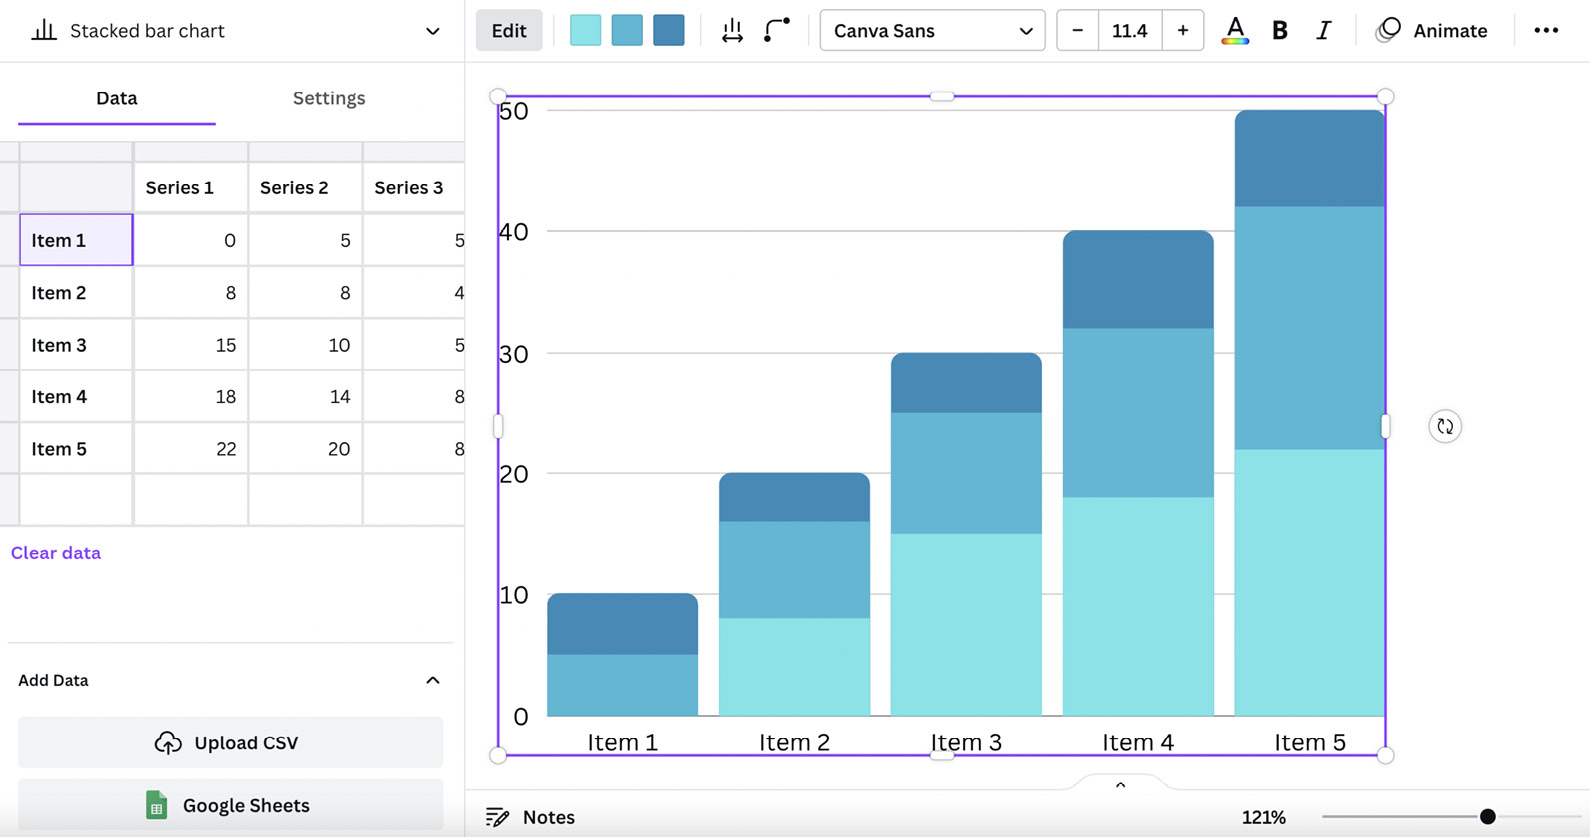
Figure 6.28 – Adding and editing a stacked bar chart
Click on the Settings tab, and you have a few more options to customize your graph:

Figure 6.29 – Stacked bar chart settings
There are several types of graphs you can add to your design: progress rings, bar charts, pie charts, and line graphs, to name a few. All of these have the option to add information and customize the graph for your own uses:
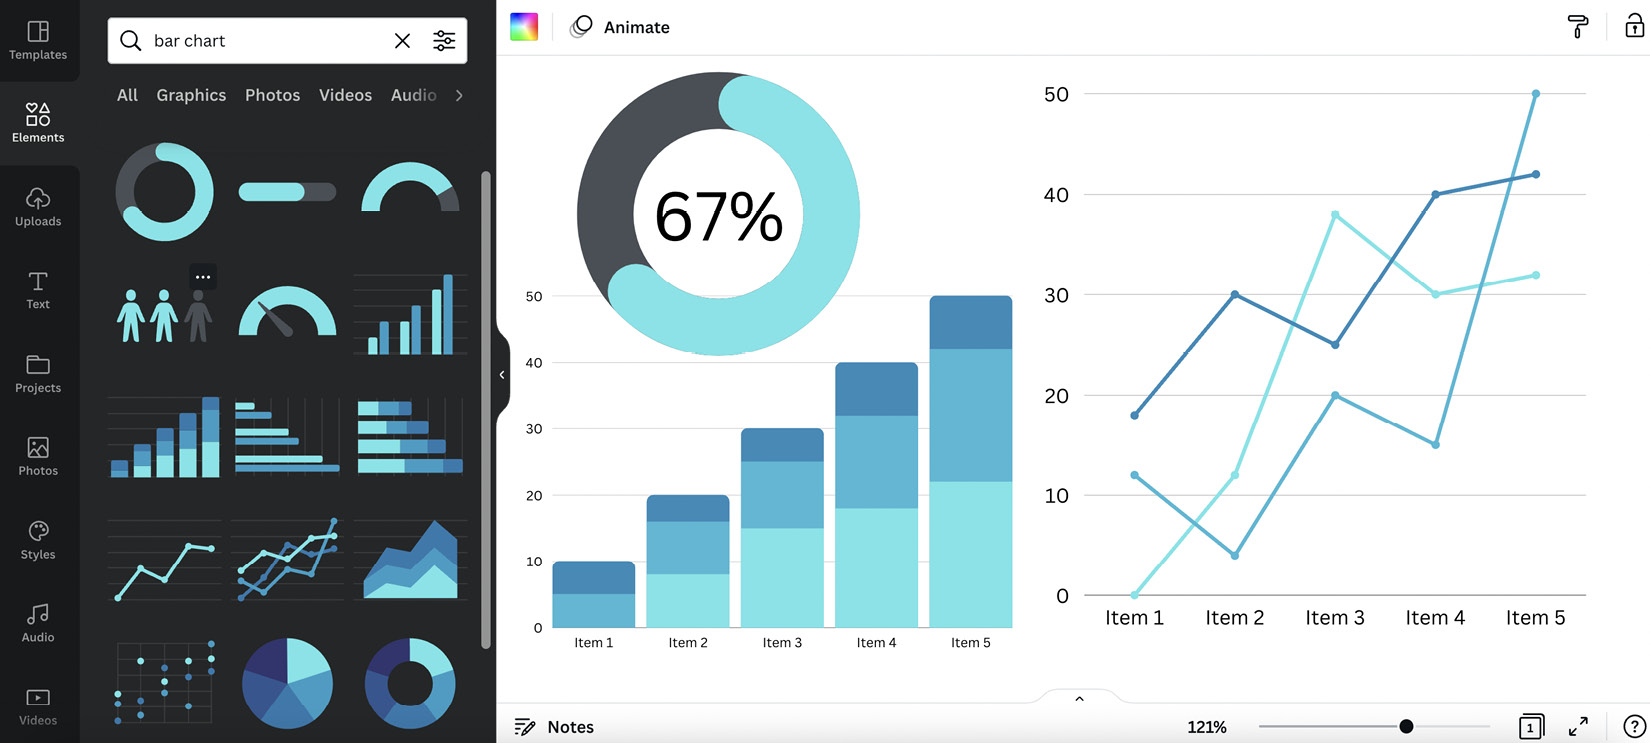
Figure 6.30 – Selection of graphs
Graphs are perfect for visually getting across information, helping to keep a hold of someone’s attention, rather than just offering plain text. In the next part of this section, we will be looking at tables.
Tables
Tables are ideal for creating designs such as planners, calendars, leaflets, and brochures, as you can create squares for your information with the click of a button.
There are several styles of tables available, some with colored lines, others with blocks of color, and some with more prominent headers. Let’s look at a couple of examples:
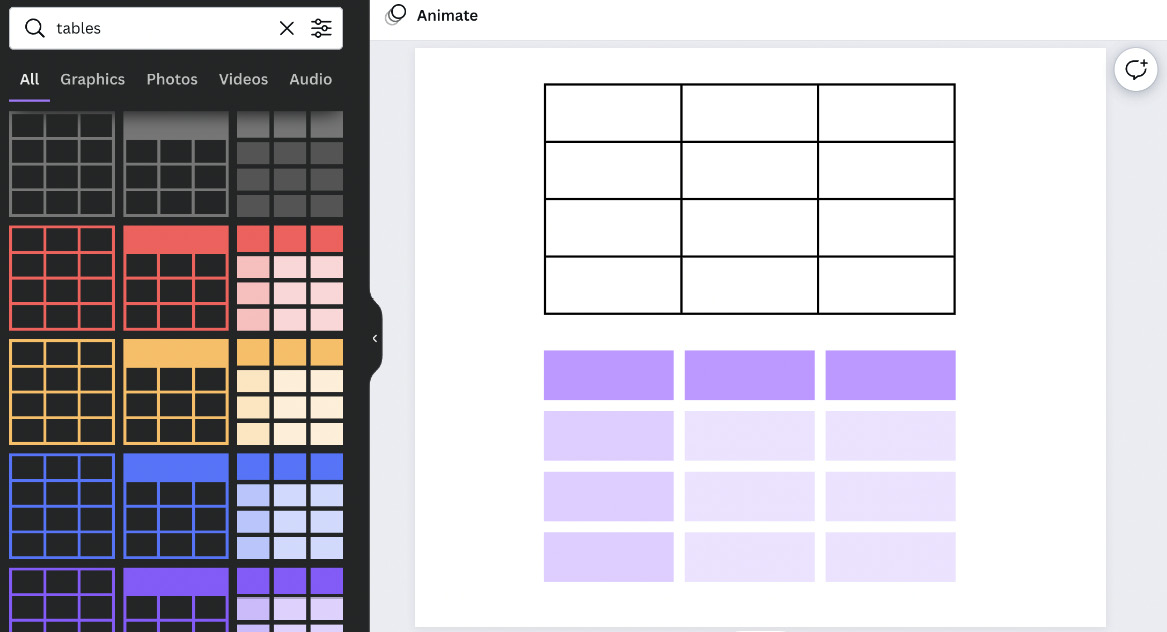
Figure 6.31 – Finding tables in Canva
Each table gives you a selection of options to help you to edit it. You can add or remove columns and rows by selecting your table and then pressing the three-dot icon that appears, either on the left for rows or at the top of the table for columns. This will present you with a list of additional options, including moving your rows and columns up and down and sizing them equally:

Figure 6.32 – Options for tables
Once you have the correct number of rows and columns, you will want to add information to your table. To do this, click on the square you wish to edit and start typing. You can also change the color of the individual squares, by selecting your chosen square and then clicking the color block at the top:

Figure 6.33 – Block table with text and color
Along the top bar, you have a couple of additional options to edit the space between your column and row cells, and to edit the space in the cell:

Figure 6.34 – Table spacing and Cell spacing options
Lastly, there is also the option to change the color, thickness, and style of the lines:
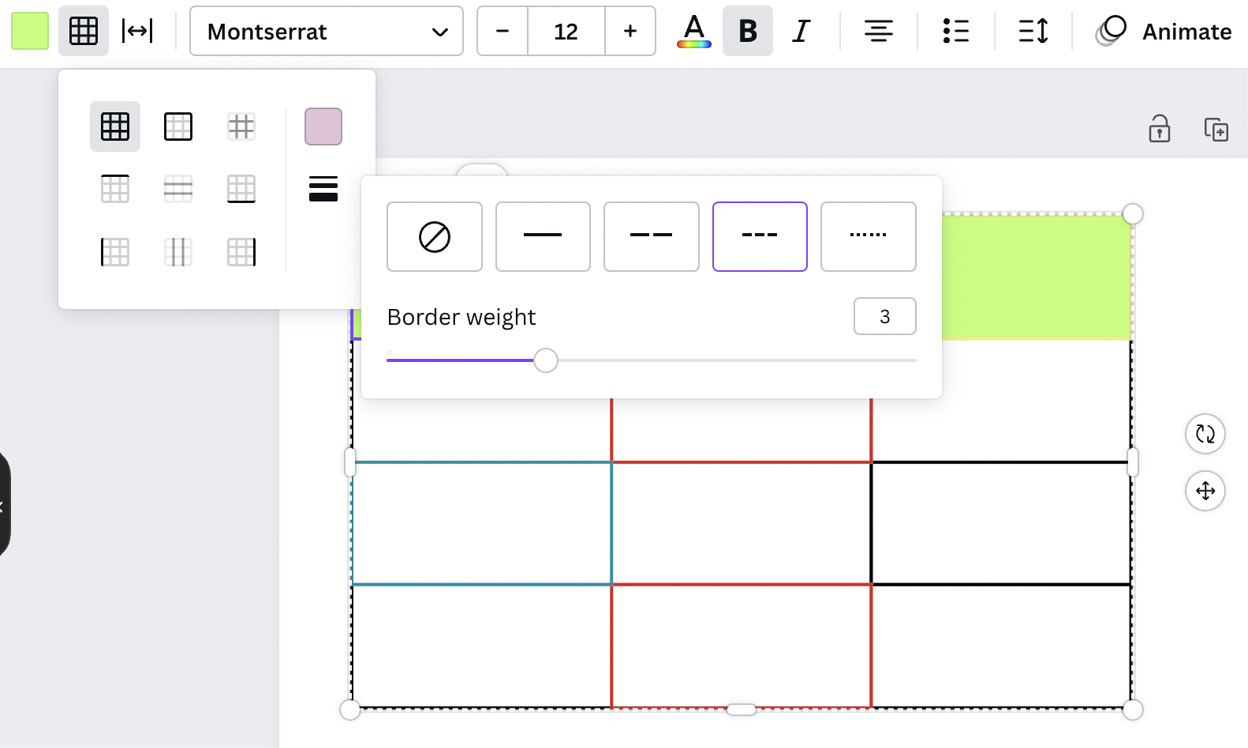
Figure 6.35 – Changing the color, thickness, and style of table lines
Tables and graphs are great features to have a play with, especially if you have a lot of information to present. I love that you can change so much about tables. They’re not plain and boring; they are vibrant and fun, making our designs so much better.
We’ve now come to the end, so let’s take a look at what we’ve learned in this chapter packed full of useful features to help you quickly create great graphics.
Summary
In this chapter, you’ve looked at a lot of different features – ones that can save you time but also help generate great graphics. The introductions to these features were more like tutorials, as each one you could follow along with. Looking back at this chapter, you have learned how to create and add a gradient as a background to your design, bringing out the information. You’ve also discovered and learned how to use the Quick Create feature, generating multiple graphics for different platforms at the same time. You can now add in grids and frames, and also add color, images, or video. You’ve even learned how to add and create a graph for your information-based social media posts. That’s an amazing amount of information so far!
However, none of this is going to produce fantastic graphics without you being able to understand the basic design principles and knowing how a design works, so in the next chapter, this is exactly what we are going to look at.