
Activity diagrams are one of the five diagrams in the UML for modeling the dynamic aspects of systems. An activity diagram is essentially a flowchart, showing flow of control from activity to activity. Unlike a traditional flowchart, an activity diagram shows concurrency as well as branches of control.
You use activity diagrams to model the dynamic aspects of a system. For the most part, this involves modeling the sequential (and possibly concurrent) steps in a computational process. With an activity diagram, you can also model the flow of values among steps. Activity diagrams may stand alone to visualize, specify, construct, and document the dynamics of a society of objects, or they may be used to model the flow of control of an operation. Whereas interaction diagrams emphasize the flow of control from object to object, activity diagrams emphasize the flow of control from step to step. An activity is an ongoing structured execution of a behavior. The execution of an activity ultimately expands into the execution of individual actions, each of which may change the state of the system or communicate messages.
Activity diagrams are not only important for modeling the dynamic aspects of a system, but also for constructing executable systems through forward and reverse engineering.
Consider the workflow associated with building a house. First, you select a site. Next, you commission an architect to design your house. After you've settled on the plan, your developer asks for bids to price the house. Once you agree on a price and a plan, construction can begin. Permits are secured, ground is broken, the foundation is poured, the framing is erected, and so on, until everything is done. You're then handed the keys and a certificate of occupancy, and you take possession of the house.
Although that's a tremendous simplification of what really goes on in a construction process, it does capture the critical path of the workflow. In a real project, there are lots of parallel activities among various trades. Electricians can be working at the same time as plumbers and carpenters, for example. You'll also encounter conditions and branches. For example, depending on the result of soils tests, you might have to blast, dig, or float. There might even be iterations. For example, a building inspection might reveal code violations that result in scrap and rework.
In the construction industry, such techniques as Gantt charts and Pert charts are commonly used for visualizing, specifying, constructing, and documenting the workflow of the project.
In modeling software-intensive systems, you have a similar problem. How do you best model a workflow or an operation, both of which are aspects of the system's dynamics? The answer is that you have two basic choices, similar to the use of Gantt charts and Pert charts.
On the one hand, you can build up storyboards of scenarios, involving the interaction of certain interesting objects and the messages that may be dispatched among them. In the UML, you can model these storyboards in two ways: by emphasizing the time ordering of messages (using sequence diagrams) or by emphasizing the structural relationships among the objects that interact (using collaboration diagrams). Interaction diagrams such as these are akin to Gantt charts, which focus on the objects (resources) that carry out some activity over time.
On the other hand, you can model these dynamic aspects using activity diagrams, which focus first on the activities that take place among objects, as Figure 20-1 shows. In that regard, activity diagrams are akin to Pert charts. An activity diagram is essentially a flowchart that emphasizes the activity that takes place over time. You can think of an activity diagram as an interaction diagram turned inside out. An interaction diagram looks at the objects that pass messages; an activity diagram looks at the operations that are passed among objects. The semantic difference is subtle, but it results in a very different way of looking at the world.

An activity diagram shows the flow from activity to activity. An activity is an ongoing nonatomic execution within a state machine. The execution of an activity ultimately expands into the execution of individual actions, each of which may change the state of the system or communicate messages. Actions encompass calling another operation, sending a signal, creating or destroying an object, or some pure computation such as evaluating an expression. Graphically, an activity diagram is a collection of nodes and arcs.
An activity diagram is a kind of diagram and shares the same common properties as do all other diagrams—a name and graphical contents that are a projection into a model. What distinguishes an interaction diagram from other kinds of diagrams is its content.
Activity diagrams commonly contain
Like all other diagrams, activity diagrams may contain notes and constraints.
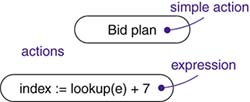
In the flow of control modeled by an activity diagram, things happen. You might evaluate some expression that sets the value of an attribute or that returns some value. Alternately, you might call an operation on an object, send a signal to an object, or even create or destroy an object. These executable, atomic computations are called actions. As Figure 20-2 shows, you represent an action using a rounded box. Inside that shape, you may write an expression.
Note
The UML does not prescribe the language of these expressions. Abstractly, you might just use structured text; more concretely, you might use the syntax and semantics of a specific programming language.
Actions can't be decomposed. Furthermore, actions are atomic, meaning that events may occur, but the internal behavior of the action state is not visible. You can't execute part of an action; either it executes completely or not at all. Finally, the work of an action state is often considered to take insignificant execution time, but some actions may have substantial duration.
Note
In the real world, of course, every computation takes some amount of time and space. Especially for hard real time systems, it's important that you model these properties.
An activity node is an organizational unit within an activity. In general, activity nodes are nested groupings of actions or other nested activity nodes. Furthermore, activity nodes have visible substructure; in general, they are considered to take some duration to complete. You can think of an action as a special case of an activity node. An action is an activity node that cannot be further decomposed. Similarly, you can think of an activity node as a composite whose flow of control is made up of other activity nodes and actions. Zoom into the details of an activity node and you'll find another activity diagram. As Figure 20-3 shows, there's no notational distinction between actions and activity nodes, except that an activity node may have additional parts, which will usually be maintained in the background by an editing tool.
When an action or activity node completes execution, flow of control passes immediately to the next action or activity node. You specify this flow by using flow arrows to show the path of control from one action or activity node to the next action or activity node. In the UML, you represent a flow as a simple arrow from the predecessor action to its successor, without an event label, as Figure 20-4 shows.
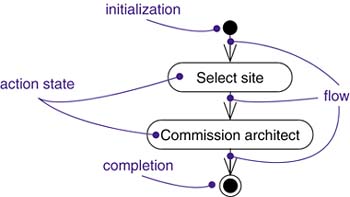
Indeed, a flow of control has to start and end someplace (unless, of course, it's an infinite flow, in which case it will have a beginning but no end). Therefore, as the figure shows, you may specify initialization (a solid ball) and completion (a solid ball inside a circle) as special symbols.
Simple, sequential flows are common, but they aren't the only kind of path you'll need to model a flow of control. As in a flowchart, you can include a branch, which specifies alternate paths taken based on some Boolean expression. As Figure 20-5 shows, you represent a branch as a diamond. A branch may have one incoming and two or more outgoing flows. On each outgoing flow, you place a Boolean expression, which is evaluated on entering the branch. The guards on the outgoing flows should not overlap (otherwise, the flow of control would be ambiguous), but they should cover all possibilities (otherwise, the flow of control would freeze).

As a convenience, you can use the keyword else to mark one outgoing transition, representing the path taken if no other guard expression evaluates to true.
When two paths of control merge back together, you can also use a diamond symbol with two input arrows and one output arrow. No guards are necessary on merge.
You can achieve the effect of iteration by using one action that sets the value of an iterator, another action that increments the iterator, and a branch that evaluates if the iteration is finished. The UML includes node types for loops, but these may often be expressed more easily in text than in graphics.
Simple and branching sequential transitions are the most common paths you'll find in activity diagrams. However—especially when you are modeling workflows of business processes—you might encounter flows that are concurrent. In the UML, you use a synchronization bar to specify the forking and joining of these parallel flows of control. A synchronization bar is rendered as a thick horizontal or vertical line.
For example, consider the concurrent flows involved in controlling an audio-animatronic device that mimics human speech and gestures. As Figure 20-6 shows, a fork represents the splitting of a single flow of control into two or more concurrent flows of control. A fork may have one incoming transition and two or more outgoing transitions, each of which represents an independent flow of control. Below the fork, the activities associated with each of these paths continues in parallel. Conceptually, the activities of each of these flows are truly parallel, although, in a running system, these flows may be either truly concurrent (in the case of a system deployed across multiple nodes) or sequential yet interleaved (in the case of a system deployed across one node), thus giving only the illusion of true concurrency.

As the figure also shows, a join represents the synchronization of two or more concurrent flows of control. A join may have two or more incoming transitions and one outgoing transition. Above the join, the activities associated with each of these paths continues in parallel. At the join, the concurrent flows synchronize, meaning that each waits until all incoming flows have reached the join, at which point one flow of control continues on below the join.
Note
Joins and forks should balance, meaning that the number of flows that leave a fork should match the number of flows that enter its corresponding join. Also, activities that are in parallel flows of control may communicate with one another by sending signals. This style of communicating sequential processes is called a coroutine. Most of the time you model this style of communication using active objects.
You'll find it useful, especially when you are modeling workflows of business processes, to partition the activity states on an activity diagram into groups, each group representing the business organization responsible for those activities. In the UML, each group is called a swimlane because, visually, each group is divided from its neighbor by a vertical solid line, as shown in Figure 20-7. A swimlane specifies a set of activities that share some organizational property.

Each swimlane has a name unique within its diagram. A swimlane really has no deep semantics, except that it may represent some real-world entity, such as an organizational unit of a company. Each swimlane represents a high-level responsibility for part of the overall activity of an activity diagram, and each swimlane may eventually be implemented by one or more classes. In an activity diagram partitioned into swimlanes, every activity belongs to exactly one swimlane, but transitions may cross lanes.
Note
There's a loose connection between swimlanes and concurrent flows of control. Conceptually, the activities of each swimlane are generally—but not always—considered separate from the activities of neighboring swimlanes. That makes sense because, in the real world, the business organizations that generally map to these swimlanes are independent and concurrent.
Objects may be involved in the flow of control associated with an activity diagram. For example, in the workflow of processing an order as in the previous figure, the vocabulary of your problem space will also include such classes as Order and Bill. Instances of these two classes will be produced by certain activities (Process order will create an Order object, for example); other activities may use or modify these objects (for example, Ship order will change the state of the Order object to filled).
As Figure 20-8 shows, you can specify the things that are involved in an activity diagram by placing these objects in the diagram, connected by arrows to the actions that produce or consume them.
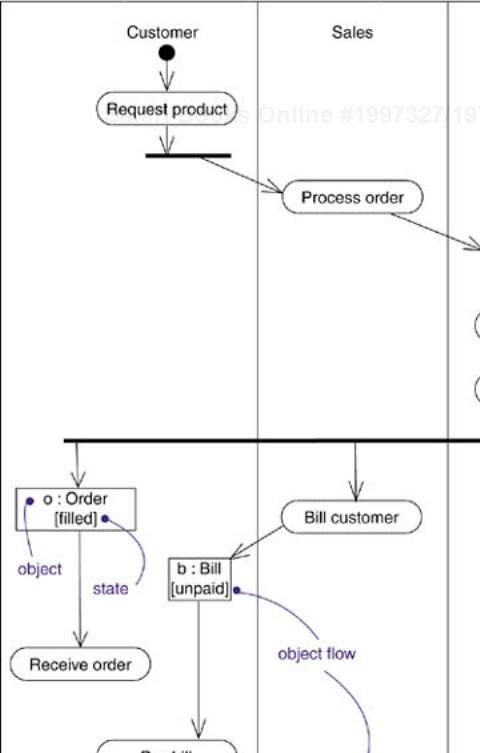
This called an object flow because it represents the flow of an object value from one action to another. An object flow inherently implies control flow (you can't execute an action that requires a value without the value!), so it is unnecessary to draw a control flow between actions connected by object flows.
In addition to showing the flow of an object through an activity diagram, you can also show how its state changes. As shown in the figure, you represent the state of an object by naming its state in brackets below the object's name.
Often the same operation must be performed on the elements of a set. For example, if an order comprises a set of line items, the order handler must perform the same operation for each line item: check availability, look up the cost, check if this kind of item is taxable, and so on. Operations on lists are often modeled as loops, but then the modeler must iterate over the items, extract them one at a time, perform the operation, assemble the results into an output array, increment the index, and check for completion. The mechanics of executing the loop obscure the actual significance of the operation. This extremely common pattern can be modeled directly using an expansion region.
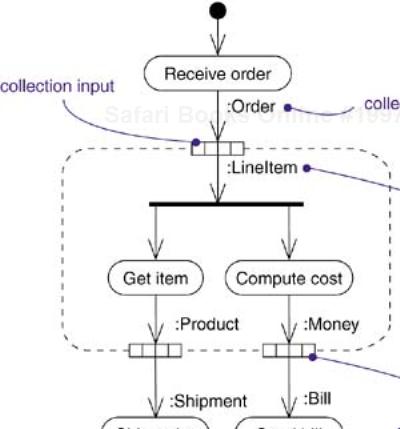
An expansion region represents a activity model fragment that is performed on the elements of a list or set. It is shown in an activity diagram by drawing a dashed line around a region in the diagram. The inputs to the region and the outputs from the region are collections of values, such as the line items in an order. Collection inputs and outputs are shown as a row of small squares joined together (to suggest an array of values). When an array value arrives at a collection input on an expansion region from the rest of the activity model, it is broken apart into the individual values. The execution region is executed once for each element in the array. It is unnecessary to model the iteration; it is implicit in the expansion region. The different executions can be performed concurrently, if possible. When each execution of the expansion region completes, its output value (if any) is placed into an output array in the same order as the corresponding input. In other words, an expansion region performs a “forall” operation on the elements of an array to create a new array.
In the simplest case, an expansion region has one array input and one array output, but it can have one or more input array and zero or more output arrays. All of the arrays must be the same size, but they need not contain the same type of value. Values from corresponding positions execute together to produce output values at the same position. The region could have zero outputs if all the operations are performed as side effects directly on array elements.
Expansion regions allow operations on collections and operations on individual elements of the collections to be shown on the same diagram, without the need to show all of the detailed but straightforward iteration machinery.
Figure 20-9 shows an example of an expansion region. In the main body of the diagram, an order is received. This produces a value of type Order, which consists of an array of LineItem values. The Order value is the input to an expansion region. Each execution of the expansion region works on one element from the Order collection. Therefore, inside the region the type of input value corresponds to one element of the Order array, namely a LineItem. The expansion region activity forks into two actions: one action finds the Product and adds it to the shipment, and the other action computes the cost of that item. It is not necessary that the LineItems be taken in order; the different executions of the expansion region can proceed concurrently. When all executions of the expansion region are complete, the Items are formed into a Shipment (a collection of Products) and the charges are formed into a Bill (a collection of Money values). The Shipment value is the input to the ShipOrder action and the Bill value is the input to the SendBill action.
You use activity diagrams to model the dynamic aspects of a system. These dynamic aspects may involve the activity of any kind of abstraction in any view of a system's architecture, including classes (which includes active classes), interfaces, components, and nodes.
When you use an activity diagram to model some dynamic aspect of a system, you can do so in the context of virtually any modeling element. Typically, however, you'll use activity diagrams in the context of the system as a whole, a subsystem, an operation, or a class. You can also attach activity diagrams to use cases (to model a scenario) and to collaborations (to model the dynamic aspects of a society of objects).
When you model the dynamic aspects of a system, you'll typically use activity diagrams in two ways.
Here you'll focus on activities as viewed by the actors that collaborate with the system. Workflows often lie on the fringe of software-intensive systems and are used to visualize, specify, construct, and document business processes that involve the system you are developing. In this use of activity diagrams, modeling object flow is particularly important.
Here you'll use activity diagrams as flowcharts to model the details of a computation. In this use of activity diagrams, the modeling of branch, fork, and join states is particularly important. The context of an activity diagram used in this way involves the parameters of the operation and its local objects.
No software-intensive system exists in isolation; there's always some context in which a system lives, and that context always encompasses actors that interact with the system. Especially for mission-critical enterprise software, you'll find automated systems working in the context of higher-level business processes. These business processes are kinds of workflows because they represent the flow of work and objects through the business. For example, in a retail business, you'll have some automated systems (for example, point-of-sale systems that interact with marketing and warehouse systems), as well as human systems (the people that work at each retail outlet, as well as the telesales, marketing, buying, and shipping departments). You can model the business processes for the way these various automated and human systems collaborate by using activity diagrams.
Establish a focus for the workflow. For nontrivial systems, it's impossible to show all interesting workflows in one diagram.
Select the business objects that have the high-level responsibilities for parts of the overall workflow. These may be real things from the vocabulary of the system, or they may be more abstract. In either case, create a swimlane for each important business object or organization.
Identify the preconditions of the workflow's initial state and the postconditions of the workflow's final state. This is important in helping you model the boundaries of the workflow.
Beginning at the workflow's initial state, specify the actions that take place over time and render them in the activity diagram.
For complicated actions or for sets of actions that appear multiple times, collapse these into calls to a separate activity diagram.
Render the flows that connect these actions and activity nodes. Start with the sequential flows in the workflow first, next consider branching, and only then consider forking and joining.
If there are important object values that are involved in the workflow, render them in the activity diagram as well. Show their changing values and state as necessary to communicate the intent of the object flow.
For example, Figure 20-10 shows an activity diagram for a retail business, which specifies the workflow involved when a customer returns an item from a mail order. Work starts with the Customer action Request return and then flows through Telesales (Get return number), back to the Customer (Ship item), then to the Warehouse (Receive item then Restock item), finally ending in Accounting (Credit account). As the diagram indicates, one significant object (an instance of Item) also flows the process, changing from the returned to the available state.
Note
Workflows are most often business processes, but not always. For example, you can also use activity diagrams to specify software development processes, such as your process for configuration management. Furthermore, you can use activity diagrams to model nonsoftware systems, such as the flow of patients through a healthcare system.
In this example, there are no branches, forks, or joins. You'll encounter these features in more complex workflows.
An activity diagram can be attached to any modeling element for the purpose of visualizing, specifying, constructing, and documenting that element's behavior. You can attach activity diagrams to classes, interfaces, components, nodes, use cases, and collaborations. The most common element to which you'll attach an activity diagram is an operation.
Used in this manner, an activity diagram is simply a flowchart of an operation's actions. An activity diagram's primary advantage is that all the elements in the diagram are semantically tied to a rich underlying model. For example, any other operation or signal that an action state references can be type-checked against the class of the target object.
To model an operation,
Collect the abstractions that are involved in this operation. This includes the operation's parameters (including its return type, if any), the attributes of the enclosing class, and certain neighboring classes.
Identify the preconditions at the operation's initial state and the postconditions at the operation's final state. Also identify any invariants of the enclosing class that must hold during the execution of the operation.
Beginning at the operation's initial state, specify the activities and actions that take place over time and render them in the activity diagram as either activity states or action states.
Use branching as necessary to specify conditional paths and iteration.
Only if this operation is owned by an active class, use forking and joining as necessary to specify parallel flows of control.
For example, in the context of the class Line, Figure 20-11 shows an activity diagram that specifies the algorithm of the operation intersection, whose signature includes one parameter (line, of the class Line) and one return value (of the class Point). The class Line has two attributes of interest: slope (which holds the slope of the line) and delta (which holds the offset of the line relative to the origin).

The algorithm of this operation is simple, as shown in the following activity diagram. First, there's a guard that tests whether the slope of the current line is the same as the slope of parameter line. If so, the lines do not intersect, and a Point at (0,0) is returned. Otherwise, the operation first calculates an x value for the point of intersection, then a y value; x and y are both objects local to the operation. Finally, a Point at (x,y) is returned.
Note
Using activity diagrams to flowchart an operation lies on the edge of making the UML a visual programming language. You can flowchart every operation, but pragmatically, you won't want to. Writing the body of an operation in a specific programming language is usually more direct. You will want to use activity diagrams to model an operation when the behavior of that operation is complex and therefore difficult to understand just by staring at code. Looking at a flowchart will reveal things about the algorithm you could not have seen just by looking at the code.
Forward engineering (the creation of code from a model) is possible for activity diagrams, especially if the context of the diagram is an operation. For example, using the previous activity diagram, a forward engineering tool could generate the following C++ code for the operation intersection.
Point Line::intersection (line : Line) {
 if (slope == line.slope) return Point(0,0);
 int x = (line.delta - delta) /
                 (slope - line.slope);
 int y = (slope * x) + delta;
 return Point(x, y);
}
There's a bit of cleverness here, involving the declaration of the two local variables. A less-sophisticated tool might have first declared the two variables and then set their values.
Reverse engineering (the creation of a model from code) is also possible for activity diagrams, especially if the context of the code is the body of an operation. In particular, the previous diagram could have been generated from the implementation of the class Line.
More interesting than the reverse engineering of a model from code is the animation of a model against the execution of a deployed system. For example, given the previous diagram, a tool could animate the action states in the diagram as they were dispatched in a running system. Even better, with this tool also under the control of a debugger, you could control the speed of execution, possibly setting breakpoints to stop the action at interesting points in time to examine the attribute values of individual objects.
When you create activity diagrams in the UML, remember that activity diagrams are just projections on the same model of a system's dynamic aspects. No single activity diagram can capture everything about a system's dynamic aspects. Rather, you'll want to use many activity diagrams to model the dynamics of a workflow or an operation.
A well-structured activity diagram
Is focused on communicating one aspect of a system's dynamics.
Contains only those elements that are essential to understanding that aspect.
Provides detail consistent with its level of abstraction; you expose only those adornments that are essential to understanding.
Is not so minimalist that it misinforms the reader about important semantics.
When you draw an activity diagram,
Give it a name that communicates its purpose.
Start with modeling the primary flow. Address branching, concurrency, and object flow as secondary considerations, possibly in separate diagrams.
Lay out its elements to minimize lines that cross.
Use notes and color as visual cues to draw attention to important features of your diagram.