Information Continuum
Contents
Building Blocks of the Information Continuum
Theoretical Foundation in Data Sciences
Tools, Techniques, and Technology
Historical (Snapshot) Reporting
Now that we have put some boundaries around defining analytics—a necessary step to provide a step-by-step detailed guideline on conceiving and building analytics projects—we will put some context around the maturity needed to introduce an analytics-driven culture. This context primarily deals with how information is consumed and how that consumption evolves toward a higher value of information use leading to automated decisions. Figure 2.1 is a summarization of Information Continuum—more detail will follow later in this chapter.

When the age of computing allowed us to move from paper to data, the power of data—converting it into information, converting information into insights, and making decisions on those insights—dawned on us. It was not because we had no need for information before, but rather the possibilities this paradigm presented. Even in the days of paper, people were converting data into information, but the process was slow, cumbersome, expensive, and error-prone, not to mention severely limiting in the variety and size of data that could be handled. The ability to store years and years of historical data alone catapulted us into a new age of information consumption, making the impossible possible. This chapter presents a hierarchical view of the information need and its utilization over a continuum called the Information Continuum (see Figure 2.1). The purpose is to:
1. Show where analytics solutions fit into an evolving process of getting value out of data.
2. Identify the prerequisites before achieving maturity in analytics solutions.
3. Show how technology, people, and processes need to evolve as an organization moves up the Information Continuum.
4. Help organizations assess where they stand today and chart a course toward analytics solutions.
5. Show how business users develop their thought process and trust around data.
Having access to the massive amounts of data does not necessarily mean that the value of information gleaned from that data will be automatic and simple to achieve. The Information Continuum starts at the lowest level of converting data into information for the most basic consumption needs, and then the impact of information use increases considerably as we move up the hierarchy heading toward analytics and decision automation.
The Information Continuum has four building blocks, which require maturity and evolution as we move from the lower levels to the higher levels within the hierarchy. Without maturing of these building blocks organizations cannot create a culture of information-driven decision making. Isolated initiatives can certainly skip some levels in this hierarchy, but the intent is to democratize analytics, and that cannot happen until the preceding levels are achieved along these four building blocks.
Building Blocks of the Information Continuum
To yield the most value out of data, the Information Continuum requires four building blocks (Figure 2.2):
■ The theoretical foundation in computing, mathematics, and statistics.
■ The tools, techniques, and overall technology to help traverse the hierarchy.
■ Trained technical human resources capable of implementing the technology that helps maximize value from data.
■ The business innovation appetite to harness the information in new and creative ways.

Theoretical Foundation in Data Sciences
The theoretical foundation around data and information in computer science, mathematics, and statistics has been around for at least 150 years (May, 2009). At the lower levels of the Information Continuum this building block would be arithmetic, algebra, and some basic statistical concepts like mean, mode, frequency, standard deviation, etc., while on the higher end of the Information Continuum would be linear algebra, vector graphics, differential equations, Euclidian geometry, correlation and multivariate regression, neural networks, etc. The explanation of these concepts at the two extremes of getting value out of data is beyond the scope of this book.
Specific concepts will be touched on when they are used to explain some aspect of the analytics implementation methodology. Software development environments or numerous software packages have libraries available that provide these basic to advanced concepts. In essence, the theory exists that can take us from a basic level of information use to higher advanced levels.
Tools, Techniques, and Technology
The tools, techniques, and technology used in extracting value from data at the lower levels of the Information Continuum cannot adequately function at higher levels, therefore, there is a need for the tools and techniques to evolve as well as to deal with newer and more complex information challenges. However, the emphasis is on evolution rather than replacement, so the tools and techniques at the lower levels need to further stabilize and strengthen the foundation for the higher-order tools and techniques to evolve and get more value from data. The biggest example would be the sophistication needed in data management tools, techniques, and technology that deal with much smaller and simpler data sets at the lower levels of the Information Continuum, but are overwhelmed by the size and scale of Big Data at the higher levels on analytics and decision strategies.
Skilled Human Resources
The issue of trained and skilled human resources is critical because availability of the scientific theory and the tools and technology that deliver that theory still require manpower to unlock the potential of data. Data modeling, data integration, data aggregation, and conceptual versus physical structure of the data are the primary skills needed for analytics. This skill is in short supply and will be the Achilles’ heel for analytics solutions. The lack of talent in the art of data in enterprises can be linked to the rise of the enterprise resource planning (ERP) software packages and a general shift toward buying products rather than building them.
The enterprise and general maintenance staff was not going to build complex data structures based on their business problems, rather the software vendor was going to address it. Therefore, the skill is concentrated within development teams of large product suite vendors. Data warehousing did give rise to this skill but it is limited to midlevel tiers of the Information Continuum. The material in subsequent chapters will show how to address that gap by helping transition the data warehousing skill set into a specialized data architecture skill set essential for analytics solutions. The perception that pointing analytics software to a large data set will yield results will be put to the test and highlight the importance of data architecture as a critical skill needed to attain higher levels in the Information Continuum with consistent and repeatable delivery of analytics solutions.
Innovation and Need
The business need is central to the success of an analytics solution, because without a clear direction, analyzing data aimlessly can be a never-ending exercise and can result in projects getting shelved and teams getting frustrated. However, in the business personnel’s defense, since they do not fully understand or appreciate the power or possibilities of analytics, they may not be able to articulate what they are looking for. The trend is to usually look for a successful project in their industry from conferences, industry publications, or case studies, and then replicate the same with their own data. So the requirements or need may come from competitors, academia, industry forums, etc.
One of the goals of Chapter 3 on using analytics is to democratize the analytical need and show mid-to-low level managers how they can embrace analytics to improve the performance of their departments through a varied collection of detailed examples. And since the entire implementation detail in this book tries to simplify the implementation cost and complexity of an analytics solution, hopefully lowering of the cost and knowledge barrier would encourage innovation and the need for higher analytics. Yet, this is a chicken-and-egg problem where technology will ask what business needs and the business will ask what’s possible. A collaborative pilot or prototype using existing data and software is the key to overcoming this hurdle and IT will have to drive toward this.
All four building blocks have to come together and evolve along the Information Continuum to help us move from a very basic conversion of data to information leading into very advanced information value creation.
Information Continuum Levels
To understand analytics, its capabilities, its use, and its implementation challenges, it is important to understand the Information Continuum because analytics solutions cannot be performed in a vacuum. The prerequisite levels in the Information Continuum have to be achieved first before attempting to democratize analytics for value across an enterprise. Figure 2.3 depicts the Information Continuum starting with a basic search on data generated from a wide variety of internal and external sources, leading all the way to automated decisions based on analytics, their monitoring, and their tuning.

As more technical and implementation details are offered later in the book, the Information Continuum shown in Figure 2.3 will act as a base to demonstrate what happens at lower levels and how to transform that toward higher levels. This is a continuum, meaning the distinctions between neighboring levels are blurred but become significant as the distance between them increases. In line with the business definition in Chapter 1 where a time perspective of data analysis was used to show how analytics was different from existing methods of getting value from data, the Information Continuum further elaborates that point.
Search and Lookup
The first and most basic level of information need is looking for a specific record. From the entire customer base, a help desk user can look up a customer’s account detail while the customer is on the phone. The search mechanism is usually predefined and the user cannot search using any random criteria. A predefined set of fields is typically set up on which a search can be performed. Search and lookup can be for a specific record if the search criterion is detailed enough, otherwise a closely matching list is presented to the user who then selects the record under consideration. The specific traits of this lowest level of information need are as follows.
Implementation
The implementation is built within the transactional or operational system where the raw data is generated and housed. The available technology is sufficiently mature to meet the needs of this level and the manpower to build this capability is also abundantly available.
Challenges
The challenges in this first level of the Information Continuum are driven from two factors, master data and history. If the master data (master lists of all customers, products, accounts, locations, etc.) is not in one place in a standardized format, the search feature becomes quite cumbersome to implement, as it would require searching across numerous systems housing that data. This scenario is typical in merger and acquisition activity where it may take years to identify and assign unique account numbers or identify a search criterion for uniqueness across various business divisions or geographies.
The challenge of history comes from data retention requirements for a search. If a record being searched is eight years old, for example, it may be no longer available as an online search and some manual back-office activity may have to be undertaken to search for that record in archives. Archival and recovery systems are getting better at this and most industries have a regulatory mandate for data retention. If the master data or unique search criterion and historical data requirements are added to this stage of information need, the complexity of technology and cost of implementation goes up, but the business value may not necessarily increase.
Counts and Lists
The next level of the Information Continuum deals with counts or summaries delivered through some form of reporting. The counting could be of transactions in a month, transactions by a customer, or counting of the customers themselves based on some criteria like recent activity, age, or status. Other examples include hours worked by employees in a location, products sold in a season, or simply the sales volume in a quarter. The unique feature of this level is the object or entity being counted, such as sales transactions, products, accounts, hours, volumes, etc., and the selection criteria by which the objects are being counted, such as time period, location, demographics, codes, types, etc. If the information consumer clearly articulates and explains the possibilities of various selection criteria, the resulting implementation is easy to manage, but in the absence of a clear understanding of the different ways in which something can be counted, this can become quite challenging to implement.
It is important to see the transition from a single record-based search and lookup in level 1 to the aggregate counting of those records in level 2. This shows how the Information Continuum demonstrates the evolution of information consumption—that is, from one record search to a collection of records and lists.
Implementation
The implementation mix is both a transactional system and a separate data warehousing type of system. Both options are viable and technology and trained manpower is available to carry out either implementation. The business intelligence tools and techniques have actually matured to address the dynamic selection or grouping criteria, and techniques developed in the data warehousing space are now widely used even within the operational systems to address this requirement. The key is to ensure the definition of the counts and the selection or grouping criteria is well documented and understood by the users of that information.
Challenges
The challenges in this level of information consumption are around the dynamic nature of selection for counting a certain entity. If the ways a certain entity is counted and the ensuing count is used for business purposes are well documented and well structured, the implementation is simpler. However, if the business truly wants a very dynamic mechanism to count customers, sales, or hours worked, then the complexity of providing that capability increases. The data warehousing concept of star schemas or dimensional modeling used with an advanced reporting tool may remain the only option in such a case.
Operational Reporting
This is the most common form of information consumption that has existed long before data warehousing, business intelligence, or even computing took control of business activities. The operational reporting refers to long-established information sets, standardized terminology, and industry- and regulatory-mandated data. Executives and middle management are used to asking for these reports in their regular staff meetings and they are shared with a larger audience across the enterprise. These reports sometimes act as a starting point for the day’s activities, such as delinquent tasks from the previous night that need to be picked up, open work orders that haven’t been shipped, putting cash in a vault for a bank’s branch before opening, etc. Regulatory reporting also falls in this category. Operational reports always have a well-structured format and run frequency (daily, weekly, monthly, etc.).
Implementation
The implementation of this type of standardized reporting has been the driving force behind the data warehousing industry. Prior to modern data warehousing (Inmon, 1992), there were two chronic problems that evaded the wider adoption of reporting in decision making. One was the fact that various systems had the same or overlapping data and, depending on which system was used to run the report, there would be discrepancies (this is commonly known as the problem of “one version of truth”). The other was that reporting consumed large amounts of hardware resources, impacting the operational activities. The modern data warehousing eliminates a lot of these pains and therefore this level of Information Continuum has matured the most.
Challenges
The data warehousing industry has been maturing over the last 20 years. Most of the challenges related to performance, data integration, data quality, and visual presentation of reporting have been adequately addressed, but data warehousing is under severe pressure from shrinking nightly batch windows, explosion in data volumes, and increased sophistication in evolving business needs. The data warehouse was conceived to address a specific set of problems, and expecting it to solve all the challenges coming from higher levels of the Information Continuum is an unreasonable expectation. It remains a central piece in analytics solutions but acts as a source of reliable factory that can deliver data into analytics solutions.
These three levels within the Information Continuum covered so far all deal with the present and are focused on information use concerned with what is happening now. They help answer the question of how we are doing now. There is a subtle maturity evolving across these three levels in information consumption where business went from one record, to lists and counts, and on to formally structured reports. This is the inherent nature of information consumption where maturity at one level automatically leads to the need for the next level.
Summary Reporting
The summary and aggregate reporting is very closely linked to the operational reporting but deals more with historical data than current data. Since this deals with historical data, usually there is a requirement to summarize or aggregate the data before presenting it. The summarization can be from various perspectives like geography or product, but usually the time perspective of summary is used and data is summarized over a time period (monthly, yearly, etc.). Ad-hoc reporting capability is also introduced at this level where users can change the filters and displayed columns on a report.
Implementation
Implementation of this level of information has also become mainstream with the advent of modern data warehousing. Reporting tools (BI tools) deployed in data warehousing systems can easily build this level of information. The tools, technology, human skills, and methodology are all well documented and readily available. The implementation can also be done in an operational system, and it is becoming quite common for operational system vendors to add summary and aggregate reports onto the operational databases through a smaller version of a data warehouse called a datamart that is usually limited to a specific business function. The ad-hoc nature of implementation has to be properly managed so users have a little more flexibility in managing the content on the report through filters and adding additional columns, without getting a report developer involved from IT.
Challenges
Similar to the challenges discussed in the counts and summaries level, the challenges surrounding the summary and aggregate reports deal with how the users want their data summarized. If implemented using a mainstream reporting tool, the users’ ability to aggregate the information across any perspective, such as geographies, time periods, etc., improves considerably. If report developers would put the code for the report directly into the tool to run the report, it limits the users’ ability to change the summarization parameter on-the-fly. However, getting the tool to dynamically generate the report based on whatever criteria users’ input, requires a good design that is based on sound analysis of how the summaries are actually viewed and used for decision making. Therefore, this information level challenge can only be adequately met if all aspects of modern data warehousing are carried out efficiently (Kimball, Ross, Thornthwaite, Mundy & Becker, 2008).
Historical (Snapshot) Reporting
Snapshot reporting is a type of report that allows for comparison of data from two different time horizons. Comparison of a region’s quarterly sales with the same quarter last year, profitability, and cost comparison month over month, and activities year over year, such as items produced, calls received, orders fulfilled, etc., are all examples where historical comparisons are made. The historical snapshot or comparison can be between two periods or more. A simple way to understand this is by looking at a summary or aggregate report run for separate periods and then combined in to one report. The snapshot reports are always looking at summarized data.
Implementation
The implementation requires careful snapshotting of historical data so new data does not overwrite the previous information, and the state of the information is frozen at a point in time no matter when you actually view it. This implementation is very difficult to achieve in an operational system and therefore it is recommended to always implement using a data warehouse system and data warehouse design techniques invented for ease of analysis across different time periods (Kimball, 2002).
Challenges
The challenge lies in the design of the data structure to handle historical data frozen in time that can be searched, reviewed, and compared. Several design techniques for this type of data structure exist in widely available dimensional modeling literature (Kimball, 2002). A good balance between what should be snapshotted and tracked over time versus keeping everything snapshotted in time has to be maintained, as data volume, growth, and unnecessary performance pressures may lead to higher cost of maintenance. The reason for this usually is the inability of the business to explain exactly what type of information they would want to compare—that is, they want to keep their options open. In the absence of that analysis, either a minimum level of information is structured for historical comparison or everything is tracked. Tracking everything becomes too expensive and tracking too little becomes a rebuilding pain when new requirements come along. If certain historical information is not tracked, then it cannot be reproduced easily. For example, a large department store’s sales volume is stored per quarter and can be compared across several years, but a requirement comes along asking for the sales to be broken up by departments. It is extremely difficult and almost impossible in some cases to break down the quarterly sales data by departments for already closed quarters going back several years.
Metrics, KPIs, and Thresholds
The summary reporting, aggregate reporting, and historical snapshot reporting levels lead into this level of the Information Continuum where various different metrics and measures are developed that business would use to gauge its performance. Selection of metrics and their use is critical to the survival and growth of any business (Kaplan & Norton, 1992). With any metric, to make the information meaningful, there has to be some expected or established pattern or trend. Once a metric is identified, its trend has to be established, and then determine what level of deviation from the trend will prompt a business reaction. This is called setting up a threshold. The metric is reviewed regularly and if the review determines that the metric is breaking the threshold, then a decision is regimented.
Metrics are the culmination of the summary and historical reporting levels because they condense that wealth of information into a numeric value that can be easily monitored, understood, and tracked. You can use reporting or you can use metrics, but without going through the evolution of the Information Continuum and its preceding levels, it is not easy to conceive a new metric that can provide ample visibility into a complex business operation. Figure 2.4 shows an example of a dashboard (Pondera Consulting, 2012) with actionable alerts on the left side.

Implementation
The implementation of metrics, its trends, and its thresholds is part of business intelligence through an area called dashboards (Eckerson, 2010). Most reporting tools now have dashboards that allow for defining, recording, trending, and visually representing the thresholds. Development in visually appealing tools and techniques has made the dashboards very attractive for business consumption. The real-time updates to dashboards so KPIs are reported in real time to business executives allow for quick reaction to a developing situation.
Challenges
One of the challenges is to help derive the business to a new metric or getting to a point where new metrics are constantly being developed with changing business environments to get a more granular view of business performance. Another challenge deals with the adoption of newer metrics in decision making, as everyone has to perceive the metric exactly as its implementation intended.
Analytical Applications
Analytical applications is where all of the previous levels of the Information Continuum come together. A very popular implementation of analytical applications is the dashboard with attractive displays, colors, and animation. What a dashboard does is basically simplify the information from several summary reports, several historical comparative snapshots, and several metrics, and presents that simplified view to management for fast and effective decision making. This type of analytical application includes triggers and alerts, appropriate email messages, and an overall governance of how metrics are created and adopted.
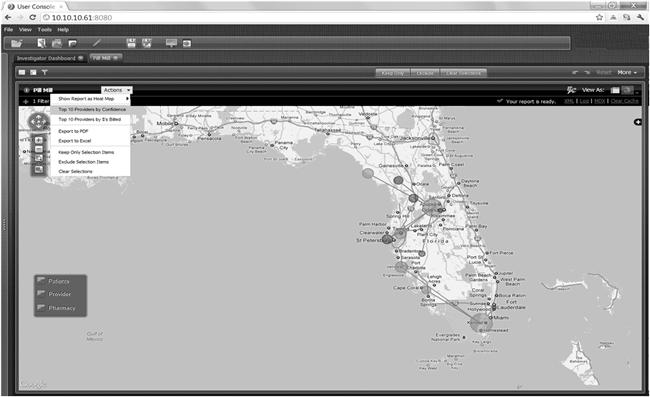
Another type of analytical application includes data visualization where data is represented through geo-spatial maps, 3D graphs, scatter plots, etc., to detect clusters, spikes, dips, and anomalies. In geo-spatial analysis, data is centered on addresses that are converted into geo coordinates (latitudes/longitudes) and then displayed on a geographic map. The points on the map can be filtered based on any number of factors and uses of historical data, summaries, and even metrics. The important feature of this level is the visual appeal or method of representing data.
Additional interesting analytical visualization techniques will keep appearing in broader markets or very specialized areas, but their nature will place them into this level of Information Continuum. Some degree of statistics and mathematics are also part of analytical applications and, for a predefined business problem, packaged analytical applications are also available, in direct marketing, sales force management, geo-spatial analysis of ATMs and branches in banking, etc. Figure 2.5 is from a fraud detection software package (Pondera Consulting, 2012) where potential collusion between suspects is presented as an overlay of circles representing contacts on a geo-spatial map.
From the summary reporting level to the analytical applications level within the Information Continuum, the focus has been to understand historical data (i.e., the past), learn from it, and then make business decisions. It focuses on how we did as opposed to the first three levels of how we are presently doing. The sophistication of information use continues to evolve across these levels and as the horizontal axis in the Information Continuum (Figure 2.3) depicts, the business value increases as these levels are traversed.
Implementation
Typical implementations of analytical applications require a separate application instance with its own database that follows the requisite structural requirements of the application. Most analytical applications operate in a read/write fashion where user interacting with the system also generate data that is written back. The implementation architecture should have a clear integration interface with the data warehouse which would feed data into the application database. The analytical application is like an operational system as far as user interaction is concerned but they are always downstream from the data warehouse and are fed from it.
Challenges
While the visual aspect is pleasing, this Information Continuum level has to be built once the underlying levels have a wider adoption and appreciation. The biggest challenge is around interpretation of the visualization. Various departments and groups have different perspectives and ensuring the same visualization is interpreted the same way across the enterprise may require considerable user training and education. If a vendor-driven pilot is undertaken on a specific problem without going through the evolution of the Information Continuum, the results may be pleasing, but the tool’s ability to benefit the entire organization may not be achieved. Therefore, the requirements for an analytical application are critical, since identifying and agreeing on the information to be made available through the application is a complicated mix of business needs and technical capability. The entire set of available data is overwhelming and cannot be effectively presented in these visual formats (dashboards, 3D graphs, and geo-spatial). Therefore, the Information Continuum hierarchy has to be followed as along its levels comes knowledge and understanding to interpret the data.
Analytics Models
This book is about analytics and this section will only touch briefly on the Information Continuum level of analytics since we are going to deal with it piece by piece in subsequent chapters. The purpose of this topic here is to put analytics in a context of information evolution, technology, and processes. Analytics solutions today are built disconnected from the rest of the Information Continuum, but until a solution is linked back into the Information Continuum and its overall implementation roadmap, value from analytics would not become commoditized and democratized. At the beginning of the chapter we argued why analytics should be available to everyone in an organization for improved customer experience, operational efficiencies, and increased innovation, across all business functions. If data is available, then standard reporting or summary reporting should be available based on the Information Continuum levels. If summary reporting is available, then historical snapshot reporting, metrics, and analytical applications should be introduced at every management level as well. Therefore, the argument continues that analytics should be available for everyone as well.
As per the definition of analytics, there are four types of techniques involving some combination of data mining, mathematics, statistics, and computer science to deliver analytics:
■ Descriptive methods (clustering, association rules, etc.)
■ Predictive methods (classification, regression, and text mining)
We will only focus on descriptive and predictive methods for most of the rest of the book to illustrate how to identify opportunities or problem areas where these methods can be applied. Specialized areas within large organizations use some kind of analytics anyway, but the intent is to bring it down to all facets of a business and really democratize it as reporting has become over the last three decades. Just like operational reporting, employees should be relying on analytics to come into work and carry out their day-to-day activities. Throughout the book, we will try to treat four different types of analytics techniques as a black-box and focus on using them for specific input and output.
Implementation
The implementation of analytics is a very tricky matter and requires detailed introspection. If the business problem area where analytics is being applied is a very sophisticated and critical component for business survival, like risk management in a brokerage or trading business, then the implementation should be higher-end as well. This would mean having a few PhDs on staff, a very high-end analytics tool, and an indigenous and tailor-made solution. That type of implementation is very expensive, and making a business case for that requires a lot of commitment from executive sponsors, as well as clear understanding of the expectation and benefits from the implementation. Since we are trying to introduce analytics at every level of an organization, this implementation approach will not work.
The lower-end analytics capability, especially where the results and the benefits are not quantifiably known, would need free open-source analytics tools like R (R Foundation, 2012) or database analytics like Microsoft SQL Server’s Analysis Services. This in conjunction with the data warehouse infrastructure already in place, and the detailed methodology presented subsequently in this book will provide a cost-effective implementation roadmap. Once the sophistication level increases and the business sponsors are on board, advanced tools and high-skilled human resources can be employed. The implementation of analytics models has to be within the existing data warehousing infrastructure and manpower.
Challenges
The two-part challenge for adoption of analytics in the Information Continuum is first identifying the problem where analytics can actually help, and then creating an implementation guideline so this can be achieved cost effectively.
Decision Strategies
Once an analytics model is available, what to do with its output is the next level in the Information Continuum. For example, a predictive model can predict the likely losses from a trade but that will always be with a degree of certainty. It may say there is a 77% chance this trade would result in a loss in the next six months. The decision to trade or not now needs to be further analyzed. However, all trade decisions will get some prediction of potential losses along with a probability, and if all of them have to be reviewed, then the analytics model is of little value. A decision strategy addresses this gray area of decision making by optimizing the value of human input. A decision strategy, therefore, would be to decide on cutoffs and take automated decisions. If a trade’s loss probability is (let’s say) greater than 70%, then the trade should not be approved. If it is less than 25%, then automatically approve the trade and everything in the middle should be reviewed by an expert. Decision strategies require further segmentation and analysis including what-if analysis to determine the cutoffs, while the model is treated as a black-box that assigns some kind of rating, score, percentage, or metric to the output. Analytics without a decision strategy is like a beautifully cut diamond for which no decision has been made whether it will fit in a necklace, ring, or watch. To make use of analytics models, a decision strategy has to be worked out by developing cutoffs and automation of decisions.
The most famous example of decision strategies is in the consumer credit space in the United States where a proprietary analytics model developed by the FICO Corporation (2012) produces a number called the FICO® Score, and then the lending organization uses it in decision strategies such as:
■ Approve a credit application or not.
■ Whether an expert underwriter needs to review any aspect of the credit application.
■ How much interest to be charged.
The current literature in the market on analytics is not emphasizing the decision strategies enough as the next step in the evolution of information consumption; analytics without the decision strategies will be limited to a few decision makers. On the other hand, a wider implementation of decision strategies to support the operations and field staff can convert all workers into knowledge workers. Knowledge workers are not the ones who have all the relevant data, historical and business context, and analytical capability to carry out their jobs driven from insights. Knowledge workers are workers first; they are in the trenches carrying out the day-to-day operations. They are the ones who apply the knowledge and experience of middle managers or subject matter experts in business operations relying on decision strategies. All aspects of the data across the entire Information Continuum has culminated in a decision strategy. Knowledge workers rely on the actions coming out of the decision strategies and carry them out trusting the process and evolution of the Information Continuum.
Implementation
Implementation of decision strategies requires several technical pieces. First is an analytical piece that helps decide cutoffs and ensuing decisions. Second is the decision engine that actually runs every transaction through the strategy and assigns a decision. Third is the integration of that decision within the operational system. Chapter 5 on automated decisions covers this through in-depth design and implementation level detail.
Challenges
The biggest challenge lies in management culture change since they are not used to enforcing decisions down to the day-to-day operations in such an automated form. The hurdle there is the fear of the unknown because what if the cutoff and ensuing decision turn out to be incorrect. How do we ensure the cutoffs are optimized for that operation? Is that automated decision making threatening the middle and first-level management’s effectiveness? A cultural shift in automated decision management is far greater than any technological challenges that pale in comparison.
Monitoring and Tuning—Governance
A careful scrutiny of the subprime mortgage crisis reveals that the absence of governance on analytics models and strategies was one of the main culprits that kept the regulators, auditors, shareholders, and even top management in the dark to the extent of the abuse of subprime mortgage policies and business. When borrowers applied for loans, the lenders almost unanimously relied on the FICO Score generated with the credit report coming from one of the credit bureaus (Equifax (2012), Experian (2012), or TransUnion (2012)). This means that an analytics model was used in the decision making and that is a good thing. However, since the FICO Score correctly predicted higher default probability (hence the term subprime (Financial Crisis Inquiry Commission, 2011)), it was the decision strategy that used a lower cutoff for approval. The analytics model wasn’t at fault, the strategy design was at fault, although the mortgage-backed securities getting triple AAA ratings were the fault of analytics modelers who had not appropriately factored in variables adequately (see Chapter 5 for more on decision automation).
This level of the Information Continuum on audit and control of analytics (analytics governance) actually uses the metadata from the analytics and the decisions and builds a control mechanism to manage decision strategies from going haywire. To understand this better, let’s look at the fictional futuristic projection in movies like Terminator that show machines getting so smart that they take over the world. These were intelligent machines and they had the capability to make decisions based on data and intelligence (machine learning or data mining), but when their decision strategies started breaking the boundaries that humans never expected, they became masters enslaving humans. If an audit and control layer was in place reviewing every single decision made by the decision strategy of the machines, then they would’ve known when to interject and adjust the machine’s decision automation parameters or metrics, trends, and models on which the decision strategy is built.
Operational activities generate data. We analyze that data through an evolution of reporting capability to better understand what has happened and then we build analytical models to start working toward better understanding what we should do. These suggested actions coming from analytics become actual decisions through a decision strategy, and then this leaves additional newer kinds of operational data that audit and control picks up. Interestingly, with audit and control, we are back in the present, as the decisions are being done in real time during the course of business operations. Therefore, analytics governance uses operational reports, summary reports, compares historical snapshots, and builds its metrics and KPIs to ensure analytics models and decisions strategies continue to perform at an optimal level for business benefit.
The users of this level cannot be easily defined. The risk management teams in financial organizations and internal auditors and controllers are supposed to be the users who should be doing this anyway. Maybe their methodology should change to ensure this. New possible users could be anyone who has a stake in the organization’s success and stability, including employees or employee unions, shareholders, external auditors, or regulators. If an organization truly functions as a knowledge organization and follows the Information Continuum, then maybe this level should be inherently available across all functions of the organization rather than one centralized audit function. The business significance of this level is very high because the absence of this level can actually lead to a complete collapse of the organization or significant losses. The rogue trader syndrome, the conniving and conspiring executives, the sheer stupidity of an individual, or the deception of a con artist have all caused damages to the tune of hundreds of billions of dollars in the last five years alone to companies like Bear Stearns, Lehman Brothers, Olympus Corp., MF Global, JPMorgan Chase, AIG, UBS, Barclays Bank, etc., because analytics-driven decisions were not properly governed and circuit-breaking thresholds and alerts on metrics were not in place.
Implementation
The implementation of this level is actually pretty straightforward. It is very similar to traditional data warehousing, only it is metadata data warehousing, as we are analyzing data about the actual data within the organization. This requires converting the information sets, reports, analytical models, decision strategies, and the actual decision transactions all into data and then store this data in a metadata data warehouse that is then accessed using any standard reporting framework to indicate the stability of the business units, specific functions, and the whole organization.
Challenges
The challenge lies in defining the right metrics and their thresholds that should be tracked during the course of automated decisions and alert when thresholds are breached. The technical challenge is no different than the technical challenge in the KPIs, metrics, and thresholds level, as essentially the same action is being repeated.
Summary
The levels of information consumption discussed in this chapter are not merely a categorization of how information is consumed. They actually lay the foundation for the people, processes, technology, users, and data to be managed in a manner specialized for each level. The idea is to build the higher levels of information consumption through an evolutionary approach. Each new level built on top of the previous levels with maturing resources (human, technology, and process) takes on the more challenging levels of the Information Continuum, leading to proactive, insightful, and managed automation of business decisions. In today’s climate, the Information Continuum exists as a fragmented collection of tools and expertise. This limits the benefit of analytics skills and technology confined to the group that owns and maintains the specialized solutions.