Big Data, Hadoop, and Cloud Computing
Contents
Big Data Implementation Challenge
Applying the Information Continuum
User Applications (User Experience)
Hadoop as an Analytical Engine
Big Data and Hadoop—Working Example
Cloud Computing (For Analytics)
When the idea for this book was originally conceived, Big Data and Hadoop were not the most popular themes on the tech circuit, although cloud computing was somewhat more prominent. Tablets and smartphones were still making waves, Facebook was still in its pre-IPO state, and social media, mainly through Twitter, had just demonstrated its revolutionary power in Middle Eastern politics with regime changes in Tunisia, Egypt, and Libya. Some of the reviewer feedback for this book suggested that these topics should be addressed in the context of the conceptual layout of analytics solutions so readers could make educated decisions whether they need to invest in newer skills or if they want to use their existing capabilities.
Throughout, this book has kept a technology-neutral posture speaking in general terms about databases, ETL and reporting tools, data mining and visualization tools, etc. The following topics will also get the same treatment, and their use in an overall analytics solution will be explained using the previous chapters as a foundation. Hadoop will be treated as yet another database or data processing technology designed for very large-volume data storage and analysis. The following three topics are presented as standalone material, each tying back into the overall analytics solution implementations presented in preceding chapters.
Big Data
If you are dealing with data beyond the capabilities of your existing infrastructure, you are dealing with Big Data; essentially, too much data is Big Data. Another popular definition that is somewhat fading away is that unstructured or newer forms of data that didn’t exist until recently are considered Big Data (e.g., Facebook “likes,” Twitter “tweets,” or smart-energy meter readings). When the term unstructured was used, this included images, PDFs, document files, music files, and movie files, which were always digitally stored but hardly ever analyzed. However, the best definition for Big Data comes from Gartner Inc. (2012): Big Data, in general, is defined as high volume, velocity, and variety (the three V’s) information assets that demand cost-effective, innovative forms of information processing for enhanced insight and decision making.
This definition is where consensus is developing, and I will use it as a basis for explaining Big Data within analytics solutions. It has to be understood that without a sufficient amount of data, analytics solutions may not deliver the expected return on investment. Insufficient data volume limits the successful training of an analytics model, or even if it is successful, its performance is not ready for business decisions. So when does sufficient data become Big Data? Big Data refers to newer forms of data that we can now tackle in unprecedented sizes, shapes, and volumes. However, data is data, and it has to be analyzed, performance variables identified, models built, decision strategies designed, and business decisions made, tuned and monitored. Big Data also has to go through the same motions to deliver analytical value. In the Information Continuum discussion (see Chapter 2) the hierarchy of data utilization starts at raw data and, as our understanding and comfort of data increases, we move up that hierarchy extracting higher value from data. Big Data will also have to go through the same process, where it will start at raw data and move up as we use a different set of tools capable of handling it.
The definition of Big Data uses three characteristics: velocity, variety, and volume. Let’s look at each of them in detail. Whether data requires all three or just one to be qualified as Big Data is a debate that will take a few years to settle as this area matures. For now, we will assume that any one of the three characteristics present qualifies a problem as Big Data.
Velocity
Velocity refers to the speed with which data is generated. Data generated from user interaction is limited by the number of users and the transactions being performed. Since Big Data has a notion of very high velocity, we can argue that traditional business and commerce-related transactions cannot be easily qualified as Big Data; besides, traditional database systems have been handling those interactions reasonably well and their volume is unlikely to increase several-fold overnight. So what are some situations where data gets generated at a very high velocity? Most situations involve machines and devices generating data. However, there are some unique situations in web searches, very large social media sites, or gaming platforms on the web where hundreds of millions of users can simultaneously be generating a lot of data from their normal activities in those environments. Wireless devices constantly communicating with cellular towers almost every second, emission sensors on-board an automobile detecting carbon contents every few milliseconds, oceanographic sensors detecting tsunamis, weather sensors recording moisture, wind, and temperature, etc., are all examples of velocity where the speed of recorded data is overwhelming for the traditional hardware and relational database systems. Not only that, a data collection and analysis problem in high-velocity situations can involve thousands of sensors all recording and reporting data with subsecond frequencies, which creates a communication, storage, and processing problem all at once for traditional computing infrastructure.
Variety
Variety in Big Data deals with the variation in the records getting generated, meaning how many different kinds of data are being recorded. The examples used to explain velocity deal with limited variety, because no matter how many sensors are reporting data or how frequently they report it, if the information set just contains six to eight fields and the variation of data in those fields is also very limited through coded values or well-defined ranges, then the variety of data is low. On the other hand, user activity on an interactive cable-TV box or smart-TV will result in generating all sorts of records from channel viewing, to channel skipping, to program details, to advertisement durations, to DVR, to on-demand viewing, to premium channels, etc. If millions of users are simultaneously interacting, then the data has both velocity and variety. Popular social media platforms also have both velocity and variety since millions of users are interacting and their interactions generate a wide variety of different data points. Variety deals with both different layouts of records as well as variation in possible values in the fields within the records.
Volume
Volume deals with the size of the data required for analysis. It can include longer histories, such as weather sensor data recorded and analyzed over several years to predict weather system movements. Volume can also refer to a large number of users performing the same activity (clicking on a breaking story), and therefore the specific scenario that deals with that situation is overwhelmed with the volume—although depending on what is being analyzed, it may just be a problem of velocity. Volume deals with both the storage and processing of large data sets. In the absence of Big Data technology and toolsets, analysts working to build predictive models could not use this kind of volume (hundreds of terabytes), and therefore always used a representative sample. However, with a wide variety of data mining algorithms and cheaper hardware resources, they can now tackle the problems without bringing its volume down to a few gigabytes through sampling and losing information in the process. The NoSQL initiative was in fact in response to this exploding volume of data which would have cost millions in hardware infrastructure and still the relational database engines would not have been able to handle this kind of data volume. Hadoop is just one implementation of that NoSQL movement that has been very successful at tackling unprecedented problems of volume. Here is a reference for more detail on the NoSQL initiative http://nosql-database.org/.
Big Data Implementation Challenge
Big Data has challenges both in the operational environment and in analytical environments. In operational environments, Big Data challenges can deal with overwhelming traffic on a website because of an event or a cyberattack, and dealing with that requires newer forms of tools and technologies. Diagnostic applications on-board aircrafts and heavy machinery deal with a large volume of sensory input, and based on that they have to take a course of action. However, we will limit ourselves to a Big Data implementation challenge only within the analytical space where historical data is essential in identifying patterns that can be used for proactive decision-making strategies. Two excellent articles provide more depth to this topic:
■ “What Big Data Is Really About” (Madsen, 2013)
■ “What’s Your Strategic Intent for Big Data?” (Davenport, 2013)
The technology vendors dealing in NoSQL databases, in-memory systems or database appliances typically position their Big Data solutions as an alternate to traditional data warehousing. The premise that drives this perspective is that savvy business users want all of their data all the time and in one place so they can get to it any time and anyway they want to without going through months of development through various marts and summary layers. If that is in fact a challenge posed by the business to the data warehousing and IT teams, the proposition that buy a big enough appliance or big enough data storage and processing infrastructure and eliminate all the ETL and aggregations and marts and summaries, etc. may actually make sense. However, the Information Continuum prohibits or creates a barrier to this approach. While it is technologically possible to build a very large Hadoop cluster and dump all the data from all the internal and external systems in there, the understanding of the inter-relationships of the data and exposing all that data meaningfully to business users would be a challenge. Users can get lost in such a large universe of data fields and records and their inter-relationships and dependencies or they can inter-mix data incorrectly without realizing. The Information Continuum represents a natural evolution where organizational appetite for data and insights as well as the understanding also evolves accordingly.
Controlling the Size
The first thing to identify is whether the problem domain under consideration poses all three problems of velocity, variety, and volume. If the problem primarily deals with machine sensor–type data that sends readings every few milliseconds, there is a way to eliminate the velocity and volume parameters from the equation by only recording significant shifts in the readings. As long as the sensor sends the same exact information, there may be an option to ignore it. However, careful analysis of the problem domain is required to see whether the readings before the significant shift actually demonstrate a pattern. Keeping all the detailed readings can come in handy, but the effort and cost required to manage that should be justified against stated objectives.
Similarly, if the variety in data is overwhelming, we want to make sure that each data type has enough volume represented in the analysis. If the volume is skewed toward a handful of record types, then we may need to apply some principles from statistics to bring the volume across the varieties to representative sizes. The key to managing the size is to see if one or two of the three characteristics (the three V’s) can be eliminated to manage cost and scope of the problem across the data size, problem statement, analytics models, ensuing decisions, and expected results.
Applying the Information Continuum
Once the three characteristics are analyzed and the problem parameters are understood, analyzing the data starts with the Information Continuum i.e., search/lookup, then counts, summaries, reporting and eventually analytics. Without this process up to this point it is difficult to fully understand the data and therefore there is a limited ability to get value out of this data. Remember, this is data that business has never analyzed before, and therefore they would need this capability to get comfortable and start formulating what they want to do with it. From basic reporting all the way to analytics modeling in the Big Data problem space, all the stages of Information Continuum may not be needed as a specific implementation layer but the understanding is required. Once the comfort is there with the Big Data and a formulated problem statement, you can jump directly into the analytics model. The application of analytics techniques, performance variables, and all the other components of the analytics solution are as applicable to Big Data as they are to traditional types of structured data.
Hadoop
Creation of Hadoop can be traced back to 2005 as an initiative at Yahoo by Doug Cutting driven or inspired by Google’s MapReduce technology (Vance, 2009). By 2009, Hadoop dominated web searches and large websites’ internal workings to organize, index, and search troves of data and service ads at companies like Yahoo, Google, and Facebook. Hadoop is a file system capable of storing and processing an unprecedented amount of data presented in any file format. It uses a technology called MapReduce to search, access, and manipulate that data while running on cheaper interconnected computing machines (even old PCs).
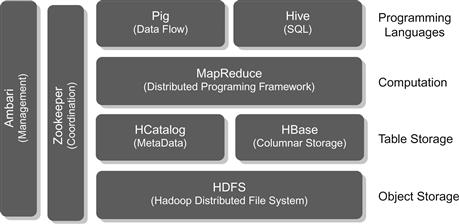
Hadoop Technology Stack
The best representation of Hadoop’s technology stack that I found relevant to the introductory level of detail presented here comes from Michael Walker (2012). Figure 11.1 shows where a Hadoop technology stack fits into the overall data processing solution and what kind of tools are available in each layer of the stack for specific functions.

Data Sources
Data sources refer to data, or rather Big Data, that needs to be brought into the Hadoop file system (HDFS). Various tools and software packages exist that allow moving data from conventional storage like UNIX file systems or relational database systems or even from logs or various other forms of storage into Hadoop. Hadoop takes the incoming data and loads it into its own file system while structuring the data across the various clusters (groups of computers or nodes to run Hadoop) distributing the incoming data across the nodes in the cluster.
Hadoop Data Store
The Hadoop data store has HDFS as the file system and a catalog that tracks where data has been stored. The files from the data sources (e.g., logs, PDFs, images, etc.) do not retain that native structure, rather they are converted into the HDFS format. Unlike Windows File Explorer, which shows all the files on the Windows file system like documents, spreadsheets, etc., you cannot open the HDFS and look at the original files easily.
Data Processing
Once the data is within the HDFS, the only way to access it is through the MapReduce command interface. The MapReduce command interface allows for entire processing logic to be written in MapReduce. However, MapReduce programming is not trivial since it requires breaking down the processing logic into a parallel rather than sequential programming code. Breaking down a business problem in the form of Map and Reduce functions is quite a programming challenge.
Data Access
to address this data processing challenge of MapReduce, which is not rich enough like a DotNet programming environment, an entire data access layer has been built over time. This data access layer consists of a wide variety of open-source and proprietary tools and libraries developed for various programming needs. If MapReduce was like Assembly Language programming, the data access layer is more like C/C++, SQL, and Java type of programming, which is more business friendly.
User Applications (User Experience)
The user application or, as Michael Walker puts it, user experience layer is like the application layer where complex business logic is combined to deliver value. This is the fastest growing space within the Hadoop technology stack where libraries, tools, software packages, and suites are starting to become available in a wide variety for specific business applications.
Hadoop Solution Architecture
If a corporate organization wants to adopt Hadoop for some of their complex business requirements dealing with Big Data, the deployment architecture of Hadoop is still very complicated. However, the good news comes from a wide variety of software packages that are now Hadoop compliant. Almost all the big technology vendors have adopted Hadoop as an answer to very large data-centric problems primarily for two reasons:
■ Hadoop is extremely scalable.
■ Hadoop implementation in terms of hardware cost is very low (Davenport, 2013).
Organizations should look for vendors that provide the data access or user application layer tools that are Hadoop compliant instead of writing their own until the technology matures to a point where skill and support is readily available. Deploying Hadoop alone will be a challenge for typical internal IT staff, as its deployment has a lot of moving parts and standardized documentation and structured methodologies are still developing.
Figure 11.2 from Michael Walker’s blog is a simplistic component diagram that shows the relevant layers needed to make use of Hadoop for a business application. On the left side it shows two additional layers that allow for managing the entire environment. Still, archive and retrieval, failover, disaster recovery, data governance, and information security controls are in their infancy compared with established database systems like Oracle or Teradata. Hadoop can be used in operational and transactional environments where large volumes of data need to be analyzed as quickly as it is created to look for certain thresholds that are being broken or specific data pattern needs to be identified. A trigger-based approach is typically used and a massive amount of sensor or web log for user activity data passes through Hadoop as it looks for specific predefined triggers of very high readings from sensors or specific user activity. These are caught and reported in real time to users or other applications, since Hadoop deals with all three V’s at the same time. This is the operational perspective of Hadoop and we will not delve further into its implementation.
The use of Hadoop to solve Big Data analytical problems has two variations:
1. Hadoop acting as an ETL layer to process Big Data and loading into a RDBMS-based traditional analytics datamart (Chapter 10 describes analytics datamarts in great detail).
2. Hadoop acting as the data mining engine processing data to build a model.
Hadoop as an ETL Engine
Figure 11.3 shows how Hadoop would fit into an analytics solution. The idea in this approach is to aggregate or build performance variables from the Big Data using Hadoop, while traditional data that needs to be intermixed takes a conventional ETL route. Once the Big Data is reduced to more manageable sizes (by eliminating one or more V’s from its characteristics), it can be treated as conventional structured data that can be stored and processed in a relational database system. In this scenario, Hadoop is acting like a lean and efficient ETL component. Leading ETL vendors have added Hadoop support in their suite of tools to do this from within one data integration suite (Thoo et al., 2012).

Figure 11.3 is a variation of the same diagram as we saw in chapter 9 on Analytics Implementation methodology (Figure 9.3) but here, Hadoop is shown as an added ETL layer for Big Data. This advanced form of ETL is required to convert unstructured data like tweets, videos, phone calls, machine sensor logs, etc. into structured data. This is important because unstructured data may not be very useful to be used in analytics models unless the knowledge from that data is integrated with other structured business and operations data in order to build better performance variables and analytics models. Therefore, treatment of unstructured data should be considered a separate layer of specialized ETL (on steroids) that can read and decipher the digital structure behind unstructured data and get value out of it in structured form and feed into a more conventional layer of ETL using Hadoop that is then able to integrate that with other Big Data feeds. If after applying Hadoop to unstructured data, the variables and structured data that we extract are manageable in size, then they can be run through a conventional ETL layer as well following traditional data warehousing methods.
Hadoop as an Analytical Engine
The other option for Hadoop within an analytics solution is where the entire data mining algorithm is implemented within the Hadoop programming environment and it acts as the data mining engine shown in Figure 11.4. This is used when there is no option of reducing, aggregating, or sampling the data to eliminate the V’s from Big Data characteristics. This becomes quite complex as the performance variables, the heart of innovation within analytics modeling, cannot be easily added to the data set without creating an additional storage layer. However, various problems actually require running the entire Big Data set looking for specific trends or performing fuzzy search or correlations between variables through Hadoop and its data access programs.

Outside of analytics—as defined in the first chapter—Hadoop can be used as generic data processing engine that can search and look for patterns and correlations almost like a reporting tool of sorts. It should be treated as a commodity data processing layer that can be applied to any overwhelming data size problem.
Big Data and Hadoop—Working Example
Let’s take a Big Data problem from the retail shopping sector. A large brick and mortar retailer with thousands of square footage in floor space wants to understand the following three things.
1. How are the floor placement of promotions and products attracting people i.e., how many people stop and how many ignore and pass?
2. How many people actually enter the store broken down by entrance and time of day and how does that correlate with sales?
3. What is the probability that a customer stopping at a display will buy the product?
In order to answer these questions, it is evident that a new form of data is required. The traditional structured data available with retailers such as point of sale, inventory, merchandising, and marketing data cannot answer these questions. Therefore an additional source of data is required to answer these questions. As most stores are fitted with security cameras and the digital surveillance technology has improved dramatically, we will assume that the security cameras are available across the store and they do have digital footage from the stores 24/7.
Dozens of video files are available from security cameras on a daily basis and for a large retail chain the number could be in thousands. The video files are typically voluminous, so we are certainly looking at the “V” of volume to run this analysis. It is also certain that the “V” of variety is not applicable here and that velocity will be a challenge if we decide to do this analysis in real time as videos are streaming. So certainly, this is a Big Data problem.
Specialized code will be required to analyze the videos and separate people, entrance and floor layout. Some kind of logical grid of the floor plan will be needed and then the displays will have to be marked in that logical construct. In the first step, we will use Hadoop as an ETL engine and process all the video files.
For Question 1: The output should provide the required metrics by each display as the video image processing logic (implemented using Hadoop technology stack described above) should identify the display, count the people passing, and count the people stopping. This is a massive computing challenge in storage and CPU and Hadoop is exactly designed to handle this. The structured output data should be recorded in the data warehouse
For Question 2: This one combines the data extracted from the videos using the Hadoop implementation with some structured data available within the data warehouse system as Point-of-Sale(PoS) systems track the sales transactions and have a timestamp on them. So the same logical grid of the floor plan will be used to identify entrance and video imaging program (implemented in Hadoop technology stack) will count people entering and leaving. This output will be recorded into the data warehouse that already has the information on PoS. With the two datasets in structured form now recorded in the data warehouse, all sorts of additional questions can be asked intermixing the data
For Question 3: This one is an extremely complicated question because it requires identifying the customers with a unique ID so they can be tracked passing through displays as well as when they bought something. We will first limit our solution to the video footage of shoppers who stopped at a display. At the time of purchase, we will need structured data to link their loyalty card or another form of ID we may already have on file with this video file ID. The two streaming videos have to be combined, but we do not know which ones might have the same customer in them although we can limit ourselves to the same store footage and within the 2–3 hour window of the video showing someone entering. This completes one part of the solution where we are able to track the ones who stopped at a display and also bought something (this makes up our “1” records for predictive model training). The other part of the data (the “0” records) who stopped at a display but did not buy will be the remaining population in the video footage with a unique ID. Now that we have two population sets, we can start to work on performance variables and as described in Chapter 4 on performance variables, there is a lot of freedom in looking for variables from the videos, like clothing, individual or family, young or old, other shopping bags in hand, food in hand, on phone or not, etc. are all variables that can be extracted from the video files. The image processing technology has dramatically improved in the past few years so do not be overwhelmed by the massive video image processing required here. Once the variables are identified, the model needs to be trained and then if the predictions are needed in real time for the ones who may not buy so a sales associate can attend to them then we are dealing with the “V” of velocity as well. This type of problem requires the entire solution to be coded in the Hadoop cluster because even if we take the performance variables out as structured data and use conventional data mining algorithm to build the model, for real-time use, the video has to be constantly processed and run through the model. Anything outside of Hadoop environment may create a scalability bottleneck.
Cloud Computing (For Analytics)
Cloud computing has taken the information technology industry by storm. The idea is that managing massive technology infrastructure and environments is extremely expensive and ensuring reliability, security, and availability of that infrastructure requires specialized technology and skill. If all an organization wants to do is run a few essential business applications for finance, HR, and operations, why do they have to incur the significant upfront and operational costs of managing the infrastructure? The idea of letting a third party take care of the IT portion of a business makes a lot of sense, and CFOs and other business executives are in agreement. However, using cloud computing for business applications means data will be outside the walls of the organization, and there is a certain degree of discomfort with that, thereby limiting the use of cloud computing mostly for nonessential business functions.
Disintegration in Cloud Computing
The biggest challenge for data warehousing and analytics because of the introduction of cloud-based application systems is data integration. Over the last three decades we finally accomplished a very daunting and complex challenge of data integration across the enterprise. Now again as some systems are moved to cloud computing, data integration will again become a challenge. The tools in cloud computing to handle complex data integration, particularly semantic mapping and data quality, integrity, and scalability, have not yet been adequately addressed.
When an application system is moved to cloud computing in a SaaS (software as a service) environment, the cost savings come from adopting the SaaS software functionality as it is offered. There is limited opportunity for customization because then the economies of scale for the SaaS go away. This also means that how the SaaS vendor defines data fields, their valid values, their interrelationships, etc., has to be accepted. However, the data warehouse and the analytics solutions are probably using the older definitions from the legacy system that is being replaced, and therefore the entire data movement process from the legacy system needs to be reviewed in light of the new data feeds that will have to come from the SaaS application. This can be quite a challenge, and additional cost of reimplementation has to be factored in to the overall SaaS project’s budget.
Analytics in Cloud Computing
Is cloud computing suited for analytics solutions? There are some areas of analytics solutions where cloud computing makes a lot of sense, particularly when you need cheap storage and cheap processing power for very large data processing tasks. However, the risk perception of data loss and data breach will probably keep the complete analytics solutions from using cloud computing. The niche players in cloud computing that offer analytics solutions are actually very attractive and should be looked at. There are several startups that offer price optimization cloud-based solutions or smart-meter energy usage forecasting.
This area of analytics has a lot of potential because entrepreneurs having depth in any industry can invent newer Big Data solutions, develop them once in the cloud, and offer them as SaaS. They can receive data on a regular basis, process it, build and tune client-specific models, and then run their transactions through them. The data input and output mechanism is actually well structured since the SaaS solution knows all the various performance variables and characteristics it needs. With the infrastructure in place, the SaaS vendors can try newer value propositions out of the same data domain and keep inventing and extracting more value out of data, while the client can use that output innovatively into decision strategies and maintain a competitive edge even when they are using the same SaaS as their competitor.