Analytics Organization and Architecture
Contents
This chapter covers two topics—organization structure and technical architecture—the final pieces in building a strong team and foundation for analytics projects in an organization. The purpose and theme of these two topics remains consistent with the rest of the book and are focused toward simplification and democratization. Both the organization structure and technical architecture are built on top of the existing data warehouse organization and architecture.
Organizational Structure
The methodology presented in Chapter 9 covers the steps needed to implement analytics projects. The idea is to have a hybrid (centralized/decentralized) team structure that can deliver analytics projects for all departments as a continuous activity, even handling multiple projects at a time. An organization structure required to accomplish that would be a matrix organization and is built combined with the data warehouse team structure. This would set up a business intelligence competency center (BICC) responsible for implementation, including data warehousing, analytics, and decision strategies across the entire Information Continuum. It is highly recommended that analytics teams work in close proximity to the data warehousing teams because of the overlap in knowledge, skills, and technology. If the enterprise data warehouse team already has a formal structure closer to the layout of a BICC, then it should be simply extended to include analytics implementation as part of their responsibility.
The following are some suggestions and explanations for organizations to adjust their existing environments. It is not required to whole-heartedly adopt this exact structure, but it is important to understand the dependencies and overlap, and then work out a plan to slowly converge toward this end-state.
BICC Organization Chart
Here is a proposed organization structure of the BICC (Figure 10.1) with five centers of excellence dealing with:
■ ETL (the overarching term referring to all aspects of data in motion)
■ Business analysis (collectively refers to data, analytics, and requirements analysis)

This is a direct reporting hierarchy with BICC having management responsibilities and budget for this team, while a charge-back structure could be put in place for project assignments. Analysts prefer to have direct reporting into the BICC, but they should have a dotted line back into the business functions as a liaison to develop specialization in the functional areas and understand the opportunities and difficulties. This will help ensure the application of the Information Continuum can be identified at the appropriate level and a project created and delivered for ongoing value. This would also allow the analysits to become more familiarized with the technology and implementation complexities.
In addition to the core team of the BICC, there are additional skills needed to effectively build and deliver analytics solutions (Figure 10.2). These skills are enterprise in nature, meaning other aspects of IT development and support also share these skills. Since analytics projects will always put IT infrastructure to the test with large historical data sets, complex transformational programs, and massive data processing throughput needed to build and test models, these additional skills need close alignment with the BICC. These include:
■ Database administrators (DBAs) responsible for database management.
■ Technology infrastructure (dealing with data centers, servers, storage, etc.).
■ Project management. Analytics projects are going to need project managers and, instead of building their own capability, some designated project managers specializing in analytics should be used who are part of the central project management office.
■ Quality assurance (QA) and data governance. Similar to project management, the centralized QA team responsible for all development activities across IT should be used instead of building one from scratch with some specialization analytics.
■ Information security. It is expected that a robust data warehouse implementation will have addressed the information security framework around data and reporting. That capability should be extended into analytics and decision strategies.
■ Compliance, audit, and control. Both compliance and internal audit teams have some oversight on data warehouse although their focus is typically operational systems. However, unlike data warehouse, an analytics project involves decision strategies that impact day-to-day business activities, and therefore a new specialization within compliance and internal audit teams may be required.

The BICC should be connected to these additional organizational capabilities through projects, where each analytics project engages these teams and ensures the project is aligned with their mandate. In situations where that is not possible, such as technology infrastructure and DBAs who have to engage at all times to keep the deployed systems running, a formal roles responsibility and handover mechanism should be developed.
Roles and Responsibilities
The material in this book does not necessarily concern itself with data warehousing teams, skills, and implementation. Rather it recommends that existing building blocks already in place within data warehousing teams, technologies, and databases should be used to fast-track implementation of analytics projects and therefore build on top of a data warehouse. With that approach it would make sense to have the new analytics organization tightly knit into the data warehouse organization. However, the roles, responsibilities, and deliverables that are specific to data warehousing are not ironed out in detail. A lot of good material is available from authors like Ralph Kimball (2008) and Bill Inmon (2005) to cover the detail on the data warehousing side. This section will only cover the roles and responsibilities as they pertain to analytics projects.
ETL
As mentioned in previous chapters, ETL stands for extract, transform, and load, and it is used as a noun in this book. It is a term that was coined in the mid-1990s with the advent of data warehousing. The idea was to take operational data out of the transaction systems and move it into a separate database called a data warehouse for reporting and analysis. This massive undertaking of extracting all the data out of the operational systems, most of which were legacy database systems that relied heavily on file-based structures, into a new data warehouse required a methodical approach and a tool that simplified the task. Therefore, extract (from files or legacy database systems), transform (into a more integrated and structured form using relational databases and applying data quality and business rules), and load the data into a data warehouse.
In the context of this material and the modern shifting definitions, the more batch and file–oriented ETL has been transformed into a more robust high-performance, parallel-executing, real-time integration suite. So the term ETL is used here to refer to the entire capability of moving data of all sizes in a fast and reliable manner from one place to another—that is, data in motion. The data could be in batch or real time, scheduled or event driven, files or single transactions, and also provide audit and monitoring capabilities. This can be achieved through an integrated suite of tools from one vendor or a collection of tools from multiple vendors.
Within ETL, there is always an architect who is responsible for designing the overall environment and looks at all the jobs, their dependencies, their error handling, their metadata, etc. ETL has two flavors: the design and development, and the scheduling and execution. The architect is responsible for designing the environment so consistent development methods like shared staging area, common methods of key generation, look-up of shared referenced data, retention of processed data, or files and naming conventions are consistently followed across all types of data movement activities going on within various projects. The other piece of an architect’s role is performance, job dependency map, and the error and restarts design necessary for a large and complex ETL schedule. The flavor of ETL specializing in analytics solutions has been covered in Chapter 5 on decision automation. The ETL team is an essential part of any data warehousing operation, and they usually have a preferred ETL tool to design, develop, and execute ETL routines to move and manipulate data. The trick is to break down the specific data movement tasks within an analytics solution and hand the tasks to existing teams that specialize in certain areas. However, one ETL team should deal with all projects across the entire Information Continuum.
Data Architecture
The primary responsibility of the data architecture team is building data models. Ideally, the same team should be building data models for all types of systems across the entire Information Continuum, from operational reporting to data warehousing and analytics. A data model is at the center of data movement and data access, and therefore it is best positioned to define and manage the overall metadata for any data-centric project. Some examples of metadata that needs to be tracked are:
■ Source system field definitions.
■ Source system business process to field mapping.
■ Any transformation and business rules at the field level.
■ Aggregations and performance variable definitions.
■ Mapping of fields from the source system, to the data warehouse and reporting, to the analytics datamart, to the predictive models and decision strategies, to auditing and monitoring the database (called data lineage).
Since the data model inherently captures the data dependencies and brings together the nuances of various forms and data types, the data integration rules have to come from the data model. Without fully understanding the data, models cannot be built, and without a target model, transformations and integration logic cannot be built. Therefore, it is recommended that these three functions belong in the same team. More detailed data modeling techniques and theory around abstraction and database designs are beyond the scope of this book. If a robust data warehouse is in place, then a mature data architecture team, technology, and process have to be in place. Investment in metadata management is always a tough business case, and therefore is practiced in a fractured and sporadic fashion in most data warehouse implementations. In analytics projects it is central to testing and validation of decision strategies where the entire Information Continuum comes together to carry out a business decision with little to no human intervention. If the knowledge of the data fields, their origin, and their transformations are not evident, the business will never sign-off on trusting the automated decisions.
Business Analysts
Business analysis and requirements gathering or extraction for analytics projects have been covered in great detail in Chapter 8. Traditional business analysts within data warehouse teams, their skills, and best practices are beyond the scope of this book; that material is extensively covered by authors like Bill Inmon (1992) and Ralph Kimball (2002) among various others.
Analytics
The analytics group is a new addition to the data warehouse team and capability. Within this group the following new capabilities need to be established:
Analytics Modeling
The analytics modelers have traditionally been statisticians usually with advanced degrees in statistics and mathematics. The financial sector has attracted a huge chunk of this knowledge and skills base in the last 15 years. A wide range of applications in forecasting, prediction, and decision optimization have been in place since the 1950s (May, 2009) where these modelers (also known as quants within the investment banking community) have been building statistical models for economics, finance, manufacturing, etc. They are very expensive and are usually highly specialized in a particular problem domain. In large organizations they appear as a silo with a magic box from where decisions come out. Financial losses, rogue traders, and systemic risks are issues that crop up when these modelers work with a black-box approach with limited visibility, understanding, or transparency for management. To understand and audit what they do, you have to have an advanced degree in statistics.
The advent of artificial intelligence has created an alternate school of thought where machine learning and software based on data mining techniques are able to tackle newer problems having unprecedented data volume and processing requirements. Data mining underneath is still mathematics and statistics implemented through software programming, but it abstracts the underlying mathematical complexity from the user. The current statistics- and mathematics-based analytics include disciplines such as:
■ Linear/nonlinear programming and numerical analysis or even differential equations
■ Other areas of applied mathematics like game theory and cryptography
The use of analytics modelers has been limited to a handful of specialized areas and they are never embedded in a data warehouse team. They tend to do their own data sourcing, their own evaluation of variables, build their own analytics datamarts as standalone systems, and build and deploy their own models. The decision strategies are typically communicated as a document or as a set of instructions to the staff responsible for making decisions. In this climate, they cannot tackle Big Data problems because of the sheer size and scale and also work with well-defined variables within their problem domain. It is extremely difficult for them to try out new data sets and new variables just to see if something useful jumps out, as their skills are confined to a handful of people who complete the end-to-end tasks.
The comparison in Figure 10.3 shows how the current analytics environment functions and why it cannot scale to either the Big Data challenges or democratization demands from other business units. We have been arguing and making a case for the alternate approach as it is easier for adoption across all parts of the organization. The statistics-based specialized analytics modeling will remain confined to a handful of areas where organizations have the appetite for having a dedicated solutions team. That would be outside this organization structure. The analytics modelers are the people building the actual models using data mining software, and therefore need expertise in the tools being used in the organization.

Analytics Technology
The analytics toolset along with its specialized databases, audit and control requirements, and the metrics and thresholds require a full-time analytics team to manage the technology. This team will work closely with the data warehouse technology teams and the infrastructure teams. If specialized analytics software has been purchased like SAS (2012) or SPSS (2012), this team will be responsible for installation, support, and ongoing production monitoring and operational SLAs for that software, as well as development support, tuning, configuration, and deployment of models.
Decision Strategy
A specialized team will be needed to support the existing and new strategy development, tuning, and audit. If a decision strategy tool is purchased, the analytics technology team will support the tool while the decision strategy team will be its user community. This team will work closely with the business and help them build strategies and provide feedback on strategy performance. They will maintain the generations of strategies and keep running champion–challenger analyses for the business, as well as carrying out simulations on decision strategies.
Information Delivery
The information delivery group or team is usually in place within the data warehousing team and is responsible for report development and execution. Two new additions to this team are necessary: one for specialized analytical application development like visualization and GIS mapping–based analyses, and the other for developing the integration with the operational systems for strategies and analytics output. Report and analytical application development is out of scope of this book, however the operational integration of decision strategies has been covered in detail in Chapter 5 on automated decisions.
Skills Summary
The new skills required above and beyond data warehousing skills would be in the following areas.
Analytics Analyst
The analytics analyst will have to have a deep business understanding before a conversation can be initiated with the business. The following are skills needed by an analytics analyst:
■ Analytics problem patterns (as suggested in Chapter 3 on using analytics)
■ Understanding of the four analytics methods
Analytics Architect
The analytics architect’s role is an extension of the data warehouse architect role. The conception of the overall analytics solutions, including data from the data warehouse, design of the analytics datamart, implementation of decision strategies, and operational interfaces, all need to be holistically placed in one solution. Additionally, there may be multiple solutions being designed and implemented simultaneously, so it is important to ensure that resources are not overlapping and duplication of effort around same data is not occurring.
Analytics Specialist
The analytics specialist is the analytics modeler and should be well versed in the toolset being used, be it a specialized software or database in-built analytics. Additionally, the analytics specialist should have extensive database knowledge and the ability to guide developers to write programs for data cleansing, data manipulation, sampling, data integration and aggregations, etc. On top of that, the most important skill is the ability to validate and test models, identify their weaknesses, add and play with additional variables, and tune parameters available within the analytics software to build a robust model.
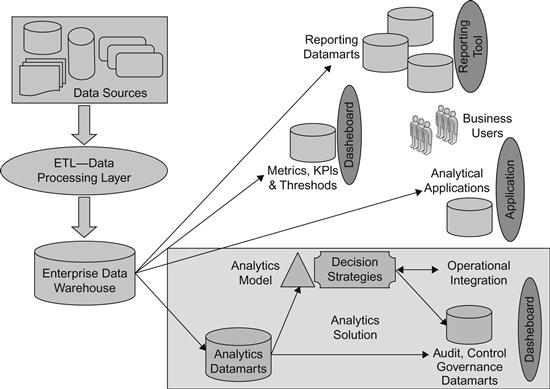
Technical Components in Analytics Solutions
Figure 10.4 depicts a typical technical architecture for an analytics solution built on top of a data warehouse. The implementation detail of all the components in this figure will not be discussed in detail as data warehousing resources are filled with in-depth design and implementation guides for these components. We will only concern ourselves with the analytics datamart.
Analytics Datamart
The term datamart became part of the mainstream data warehousing and reporting industry right after Ralph Kimball introduced the world to dimensional modeling (Kimball, 2002). It is defined as a subject area–specific collection of dimensions and facts like a sales order datamart, a billing datamart, an employee benefits datamart, a loan datamart, etc. It used to imply one fact table and various relevant dimensions. With design maturity in the industry, datamarts could handle multiple fact tables like aggregate tables in addition to fact tables at the lowest grain. An example of multiple fact tables within a datamart is a help desk ticket datamart where one fact table is at the ticket’s grain (one record represents one ticket) and another can be at the ticket status grain. Datamarts built like that are read-only from a user perspective.
The definition of a datamart evolved with more specialized and data-centric software packages like anti-money laundering, pricing, or campaign management. There is usually a need for creating a separate database fully loaded with the relevant data needed for the software to operate. An ETL process is needed to extract data either from the data warehouse or from the source systems and load into this specialized database structured to support the software package. This is also known as a datamart because it is a specialized collection of data that can span multiple subject areas, but it is not necessarily built as a dimensional model and is used for more than just reporting. This definition of a datamart has data with both read–write functions and varying grains of data in the same datamart.
An analytics datamart refers to this later definition. It is basically a collection of all relevant data needed for an analytics solution to work. This would include the lowest grain detailed data, summary and snapshot data, performance variables, characteristics, model outputs, and the data needed for audit and control—any type of data relevant to the solution needs to be designed and stored in the analytics datamart.
The analytics datamart has four distinct subject areas within its logical construct. A solution-specific implementation may have a different physical manifestation of these four logical constructs. So a solution architect may decide to create two separate databases to house two logical constructs each. The constructs are:
Base Analytics Data
The base analytics data includes all relevant data needed for the analytics model. But what constitutes “relevant” is an interesting open-ended question and the first area of design that requires some art form in addition to the science. Let’s say we are working on a logistics predictive model where thousands of shipment orders move through the system and we are trying to predict the likelihood of a shipment order being delayed. Every shipment order passing through the enterprise will be scored based on a probability of delay and higher probability orders will be handled through a dedicated service and handling staff to ensure appropriate communication to the client and possible rerouting. With this problem statement, what should be the relevant data that the analytics datamart should pull in from the data warehouse?
If we limit ourselves to order and routing data only, which would be the typical subject area definition for this problem statement, then we may or may not find good predictive patterns of data. It is recommended to use data from other subject areas to increase the breadth (number of fields) and depth (number of records) as much as possible to give the analytics algorithm a strong chance of finding the patterns most effective in predicting the outcome. In the regression-based traditional predictive modeling approach, a set of fields is evaluated for its discriminatory power in separating good and bad data (good in this case would be orders delivered on time and bad would be orders that were delayed). But exposing hundreds of fields to regression to find the good predictors and put their relevant weights into a model is a tedious iterative process, therefore usually that approach limits itself to well-known fields within the tightly linked subject areas. In this case, let’s use the flow shown in Figure 10.5 to illustrate the life cycle of a package through the entire shipping process.

This simplified view of the package shipping process shows how the package moves through distinct stages from start to end. At each stage, a different set of data records are created and different data fields are populated or updated. The following subject areas (logical grouping of linked data) are in the shipping business process:
■ Customer management (invoicing and payments)
■ Package receiving (location, package label, invoice number, destination, etc.)
■ Package routing (hops the package would take)
■ Package transportation (truck, route, intermediate hops, tracking current location)
Throughout these data sets, there is overlap. For example, when a customer creates a shipping label at home and when the package is dropped at a location, the two data sets have some common overlap allowing for the company to link customer and payment to the actual package. Similarly, when the package is delivered, it requires a link back to the customer’s email or phone to send the acknowledgment.
The definition of a subject area can be as granular as presented in Figure 10.5 or it can simply be just two subject areas: customer and package. Regardless of how many subject areas the data set is broken into, the combined data set is required for the predictive model to work. This is the science part of analytics. The art comes into play when you look at additional subject areas that may apparently have no direct impact on the delay of a shipment. This is what we would like the data mining tool to figure out. The additional subject areas could be:
■ Human resources and shift assignments
■ Truck and vehicle management
These subject areas are not actually tied to a specific package, but to the operation of shipping overall, and they can have an impact on the delay of a shipment. Sometimes looking for common patterns in delayed shipments is more difficult than finding the common pattern in on-time shipments. This is up to the data mining algorithm to figure out, and various implementations of data mining algorithms vary in their approach to this problem.
Therefore, base analytics data should include the preceding subject areas when data is pulled in from the data warehouse. If some of this data is not in the data warehouse, it should still be routed through the data warehouse using the common ETL, scheduling and governance teams, process, and infrastructure. Any time and resource considerations (coming from workload on the data warehouse teams) should be trumped in favor of a more integrated approach, because creating a data silo sourcing directly from the source systems is going to have problems when we build performance variables, build strategies, and try to prove that the model performs well. There can be additional subject areas available in the data warehouse, such as human resource data or the company’s financial data, that one can argue may further help the model and should be included. This is a judgment call and no right answer exists. In this particular example it may be irrelevant and the other subject areas are enough to start the performance variable build process.
A few additional considerations for the base analytics data include:
■ Data should be kept up to date and tied into the data warehouse load schedule.
■ No new surrogate keys are needed, and the grain and key structure should be tied to the data warehouse.
■ The design technique should also be in line with the data warehouse (Kimball versus Inmon).
■ ETL, scheduling, metadata management, and governance should be aligned tightly with the data warehouse processes.
■ The lowest level of detail is preferred; if summary data is also present in the data warehouse for the same subject areas, it should be left out.
■ Historical data changes (commonly known as slowly changing dimensions) design principles should be enforced in the analytics base data even if the data warehouse doesn’t have that feature for the subject areas of interest.
Performance Variables
Once the base analytics datamart is complete, attention shifts to performance variables. Performance variables are basically aggregate data fields that help the data mining algorithms identify common patterns where detailed data may not be much different between various types of scenarios. Since the prediction is on a package grain (meaning one record per package is assigned a probability of delay), performance variables factor in events before and after the package record. For example, each package has a truck assigned to it and this information may not reveal any interesting patterns discriminating between on-time and delayed shipments, but if we actually look at where the truck was before it got assigned to the package, we may find out that a higher probability of delay mostly occurs when a truck starts its shift. Another example could be of a collection of packages that when put in together causes one of them to be delayed. This information is not available in the package subject area when we look at one package record at a time. So we have to build performance variables to capture the overall state of the package with a context, and sometimes that is where the hidden discriminatory pattern lies.
Chapter 11 explains some of the common techniques and methods of building performance variables, but this is also an art form. The more creative the performance variables, the better the chance for the data mining engine to find something interesting that has a higher discrimination value between good and bad. There are three types of performance variables:
Reporting Variables
Reporting variables are the most simple to build. Review the data warehouse reporting layer to see what kinds of reports are consumed by the business on the subject areas that are of interest for the analytics problem. In this case, we’ve listed the subject areas earlier in the chapter. Take a look at all the reports that use these subject areas and start documenting the variables created specifically for the business using the detailed data. Work with the business users and the subject matter experts (SMEs) to understand what those variables are (typically metrics), how they are computed, and, most importantly, how they are used to derive business decisions. This part of the summarized data may already be in some datamarts or implemented in the report program. The analytics datamart will have to reimplement these matric variables if they are not available as a simple extract. Sometimes it is better to reimplement them so that the analytics team can fully understand how they are being computed and get ideas for more interesting variables along the theme of these metrics.
Third-Party Variables
Third-party variables are aggregated pieces of information that may not be in the enterprise at all. This data should be pulled in directly into the analytics datamart since it may not serve any purpose for maintaining it in the data warehouse. Also, the acquisition of this data may actually cost money. Examples here would be demographics data, road closures, weather data, traffic data, or any other hazardous or perishable material packaging data that may come from typical customers who ship packages containing that material. A one-time data pull should be sufficient initially, and if the training model starts to rely on that data, then a permanent integration interface may be necessary. Most shipping companies rely on GPS and traffic data for their live rerouting and estimating delivery times, so this may not be that difficult to acquire.
It is preferred to store this data as an aggregate rather than a detail. For example, traffic updates may be available every few minutes and weather data may be available every few hours. We may have to build typical weather data and then build a scale of adverse weather from 1 to 5, and the same for traffic. If that data is not currently used, then historically delayed shipments will not have this data available. This is a challenge, because even though historical data is not available, it seems to be a useful set of variables and can certainly be made available to go live. If there is a way to estimate this accurately for historical shipments, then this is useful, otherwise it is not. The training data has to have this so the model can learn its impact on delayed shipments and then apply the weights when actually computing the delay probability on a real-time basis.
Aggregate Variables
This set of variables is where the art form comes into play. The aggregation of base analytic data results into variables that can influence the model significantly, and if they don’t, more innovative variables can be created. The aggregation can be an on-time series, meaning roll-up of detail data along time and then assigning it to the package record. It can be sequence based, meaning the order of events, steps, or stages are rolled up to be assigned to each package record. They can be aggregated along frequencies of occurrence and along volumes (sums, averages). Aggregation can also be coded by introducing new code forms, for example, a shipment starting before 9 a.m. can be coded as “early” and a shipment starting at the employee shift end can be coded as “overtime.” Another form of aggregation is looking for a specific pattern and setting a flag to be “Yes” or “No”—for example, if the traffic delays never went beyond 20% of the typical travel times, then a flag can be set to “No,” indicating if traffic delays were encountered.
Model and Characteristics
The next component of the analytics datamart is the storage of the actual model and its characteristics. Building or training of an analytics model is an iterative process. We start by building one model based on a judgment call. Then we validate that model for its accuracy and false positives (i.e., declaring something to be bad that turns out to be good). Once the model starts to perform at a reasonable level or accuracy, it will move into production. Then, three months later, another test will be performed to see if the model is still performing at an acceptable level of accuracy. If not, it will go through a tuning exercise, which is very similar to the original model building exercise but a little more focused. This entire exercise has to be recorded in the analytics database. Once the team becomes comfortable with the model creation, validation, and tuning, previous generations of the model can be archived and do not need to be stored in the analytics datamart.
As explained in Chapter 4 on performance variables, the characteristics are variables that have shown a higher discriminatory value for identifying good versus bad data, therefore a performance variables data model within the analytics datamart may have hundreds or even thousands of variables, but a model may not use more than 20 or so. This model and characteristics component will only record the variables that have qualified to be characteristics. The models will be maintained as a generation and their proper version control naming will be recorded in the database. Once the training data has been prepared, it will be stored in this component. As the model going through the iterations keeps changing the characteristics it uses, this database has to track that as well as validation results. If the data mining software provides weights out of a trained model, then that has to be stored as well.
Model Execution, Audit, and Control
Once the model is ready and moved into production, as real-time or batch transactions come in that need to be predicted, the incoming characteristics and the predicted output both have to be recorded within this component. This is important from an audit standpoint as to which model was executed on a particular transaction and what probability was assigned. The need for this audit review can occur even after several months and years. Particularly in credit analytics, a loan that was approved based on a low probability of default may actually default after two years and a review may be required going back two years to see why it was approved.