Requirements Gathering for Analytics Projects
Contents
Requirements: Historical Perspective
Analytical and Reporting Systems
Analytics and Decision Strategy
Working Example from Consumer Credit
This chapter addresses the challenges of gathering requirements in an analytics project. This is challenging since a business has probably never seen anything like it and might not know exactly what they want to accomplish. In Chapter 8 we relied on a pilot project to make a case for an adoption of analytics; this chapter shows how to convert that into requirements for an analytics project.
Purpose of Requirements
The purpose and significance of requirements in traditional IT systems development is many fold. For example, requirements are used:
1. To act as a bridge between IT and business communication.
2. To provide information on what exactly the system should do.
3. To give users the ability to test the system against expectations.
4. To determine the degree of success and failure for IT as perceived by the business.
Will this be true for analytics systems as well? What exactly is the role and structure of requirements in analytics solutions and how do we adjust the current requirements gathering practices covered in this chapter?
Requirements: Historical Perspective
To illustrate the unique challenge of requirements gathering, analyzing, and formalizing in analytics solutions, it is important to take a quick trip down history lane to see how requirements management has emerged and formalized. The establishment of computing as a mainstream tool for useful applications can easily be attributed to Enigma, a cipher machine used to encrypt communication used by several government and military institutions across Europe and North America. During the Second World War, German forces were widely using Enigma to encode their communication and Allied forces countered that by developing Ultra, which was a code-breaking machine (Lewin, 2001). Both these computing machines were calculation engines and contributed toward establishing computing as a dominant tool in solving complex equations. The use of computing by military and governments remained confined to areas where large and complex calculations were required. The use of computing machines allowed for faster computations and lower error rate than humans.
These computing programs were actually software in a very basic form compared with software packages of today and, therefore, the requirements were the mathematical equations behind the computation programmed into the machines. There was no distinction between business and IT in those days. Scientists were primary users of computing machines, and they built the machines’ hardware, designed and wrote the software, and ran the system (hardware plus software) to solve computation problems. No formal requirements were necessary. As computing matured and moved into the commercial arena, the separation of IT and business started to emerge. Financial firms, government and military agencies, and their suppliers started purchasing specialized computers from vendors. Now, the users of the system were separated from the builders of the system. This created a translation gap between the problem and the solution.
ADP was among the first companies to adopt computing to generate payroll and print checks. ADP bought specialized machines that would compute payroll, taxes, benefits, etc., and then print checks for their clients (ADP Corporation, 2012). ADP was neither IT (building the system) nor business (ADP clients specified what they needed). This analogy is important to understand the role or purpose of requirements. ADP acted as the translator between what their clients needed and what they wanted the computer manufacturer to build for them. They owned, analyzed, developed, and published the requirements and then managed the operations built against the requirements.
Since those days, computing has evolved from calculations to process automation leading into data analysis and analytics. How has the role of requirements changed through this evolution? Figure 8.1 shows the evolution of computing from calculation based to the analytics of today.
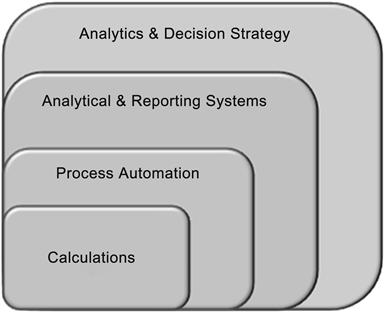
Calculations
The Enigma and Ultra machines belonged in the innermost section of Figure 8.1—that of calculations. Various other implementations used for scientific computation also belong in this space. Systems belonging to this section are usually built for massive computations that cannot be undertaken by people in a meaningful timeframe and with a reduction of errors. In the 1940s and 1950s, with these calculation systems, businesses (users of the system) and IT (builders of the system) were the same group of people, and therefore no formal requirements were needed. People well versed in mathematics, electronics engineering, and computer science worked side by side as a team to implement these systems.
Even today, there is plenty of evidence of this type of approach for solving specific problems in meteorology, nuclear science, mining, and metallurgy, and increasingly in Big Data where purpose-built machines have to be engineered using commodity components. In such scenarios, hardware, software, and domain experts work side by side to build such machines, and therefore formal requirements are not needed to bridge a translation and expectations gap. In places where the problem domain is specialized, such as government’s census bureau, central banks, departments dealing with statistics, etc., they have to deal with IT and business as two separate entities, but the problem domain is simple since the application of computing is limited to calculations, not to carry out all of their functional activities.
The four points that made up the purpose of requirements are:
1. Requirements have no need to act as a bridge between IT and business communication since both roles are with the same people.
2. There is no need to formally document what the system should do since there is little ambiguity within team members about the purpose of the system. All participants are trained in the same discipline.
3. The testing is also carried out by the builders since output is the result of the calculations.
4. The builders and the users both understand the degree of success from the project looking at the results.
Process Automation
The ADP solution belongs in process automation space and dominated the computing and IT industry from the 1960s to the 1980s. In the 1990s, this was taken over by ERP (enterprise resource planning) systems. In process automation, the requirements capture the current business processes and any changes desired by the business. The requirements capture, analysis, rationalization, and overall management of requirements and the skill to carry out these functions are well established and requirements documentation methodologies are fairly mature. Therefore, requirements gathering and analysis became a formal discipline in process automation that relied heavily on documenting how things work today. The requirements process would document the existing operations and activities and then design a system to automate that process. Various requirements gathering tools and techniques have been developed and are widely used. In fact, whenever the discipline of requirements gathering and analysis is reviewed today, it refers to this category of requirements within process automation space.
Analytical and Reporting Systems
Process automation uses computing to automate all paper and information flow. As it accomplishes that, it creates data as a by-product. Analytical and reporting systems rely on this data to build a different kind of system that requires a different kind of requirements gathering approach. In the case of process automation, the knowledge and expertise as well as the obstacles of the existing manual processes are well understood by the business. That knowledge becomes the requirements of what the process automation system should do. For analytical and reporting systems, the challenge is that there is no manual or legacy precedent that can be used as a set of requirements. Therefore, the requirements gathering process actually becomes the requirements extraction process, where the business is shown what is possible and they determine what would make the most sense for their organization. This is why it is common to see requirements change dramatically once a data warehouse system is rolled out. Immediately, the business starts to get ideas on what can be done. The requirements extraction process therefore requires considerable knowledge in
■ Specific business processes under consideration.
■ Data and its interrelationships within those business processes.
The effective requirements extraction process requires people well versed in the business and the wider industry, as well as data used within that industry. For data warehousing, typically a set of legacy reports are used to initiate the design and a datamart implementation. Once the ease and effectiveness of the reporting from a data warehouse is evident, the users (usually the savvy ones first) come back with more sophisticated requirements. This is the only way to move up the Information Continuum to get more out of the information asset of an organization.
The requirements gathering process for such systems requires questionnaires and explanations of advanced concepts in historical data analysis, metrics and their thresholds, time-period comparisons, snapshots, trends, and the need for cross-departmental or cross–subject area information content. These concepts are explained to users within the context of their business process and the data they deal with in their normal execution of duties. Once they understand the possibilities, they are better able to articulate their requirements. This approach puts pressure on the analysts tasked with extracting the requirements since they have to be masters of the nomenclature, holistic business perspective, existing systems and processes, as well as data within those systems. Additionally, they should also have the prerequisite knowledge of surrounding business processes that act as input or receive the output of the process under review.
Analytics and Decision Strategy
The analytics and decision strategy requirements are more complicated than reporting systems. This is for several reasons:
1. Overall, the leap for analytics into mainstream is in its infancy.
2. Analytics is not part of the mainstream manual processes so no precedent exists.
3. Use of analytics is limited to small specific problem areas.
4. The application of analytics cannot be limited to one business process at a time; it tends to look at a group of business processes as a whole.
5. The data needed for a useful analytics solution is never known upfront and a lot of domain knowledge and trial and error is required to identify the data that may be useful.
6. Analytics-driven strategies are nonexistent unless the analytics model is in place.
7. Benefits of analytics is dependent on various factors, including the creative strategy design and the effectiveness of the model for those strategies.
Based on these reasons, extracting the requirements is more challenging because skilled personnel in the business domain, integrated business processes, and understanding of data and areas of opportunity are not easily available, if at all. If the requirements extractors are not available, and since we already established that a typical requirements gathering approach is not an option, we are left with no requirements for IT to build an analytics solution.
Requirements Extraction
To surmount this challenge of requirements, we will work with the analytics requirement strategy that is covered here. In Chapter 2, there was a hierarchy of information needs where the use of data was shown to move toward higher business values and overall benefit to the organization. The requirements extraction for analytics relies heavily on that hierarchy through a series of questions, such as:
■ What kind of data do you search for? What is the typical business reason for that search? What should be done if more than one search result is sent back?
■ What kind of summaries and counts matter to your business functions? What do you do with those counts? Do you compare them to some other numbers? What happens if the numbers are too low or too high?
■ Who reviews these reports (existing and available reports)? What are they looking for in these reports? Do they change the filters, sorts, and groupings?
■ What kind of summary and aggregate reports or historical snapshot reports are used? Where does the data come from? How come one data type is reviewed like this but not another data type? How much data is retained historically? Is it purged or archived afterwards?
■ What metrics matter to the business? How are the metrics related to business objectives? What is the calculation that goes into the metrics? Does everyone agree to these metrics and their definitions?
■ What about users outside of the department who use these reports—who are they and why do they use these reports? How do the reports impact them?
■ Are there any dashboards in place? Are there any geographic information systems (GISs) or other type of analytical applications in place?
It is evident that these questions follow the Information Continuum hierarchy and levels, and provide analysts with a structured approach to familiarize themselves with the levels before the analytics models. This is a line of questioning that allows an analytics business analyst to understand the following:
■ Business processes involved.
■ User and business sophistication.
■ Important data entities. A data entity is a loose term referring to a certain data type, such as a customer is a data entity and name, address, and age are the attributes. Order is another data entity and order number, order date, ship date, and order status are the attributes.
Most importantly, this line of questioning establishes where the users fall on the Information Continuum. If they do not reach the prerequisite level as shown in Figure 8.2, then the business may not be ready for an analytics project, or the challenges or risk of a project’s success increase significantly. This is where you may end up with a project that spends money and builds a lot of learning but the business may not benefit as much as it could if the business division, department, or group was at a higher level of sophistication on the Information Continuum. Sometimes this is good for IT personnel, but not very good for business, as the unimpressive results may leave a bad taste for analytics all together and it could be a while before a renewed interest in analytics is developed.

Problem Statement and Goal
Once it is established that the business is ready for analytics and has been dealing with historical data, metrics-based decisions, and has some idea on trends of the metrics year after year, the business analyst takes the lead in formulating a problem statement (see Chapter 3 on using analytics). The business analyst responsible for gathering requirements for an analytics project is expected to have sound understanding of the four analytics techniques to a point where their application can solve a particular business problem. The business analyst can explain these concepts in the context of the business process and ask questions, such as:
■ What is the metric you use to measure the effectiveness of your operations?
■ Is there a way to forecast that metric for future periods? How would you use that information?
■ What if a certain value of the metric can be predicted? How valuable is that?
Similar to the metric, the same line of questioning can be performed on some of the heavily used reports. It is important to understand what the reports are used for, how the information in a report impacts the day-to-day operations, and what pieces of data in a report have an impact to the business because of their spikes and dips. Business analysts in the reporting and analytical systems usually stop after collecting the report layout and definitions and convert that into requirements against which data warehouse systems are built and run, but rarely do they actually try and understand how the changing information in the reports impacts the business.
The requirements extraction process starts with that analysis to identify important data and then formulate a problem statement using any of the four methods of analytics to see if the business can make use of that analytics output. This method is less science and more art and innovation, and this process of business analysts interacting with business users to extract an innovative use of analytics from their existing known data is an important process to master.
Newer kinds of data like tweets, cell phone–to–cell tower signals, RFID tag readings, social media interactions, location check-ins, likes and shares, etc. pose a new problem for requirements extraction because of the sheer volume and nature of its use. The use of that data has to follow the same Information Continuum, but the pace needs to be weeks rather than years in the current scenario. Some may argue that this new data type should enter directly at the higher levels of the Information Continuum, but that may result in isolated success depending on the creativity of the user. There are two reasons why this newer form of data (also dubbed Big Data; see Chapter 11 for more detail) has to follow the Information Continuum:
■ The organization as a whole can learn to benefit from using this data if it follows an evolutionary path. This is similar to how customer-complaint data was not important to purchasing or wasn’t even available three decades ago in a form that could be used. When that data was finally brought in to the fold and followed the evolution along the Information Continuum, various other existing data pieces realized the value of using the additional information, and purchasing started to look at defects as another factor in selecting vendors and bids. So, intermixing of existing data with Big Data can only happen if an evolutionary path is followed.
■ If an evolutionary path is not followed, the benefits of Big Data will be isolated and sporadic where the individual brilliance of people will yield results but the wider benefits will be limited.
Therefore, the existing data has to fit into analytics using a process that includes some science (existing reports and metrics, and existing use of that data) and some art (where can the four methods of analytics help the business). Nowhere should analytics be taken as a brute-force approach and run on data, because then there is no guarantee what you will find and, whatever you do find, how to use it for business value. Granted that with Big Data, the speed of traversing the Information Continuum through the evolutionary process has to be very fast and sometimes data discovery–type approaches come in handy. But the data discovery really breaks down into one or more of the following options:
1. Geo-spatial analysis of the data.
2. Visualization of the data, such as in 3D or other forms of display within Euclidean geometry.
3. Data profiling (usually showing the mean, mode, frequency, minimum, maximum, distinct value, etc.) of fields.
4. Some basic correlations between variables that a user identifies.
Data discovery should be used to speed up the process of moving up the Information Continuum, but should not be treated as an end-all for identifying the data that matters before starting to apply analytics on it. The requirements extraction process should be able to identify the important variables through this type of interaction and review with the business.
Working Example from Consumer Credit
A small bank has a loan portfolio that looks like the following:
| 2,000 auto loan accounts | 1,800 unique customers |
| $30,000,000 total loan originally given out | $23,000,000 still outstanding (being repaid monthly) |
| $750,000 in default | 40 accounts with 40 unique customers in default |
| $1,500,000 in 30- to 90-day delinquency | $450,000 collected last month from default accounts |
| $1,000,000 total profit in the last 12 months | $150,000 written off as loss in the last 12 months |
The branch loan officers who sold the loans, the risk manager, the collection supervisor, the finance department, and executive management all consume this data on a monthly basis at any lending institution. Various reports are generated that provide pieces of this information to the relevant users. The branch loan officers who sold the loans are interested to see which of their sold loans are in trouble. The finance team and executive management are more concerned with liquidity, bank’s capital adequacy, provisioning of loss amount, and overall impact to the bottom line. The risk managers constantly review the reports, data slicing different segments and variations to see how to better structure the lending policy. Collections goes after the people who owe money and tries to maximize the collection amount against the collection effort. The Information Continuum looks like the following with examples on the same data presented above:
| Search and look-up | Ability to look up customers to call for payment reminders. |
| Counts and summaries | How many accounts in 30-day delinquency are broken up by zip code? What is the total amount stuck in 90-day delinquency for provisioning purposes? |
| Standardized reporting | Capital adequacy and portfolio summary reports are typical standard reports shared with management and even regulators in some cases. |
| Summary and aggregate reporting | What are the total amounts of up-to-date loans; 30-, 60-, and 90-day delinquencys; write-off with their total borrowing; and provision and potential loss amounts? Another aggregate report can be related to the cost of funding against lending, interest income, and losses to determine profitability. |
| Historical snapshot reporting | Comparison of accounts in 60-day delinquency in current month to see how they were doing at the end of last month. Which ones slipped further away, which ones are recovering, and which ones are stuck? |
| Metrics, trends, and thresholds | What is the typical delinquency migration to see how many accounts will move from 90-day delinquency to total default? If that number is increasing, then the collections team needs to step up. |
| Analytical reporting | What is the overall portfolio situation with profit, loss, interest, lending, and their trending over the last year? |
Once the business analyst has a handle on the above, proposing analytics problem statements becomes easier. Users who are savvy with this type of analysis through the Information Continuum get excited when presented with a question, such as: How would you like analytics to predict which accounts will self-heal back from 60-day delinquency to nondelinquent? This analytics question may not be obvious to someone who has not evolved through the Information Continuum with this data. But someone understanding this entire hierarchy will ask all sorts of additional questions, such as:
■ Can you forecast what will be the losses in the next month (forecast method)?
■ Can you predict which accounts are going to go bad (predictive method)?
■ What is the probability that certain accounts in collection will actually pay-up (predictive method)?
■ How should new loans be priced based on the current cost of funds, losses, provisions, and competitive market situation (decision optimization method)?
Chapter 9 explains what kind of skills and training are necessary for a business analyst to encourage and explain this type of thinking once the data along the Information Continuum is understood. The more the user community gets better at this, the better the value from analytics investment to all parts of the organization. Within banking, risk managers are usually well versed in analytics, but sales people in branches and collection teams usually are not. That is where IT can help bring analytics to the front of operations and create knowledge workers out of sales and collections staff. Once they get on to this line of thinking, the analytics solution team will have no shortage of requirements coming from all over the business. We have already seen this trend with data warehousing and the wide adoption of reporting tools and datamarts across departments and thousands of users.
Data Requirements
Once the problem statement is clearly identified as part of the requirements extraction process, it should have three components: the analytics method to be used, the data domain or the problem domain, and the resulting variable that needs to be predicted, clustered, forecasted, or optimized. The data requirements are a critical component of the analytics project because they keep users from blindly running around and hoping to get something of value. The existence of data is tied to some business process that could be generated from an internal or external system. If you are trying to forecast the sales for the next quarter, you may be wasting your time if you are looking into the HR system. So when the business starts to understand the four analytics methods and appreciate what analytics applications can do to run and manage the business, there is a lot of excitement and anticipation.
However, if you ask users to predict the possibility of a loan default and what data they should be using, you have the business in a quandary because they wouldn’t know. On the other hand, if someone not well versed in the data and problem domain tries to identify the data that may be relevant, he or she can end up acquiring data sets that should not be combined, mean different things, or have no relevance to the defaults. So how does a business analyst become well versed and what exactly are these data requirements that should be gathered? The approach for data requirements will be similar to the one used for the problem statement. Business analysts will have to do some work on their own and then present the findings to the business and explain what they are trying to do. The business in turn will guide and help pinpoint the data requirements. It is important to use this approach because the following questions are very important to put meaningful boundaries on the project, otherwise it can become a science experiment that may not meet expectations.
1. How much historical data is kept around? What is the relevance of data that is more than three or seven years old?
2. How do you ensure a good spread of data is identified? Data that is skewed toward a dip or spike in the business process may have to be normalized to keep the analytics model from skewing its results.
3. How many source systems are relevant? This ensures time is not wasted on systems that may have only peripheral importance.
4. What grain of the data is most relevant for the problem statement? For example, is the prediction of defect on a single product or on the lot (group of same products produced as part of the same batch like pharmaceutical tablets)? Whatever the grain, the data will have to be built at that level.
5. What is the total set of tables and columns from various systems that should be in scope?
This type of information will allow the project to manage the data-quality issues, data transformation effort, data profiling and normalization efforts, and understanding the dependencies across various data elements. In large organizations, an analytics project may be looking at hundreds of tables and thousands of columns; the method of elimination as to which variables really have the weight to influence the prediction is a slow process and could take weeks and months. This is one of the serious limitations of the current analytics projects undertaken in specialized areas like risk management and direct marketing, where the analyst who knows the data from prior experience will go after the data that matters and will not waste time identifying other potential interesting variables. However, that approach only works when you have super-analytics professionals (highly paid) and well-defined problem statements and analytics methods. The purpose of this book is to take analytics to all parts of an organization, and those newer parts may not know readily which data elements matter the most.
Another issue with the current practice of creating a data silo for analytics and only using the well-known variables (e.g., age, income, gender, marital status, etc. for customer analytics) is that the Big data, tweets, likes and check-ins, geo-locators, uploaded pictures, recommendations, Angry Birds or Farmville scores, etc., cannot fit into those predefined variables and ensuing analytics models. On the other hand, bouncing around endlessly in Big Data variables can take forever without any guarantees of success. There is no scientific answer to this, as we have established that analytics is both science and an art form. A systematic approach is presented here to make sure the data requirements are deep enough to factor in the newer data types and have enough data, yet not overwhelm a practical delivery schedule of the analytics project. The business and IT analyst will have to work closely where the business analyst will do a lot of preparatory work and present findings to the business and seek their guidance to extract data requirements.
Data Requirements Methodology
Since the analytics approach is identified and agreed on and the data output of the analytics model is well understood, identifying the business processes relevant to that data is not that difficult. Here is a methodology to do this:
1. The business analyst should look at the people involved in the scope defining stage and jot down their positions in the organization chart.
2. List the organizational units involved in the analytics output setup as the scope.
3. Create a list of systems that the users within those organization units regularly use.
4. Create a high-level business process model of how the users, systems, and their organization units are connected (there is plenty of material available on business process modeling and it is usually well understood by business analysts).
5. Create a high-level list of data entities that are used in that business process model.
6. Map the high-level entities (also known as subject areas) to the systems and tables within the systems where that data lives.
7. Prepare a master list of all tables organized by the system.
8. Map the tables against the data already in the data warehouse.
9. If the gap between the tables list and the data warehouse is more than 20–30%, stop.
10. The project must not move forward until the data warehouse is able to source and bring in data from the corresponding tables based on their internal analysis, design, and implementation methodology.
11. If most of the data is in the data warehouse already, then the tables and columns combined with the metadata, such as source fields mapping, transformations, and business rules, all become the data requirements.
Step 9 is a guideline, as there may be situations where you may tap into the source system for missing data. The reason is that if the data not in the data warehouse is included in the requirement, then subsequent design and development steps will become more complicated and a sustainable solution will not be possible. Analytics solutions like the rest of the data warehouse are based on a continuous supply of data on a regular schedule that runs through the analytics model either as a real-time transaction or in batches, but either way, the extraction of data as a one-time use for an analytics project is a bad idea. If it is for a prototype, then Chapter 4 provides the methodology and process to build a prototype. Starting in Chapter 8, we cover a long-term and sustainable solution and the requirements for that are not for a one-time analytics project. This will require the data to be available on a regular schedule (or in real time) to run through the model, and therefore it is better to integrate the data into the data warehousing infrastructure to reap the benefits of the ETL, data architecture, metadata repository, scheduling tool, real-time integration with source systems, archiving and disaster recovery setup, etc.
Model and Decision Strategy Requirements
This and the next part of the requirements process should be driven by business once the concept is explained to them. Formal requirements extraction activity may not be needed. This part ties back into the scope and the problem statement. Let’s take the example of a wireless phone service company looking to manage its customer churn. They want to build a predictive model that predicts the probability of a customer leaving the carrier. This has been established in the scope and problem statement and the relevant data fields for that problem have also been identified. The question becomes, what would the business do if they get such a probability against all of their existing customers? The purpose of analytics is not just to build a model and show the business that it is possible to predict the customers who may defect, the analytics solution and practice should also help the business figure out what to do with that information. Once this is clear to the business, they should be able to provide exact requirements as to what they would need from the model.
The decision strategy may take a little more explaining. As explained in Chapter 2, a decision strategy is basically a series of business decisions that factor in the output of an analytics model and provide actions to be undertaken by the wider organization. The business should be able to provide 1–3 strategies at a minimum to as many as 8–10 as a requirement. The team delivering the analytics solution will be responsible for building and implementing the strategies as well, and therefore the requirements gathering is also the responsibility of that team. In this particular case, business will get the probability of defection back from the analytics model against each customer (see Table 8.1).

The business should be able to decide what they want to do with customers with high probabilities and what high for them means (>50, >70, or >90, etc.). The answer should be a requirement that looks something like the following:
IF probability > 65 and < 80
AND
IF Customer has been with the company more than 1 year
AND IF has been paying more than $40 per month regularly
THEN offer 20% discount for the next 3 months
ELSE offer them 10% discount
ELSE send a thank you letter that we value your business
IF probability > 80%
It is important to note here that the analytics model is only providing the probability, but what needs to be done with the probability is totally up to the business and is being captured as a requirement, however its implementation is not simple. The business may want to know a distribution of the probabilities to decide where they want to put a cutoff. In the preceding example, two cutoffs were used as an illustration: one was for everyone over 80% and the other was for customers with probabilities between 65% and 80%. What if based on actual results of the model, there aren’t any customers in the 80% range and the 65% to 80% range has 1 million customers? The cost of providing discounts to 1 million customers for retention could be very high. Maybe the high number of potential defections is a question for a broader strategy shift in how the customers are provided services or a new product design may be necessary. These scenarios have to be presented to the business to get them fully engaged in analyzing the output so they can be prepared for the actions necessary to get the benefits of the analytics project. A high concentration of customers in fewer probability buckets may also prompt the business to ask for explanation as to what is causing so many people to be in the same bucket. Either the model needs tuning or there is a very interesting insight that business would like to understand. These requirements are a little more tricky to answer and significantly depend on the analytics tool used, but they should be captured so the solution team is ready and can test the model using some of these scenarios.
The requirements for the decision strategies are also very important because if the output of the model is well received by the business, they would want to act upon it. If at that time it turns out that strategy design, implementation, and deployment is another four- to six-month project, then the analytics team losses credibility. Some steps in the strategy like “AND IF has been paying more than $40 per month regularly” could actually be fairly complex to implement as other scenarios emerge about what regularly means. Is it trailing 12 months, year-to-date, or last calendar year? The answers to such questions can determine the complexity of calculating this segmentation and implementing the strategy.
Business Process Integration Requirements
The last part of the requirements gathering process is regarding operational integration of the decision strategies. Looking at the strategy requirements it is an action that can be automated and implemented in an operational system, such as the phone billing system in this case. A wireless carrier may have millions of customers, so it is unlikely that the decisions will be carried out in any manual form. But whether they will be carried out in a separate standalone analytics system or integrated with the existing operational system requires further probing and engaging the business more closely. The questions to be asked would be:
■ Are the same customer service people going to implement the decision strategies?
■ If this is implemented in the operational system, how often would you change the discount percentages and probability ranges?
■ Are all the customers going to go through the analytics process every month or every quarter? (If yes, then you would be giving them a lot of discounts.)
■ Should the analytics model run on select customers based on some event?
■ What kind of controls should be put in place so no other customers get the discounts through clerical error, misunderstanding, or foul play?
■ How would you like to review the results of the discounts once they have been applied to the customer accounts?
These requirements gathering questions should make it clear that the analytics solution is a complex implementation, because the answers to these questions can significantly change the complexity of the implementation. A specialized rule engine may have to be purchased or built integrated with the operational system that interacts through transactions, clear interfaces, and integration mechanisms. The entire overhead of changing the decision strategies, adjusting cutoffs, and modifying discount values, and tracking the decisions for auditing purposes, may need to be kept out of the operational system.
The business, once fully engaged in the analytics solution implementation, should be able to provide all of the preceding requirements. However, they may also get overwhelmed and start asking questions as to why this is being done in the first place. That is where a comparison of their current business process for reducing churn may have to be explained. A nonintelligence or data-driven churn reduction strategy may be costing them more and not providing the desired results in their current environment. In this case, the solution is complex, but business has to take ownership and control of the solution’s moving parts because then they will have a wider visibility into where to focus their energies. Without the churn probability, they may have been offering discounts to customers who were not going to leave the business anyway. This level of engagement helps the business understand the concepts and provides the appropriate requirements under each category to allow the entire business function to become knowledge-driven and the staff to become knowledge workers.