Analytics Adoption Roadmap
Contents
Learning from Success of Data Warehousing
Lesson 4: Efficient Data Acquisition
Management Attention and Champion
Now that we have established exactly where analytics fits in the Information Continuum, and we know what the prerequisites are and what is the range of problems that they can solve, we will use that knowledge to see how an analytics program (or center of excellence) should be structured, presented, planned, budgeted, and launched. Throughout this book the emphasis is on simplifying the use of analytics and its technical implementation by using data and tools already available. To convert an organization into an analytics-driven enterprise, analytics has to penetrate all aspects of the business. There are two ways to achieve this: top-down and bottom-up.
Top-down would mean massive upfront investment in a leading suite of tools and technology and highly skilled staff in technology with functional knowledge of the various business activities. This kind of analytics program can only come from the top executives and it needs a lot of personal commitment and effort to ensure all levels of management adopt analytics as a way of life to business improvement. This book is proposing an alternate bottom-up approach. The bedrock of the bottom-up approach to analytics adoption and keeping the delivery simple and easy to manage requires a short trip down history lane when data warehousing hit the corporate scene and how it was adopted.
Learning from Success of Data Warehousing
There are six lessons that we learned from the success of data warehousing programs across organizations of all sizes. A data warehousing team, technology, and users working to build and use data warehouse systems for reporting and analysis is an essential component of IT departments of all sizes.
Lesson 1: Simplification
The concept of data warehousing as originally presented by Bill Inmon (1992) was very simple, and the simplicity of the concept lead to its immediate and wide acceptance. The idea was applicable to all organizations and impacted all management layers. The use of data for reporting was straining operational systems and there was no single version of the truth readily available from an integrated source. To solve these two problems, Inmon recommended to take out all reportable data and move it into a data warehouse (Inmon, 1992). This frees up the operational hardware resources from reporting and data-crunching workload and allows IT to integrate the information from multiple systems while moving data into the warehouse. This was a simple and useful idea that appealed to all managers and business users.
Lesson 2: Quick Results
The adoption of data warehousing initially took a top-down approach (Watson, Gerard, Gonzalez, Haywood & Fenton, 1999) where large, funded projects were approved and massive data movement infrastructure and teams were set up, including hardware, a wide variety of tools, consulting firms, subject matter experts of operational systems, and specialized technical staff in data modeling, ETL and reporting, and database development. A lot of these projects became “analysis-paralysis” projects, as the analysis of an entire landscape of operational systems was overwhelming and took longer. Without that, it would’ve been impossible to guarantee a good integration of all systems. It took months and even years to integrate a couple of large operational systems with no value to the business until the entire integration was finished. That approach was soon abandoned since it didn’t deliver results in a meaningful timeframe.
A datamart-based approach became popular where functional user-facing databases were developed integrating all relevant data for that function’s reporting and analytical needs. Managers loved the datamart-based approach because it yielded quick results and solved their data availability issues. Some technical precautions were introduced under the data warehouse (DW) architecture and best practices were established to ensure the datamart-based approach was connected by a data integrity thread and not replicating the issues of the legacy reporting (Kimball et al., 2008). So datamart after datamart, over time a fully integrated data warehouse was built as a bottom-up approach. As business and functional managers got a handle on this datamart-based approach, they even started hiring their own datamart development teams that built specialized datamarts exactly according to their needs while pulling data from the data warehouse.
Lesson 3: Evangelize
Every manager and department needs reporting, and there was no need for IT or data warehouse teams to convince management that this was important to their performance as managers and as departments. The hurdle was already there, related to integrating all the relevant data for the metrics needed to run the business, and the data warehouse delivered a visually appealing presentation layer for reporting. Large organizations today have dozens of datamarts serving individual departments and newer ones are coming up every day. The more managers see, share, and adopt, the more they ask for in terms of data and better analytical capability. Datamarts are also available with a prebuilt analytical front-end as packaged software products in specialized areas like risk management, campaign management, anti-money laundering, etc.
Lesson 4: Efficient Data Acquisition
Data warehouse systems built robust capability in handling various forms of data coming from different systems at different schedules. This capability is called ETL—extract, transform, and load—but we will be using ETL as a noun referring to a capability of moving data between a source and a target and applying some data processing logic along the way. ETL is starting to become a vast field involving all aspects of data management and has become a small industry called data integration (Thoo, Friedman & Beyer, 2012). ETL teams got very good at linking to operational systems and have an existing integration with all operational systems and a mechanism established for receiving and sending data. Once this capability is in place, accessing data and serving the various data needs of IT and business teams becomes fairly efficient, removing one of the biggest obstacles in data analysis.
Lesson 5: Holistic View
The business requirements for the datamarts within the overall data warehousing program come from the functional owners of the datamarts—the users of datamarts. Once they see the capability of a datamart (may be within another department), they want one for themselves and provide the budget for building it. Data warehouse teams have business analysts who work with functional users to understand their data and analytical needs in the context of their business processes and operational systems. This results in the data warehouse team becoming the only group in the entire organization that has the complete functional and data perspective of the organization. This capability allows for business users to trust the data warehouse business specialists, and an exchange of ideas takes place for newer ideas on using data. These analysts are able to build better bridges with the business and internally exchange interesting ideas of information utilization helping the organization move up in the Information Continuum.
Lesson 6: Data Management
Data warehouse systems routinely deal with large volumes of data with millions of records processing regularly in increasingly smaller batch windows, storing terabytes of data, serving complex queries, and maintaining a high availability backup, archival, and disaster recovery setup. This gives them the capability to handle complex data problems. If a data warehouse engineering team has been around for a while and manages a multiterabyte-size environment, they are skilled in challenges of data. In addition to the technology infrastructure to support the data warehouse environment, they also manage the data dictionaries, data models, data lineage (how did the data reach the reporting display), and various other types of information like data-quality controls, data dependencies, transformation business rules, etc., typically called metadata. This capability allows them to consistently and reliably deliver quality datamarts to the business within the data warehouse program.
The success of the data warehouse is the proliferation of the datamart culture, driven and pushed by individual functional groups, allowing data warehouse teams to build a holistic technical, functional, and information landscape systematically over a longer period of time. That is why data warehousing was adopted and is extensively used in all aspects of the business. Analytics will have to follow a similar path and leverage the existing capabilities built within the data warehouse teams, since based on the Information Continuum, data warehousing is a prerequisite for analytics anyway, and therefore creating an analytics program office outside of the data warehouse team does not make sense.
These six lessons learned assume that a robust and successful data warehouse program is in place. This is important because several of the first few levels in the Information Continuum are delivered through a data warehouse and analytics sits on top of it. If those levels are not there or are in a state of chaos, then undertaking analytics will be a costly affair with fragmented value and success. Datamarts being built and rolled out to demanding user communities in an efficient manner is a prerequisite for an organization to even start thinking about becoming analytics-driven. If your organization doesn’t have the data warehouse capabilities as mentioned here, you can still undertake small analytics projects to illustrate the value and concept to the business. But once there is major business buy-in and support, do not proceed without making sure the maturity of the underlying levels in the Information Continuum are part of the scope.
The Pilot
Business Problem
Analytics projects, pilots, or proof of concepts all suffer from the same constraint: the business may not know or understand what they want and IT wouldn’t know what to build if there is no clear goal or scope. Chapter 8 is exactly designed to handle this problem. It doesn’t matter if the business side or IT identifies a problem where analytics can be applied, because the problem can always be vetted and confirmed with the business owners and subject matter experts. It’s a two-step process. A truly entrepreneurial approach is needed where a problem is identified that can be solved with applying analytics, and then rationalization or vetting is needed involving more subject matter expertise.
Chapter 3 uses examples from several industries to build a consistent theme around problems that can be easily solved with analytics. Important features of this theme are:
■ Questions regarding some future event or activity. Would it be valuable to business if they could predict or forecast some future event or action and be ready to exploit that?
■ Can a problem be broken down into a 1 or 0 problem? For any problem that can be described in the 1 and 0 format (Chapter 3 covers this in detail), historical data can be used to identify the patterns that predict 1 versus 0.
■ A large collection of data that needs to be broken down into some kind of groupings based on similarities among them so meaningful analysis and actions can be carried out.
■ Clarity of action to be taken (decision strategy) in case the future event can be predicted.
Some elements of these features have to be used to identify and build a business case. An analytics business case should be avoided if driven from hype, peer pressure, or vendor offerings unless the following are clearly understood:
■ What is the analytics class of the problem being solved? Is it clustering, classification, forecasting, or decision optimization?
■ What is the candidate problem statement to be solved? Open-ended discovery or exploration projects are risky, because if value is not uncovered quickly, the entire analytics initiative could be in jeopardy. The discovery and exploration type of open-ended problems should be attempted once there is wider adoption and acceptability of analytics as a viable technology to improve business operations.
■ Is there a business buy-in to the problem and expected outcome? If a useful analytics model is produced, does the business understand how they would use the output?
In the absence of clarity on these questions, undertaking analytics solutions will not yield results. There may be some “informal” data exploration and subject matter discussions until a problem class is identified, a problem statement is crafted, and a decision strategy is understood. The Information Continuum levels preceding analytics models can help rationalize an analytics problem. If a general area of opportunity is identified but not a clear-cut problem definition, reporting, metrics, patterns, visualization, etc. can help structure the problem parameters leading to a formal problem statement.
Management Attention and Champion
It would be rare to find middle management coming to IT and asking for the initiation of a project that solves a particular problem using analytics. Even though an increasing number of universities are now introducing graduate-level degree programs in analytics and several programs are introducing the concept to MBA programs through introductory courses (Thibodeau, 2012), it will be a while before business managers will start initiating analytics projects. The lesson learned from data warehousing should be applied here, where a demonstration of something useful brings the managers across all functions of the organization to want their own datamart and reporting capability. The first datamart in a data warehouse program is always crucial and ends up being sales or finance focused. Finance in particular has a large appetite for data, so a lot of reporting delivered in the first iteration of a data warehouse is usually for finance. Besides, they need the most accurate and integrated information from all across the enterprise, so their needs are hardly met from departmental reporting.
Finance departments played a key role in promoting the use of integrated reporting and helped promote the datamart culture, which then departments adopted, and slowly data warehousing, datamarts, and business intelligence were part of the business lexicon. Analytics needs a similar champion or a natural starting point. The easiest could be a customer-facing CRM and marketing type of function of which the analytics needs are well established and various problem statements are well understood. If it can be demonstrated that some propensity models (predictive) or clustering can actually be carried out in a cost-effective way using existing data warehousing resources, that may be the easiest sell. Similarly, established problems in sales forecasting (using time-series analysis), pricing, or risk management are all good candidates as problem statements. The value is in delivering the solution cost effectively. Attempting a new and innovative use of analytics to identify a business problem, establish a problem statement acknowledged by business, and then deliver valuable results that are actionable is no easy task. So one approach would be to build confidence in analytics through delivering expensive solutions cost effectively, and therefore executives whose problems are being solved for which they know they don’t have the budget will become champions and will be promoting analytics among their peers.
Another approach could be to find a data-savvy executive who is always asking for complex reports treading on statistics and patterns or trend analysis, and explain to him or her the four classes of analytics problems (descriptive, predictive, forecasting, and decision optimization). Then brainstorm some of his or her obstacles to see if any of these can be applied to build a model that can solve the most pressing issues. A few ideas will emerge; go back to the lower levels in the Information Continuum and do more analysis to see if a problem statement can be structured and bring it back to the executive explaining the inputs and outputs and the function of the proposed analytics model. This type of partnership is more valuable in establishing analytics as a tool for business foresight and success of the executive will propel the adoption of analytics. A word of caution is not to pick a problem for which the detailed and relevant data is not yet in the data warehouse. If the data is not in the data warehouse, it will be difficult to vet the idea in the absence of the lower levels of the Information Continuum applied to that data set and the implementation of the pilot will take longer because of the effort of source data analysis, cleansing, integrating, transforming, and loading, and then reporting and analyzing for metrics, performance variables, models, and strategies.
The Project
Once a problem statement has been established and management attention or a data-savvy executive is willing to champion the pilot, focus on delivering the results quickly. The scope of the pilot, its candidate input variables, the analytics model, and its output and the use of that output for business decisions, all need to be carefully documented. There is no harm in bringing in a consulting firm or a product vendor into the pilot at this time. Help may be needed in using the open-source or in-database analytics capabilities. Training helps but expert resources in that particular tool are always more useful to have on the team. The deliverables will be along the following lines:
2. Candidate variables as input into the analytics model.
3. Mapping of input variables to data warehouse data.
4. Design of a specialized analytics datamart.
5. Design of ETL to extract data from the data warehouse, transform and build variables, and load in analytics datamart.
6. Integrating and accessing the analytics datamart through the analytics software (data mining software that has the required analytics algorithms).
7. Identifying a large enough data sample to be used for the pilot.
8. Loading the analytics datamart.
9. Separating 90% of data for training and 10% for testing and validation.
10. Running and building training models.
11. Validating the results, adding more variables, and repeating steps 2–10 until good results are demonstrated by the model.
12. Feeding new data to the model and returning the output to business for actions.
During the pilot, it is unlikely that business will accept the model’s output, create a decision strategy, and act upon it. At a minimum, they should see how the output can be used to benefit their operation. Decision strategies can be built and run as a simulation to even prove the actual return on investment of the project using data in retrospect (meaning already completed events treated as if they didn’t happen and run them through the model for output and application of simulated actions). Compare the results of the retrospective simulation of decisions and with the actual decisions that were taken without analytics.
Existing Technology
To ensure the controlled scope and costs of the pilot, it is important to use the existing data warehouse hardware and software, including existing ETL and reporting tools. Do not invest in isolated, specialized, and standalone software or packages at this stage. Buy-in from management and adoption of analytics across wider business areas will automatically create the need and funding for such an investment, and the team would know how to use the specialized product to get the most out of its abilities. It is not uncommon to see cannons purchased to shoot flies (i.e., a large expensive software suite for a small problem) or acquisition of shelf-ware (software that sits on the shelf once the vendor finishes the project). There is no justifiable requirement for scheduling software, cleansing software, metadata repository, fancy front-end tools, and high-end analytics software at the early stages of analytics adoption.
There is a tendency among technologists to get the most well-known, leading, and powerful feature-rich software once the pilot scope is approved. Since the business has bought into the problem statement by now and expecting some benefit, IT approaches them and tells them that it cannot be done unless such and such software is purchased. Another scenario is where a vendor enters in with deep discounts of its software for the pilot with the assumption that a successful pilot will allow the management to secure the budget for the full price of the software to build a production-ready implementation. This has to be resisted by the business and technologists alike and rather use freely available tools like the R suite or in-database analytics software they may already have with SQL Server, Oracle, Sybase, or Teradata database environments housing the data warehouse. There may be a small price associated with turning on those in-database analytics (mostly based on data mining) features depending on the licensing terms, but that is the preferred toolset to be used for an analytics pilot.
Another tendency is to take all the relevant data out into another environment as a data dump and then try and build the variables, applying business rules and other requisite transformations using some combination of Excel, SQL, and other programming languages that the team may be familiar with. This can happen for two reasons. One is that the data warehousing team, too busy in managing the day-to-day activities of a data warehouse, may not want additional overhead of this R&D because they may not understand it, may not have the bandwidth to support it, and don’t see much value from the pilot. They would prefer to just hand over the data and be done with it. The other reason could be that the project team, consulting firm, or vendor may find the controls and change management processes of a data warehouse environment to be too restraining and limiting and would prefer more freedom over the creation of tables, adding fudged data, dropping and adding columns and indexes at will, and introducing their own tools, techniques, and approaches into the development process. There may be some merit to both reasons. However, the temptation of creating an island of a specific data set for the pilot should be avoided. The more the pilot is integrated with the data warehouse, the better its ability to innovate in terms of variables, modeling techniques, and running simulations to validate decision strategies. An isolated implementation will struggle to scale up in terms of tapping into more data sources, building a robust data management environment, and providing adequate audit, control, and governance capabilities. It tends to become a one-person show solving a specific business problem, thereby limiting the organizational benefit from the successful implementation.
Existing Skills
Similar to the existing technology, the existing skills available within a robust data warehouse team should be leveraged. The skills similarity between a data warehouse environment and an analytics solution has tremendous value and overlap.
Source System Analysis
The data warehouse taps into a lot of source systems, pulls data out, cleans it, integrates it, and loads into the warehouse. This requires subject matter expertise in source system technology, data layout, business processes linked to the data creation, and data definitions down to each field and its possible values. This skill is extremely useful in defining the variables as input into the analytics software. The candidate variables need detailed definitions in terms of the business rules, grain, possible values, and transformation to make them more useful for analytics. For example, a continuous variable like date of birth will have to be made discrete into age bands for more effective use in the analytics software. A source system analyst well versed in that data and its business process is best equipped to help build the age bands useful for the business. For example, in healthcare insurance systems, age 0 is very important from a reporting and analysis perspective and may need its own band. Data warehouse teams typically have field-level domain knowledge, otherwise they know the domain experts who can help. Navigating the organization to find the people with relevant knowledge of data and business processes quickly can avoid costly discoveries and realizations later in implementation.
Data Modeling
The data modeling capability within the data warehousing team is usually fairly sophisticated. If the data warehouse has been in production for more than five years and has four to six datamarts, the data modelers supporting the environment are well versed in complex data modeling challenges. They know how to work with very high-level requirements and develop the understanding of different data entities and their interrelationships. They are also well versed in abstract designs to handle the variations in data structures coming from source systems. That skill is needed to build an analytics datamart. There are no specific modeling techniques or design guidelines for an analytics datamart. Any modeling methodology can be employed, but the purpose of the datamart and the requirements are usually very clear by the time a pilot gets to this stage. This allows for the modelers to design an analytics datamart without acquiring any new resources (software, training, or consultancy).
ETL Design, Development, and Execution
ETL stands for extract, transform, and load and this book uses ETL as a noun, although data integration is starting to become an acceptable term to refer to all types of data manipulation and management (Thoo et al., 2012). ETL, therefore, refers to the effort required to move data from one place to another. It involves some software, some design principles and methodologies, some hardware, and some trained and skilled people. The ETL design and development skill should be available within the data warehouse team and it should be leveraged along with the methodology and best practices.
The approach for analytics solutions presented in this book leverages the existing ETL skill set and breaks down most data movement–related pieces of an analytics solution into tasks that can be easily served through an existing ETL capability. These tasks include:
■ Data for creation of variables needed for the analytics model comes from the data warehouse. Multiple sets of variables created by writing independent ETL programs built by different ETL resources allow for speed and efficiency.
■ Loading the variables into a target data model for the analytics datamart.
■ Running the model through a large data set and bringing the results back into the datamart.
■ Building an audit control mechanism for data validation and integrity.
■ Packaged analytics suites implement all of this data movement in easy-to-use custom and proprietary tools, but then there is the cost of acquiring those tools.
■ Decision strategies can also be implemented using ETL tools, as shown in Chapter 5.
■ Multiple decision strategies can be run and the champion–challenger process can easily be handled within the ETL tool.
ETL (software, hardware, process, and skill) is already available in any data warehouse environment. If the task is broken down into specific data movement activities, existing skilled ETL resources should be able to design, develop, and run the data within an analytics solution. More sophisticated decision strategies or data transformations (especially unstructured data like videos, voicemails, tweets, etc.) will require custom development or specialized software, but that type of complexity should be avoided for the pilot to minimize the risk of schedule and budget overruns.
Metadata Management and Data Governance
Within the data warehouse team, there is some mechanism of tracking the metadata. It is not required to have a repository to be installed with all the metadata integrated in one place (it would be nice though!), but some metadata management process should be in place for a data warehouse that serves multiple departmental datamarts. Even if the process requires metadata to be stored and maintained in Excel, it is acceptable for the pilot. As the adoption of analytics grows, even if the data warehouse couldn’t make a business case for a metadata budget, analytics will. Source target mapping, a data dictionary, a logical data model, and some business rules around transformations are all usually kept and maintained somewhere within the data warehouse infrastructure (or with experienced resources). There are staff members who know how to build and manage this metadata. An analytics pilot needs to leverage that and just add its unique flavor of source target mapping, business rules, data model, and dictionary.
Similarly, there may be a data governance process with its two typical flavors: the design and documentation of the data warehouse, and the load statistics to detect anomalies and process load errors. If the governance process does not exist even informally, it has to be introduced as part of the analytics project. If the governance process exists, then it should be leveraged to control the design and definition of the data structure and track load and processing statistics and model and decision strategy versions in production.
Job Scheduling and Error Handling
Since we have broken the analytics project into smaller data movement and processing tasks, the scheduling of these tasks and error handling will require management. It is recommended that people responsible for managing this for the data warehouse should also be used for the analytics project. They may have existing templates and questionnaires that should be followed for the analytics project and they would do the rest in terms of connectivity, scheduling, dependencies of tasks, and error handling and standard support protocols when jobs crash.
Database Management and Query Tuning
If the variable building process, model training or build process, and the output analysis parts of the analytics project are not performing at an acceptable level, the same people who are responsible for these tasks in the data warehouse should be used to help with the analytics project. Similarly, table creation, indexes, constraints, more disk space, and all such rudimentary database administration tasks should be delegated to the team responsible for these functions for the data warehouse.
Reporting and Analysis
Once variables are created and loaded, the model is built and tested, and new transactions are scored or predicted from the model, it is all stored within the analytics datamart. Decision strategies and decisions made regarding them are also stored as data within the analytics datamart. Reporting is now needed to review the performance of the model, and the existing reporting resources used by the data warehouse should suffice to write analysis reports to review the performance of the model. This should be used for a roadshow—even some live and ad-hoc reports demonstrating the power of analytics should be used to increase the “wow” factor.
Results, Roadshow, and Case for Wider Adoption
It is very complicated to explain the working or output of an analytics solution to business and technology executives. If you tell them with great excitement that your prediction model is performing at 75% accuracy, they may not understand what that means. The explanation of results is crucial for the success of the pilot, not only for the stakeholders whose problem was being solved, but also for other executives to understand the possibilities. A walkthrough of the current business operation without any foresight should be the starting point and then an introduction of foresight and ensuing actions should be explained.
Problem Statement
The first thing to explain while sharing the results of the pilot is the problem statement. Let’s take the example of a warranty department of an automobile manufacturing organization. The problem statement would be: What is the probability that the next car off the assembly line will claim warranty in the next 12 months? Even if the project sponsor is the warranty department’s senior manager, operations managers, engineers, and suppliers also have an interest in this statement. Keeping the problem statement simple and effective is absolutely critical when sharing the results. It should be obvious that if the problem statement prior to pilot development is not this crisp and effective, the results cannot be easily explained. Therefore, the simplicity and business relevance of the problem statement has to be emphasized in the early stages of the project, otherwise it will come back and haunt a team when explaining results.
This reasoning is why Part 1 of this book is restraining from adopting analytics projects with an open-ended statement like, “Let’s find some interesting patterns in the data.” If you don’t know what you are looking for, it is very difficult to explain to someone what you have found. Also, whether something “interesting” has been found or not is not easily known unless a problem statement is looking for something specific. If it is found, then the model is ready, otherwise go back to the drawing board and build more variables or use a larger sample.
Champion management or a data-savvy executive’s interest, support, and acceptance of results-as-value will allow other departments, managers, and business units to also understand and relate to the value from an analytics adoption. The value of an analytics pilot project is not just for the department of which the problem is solved, but for everyone to understand and appreciate.
Data and Value
The next step is to convert the historical data used in the pilot into a simple data profile, like the following, and present it. For example:
■ How many years of total production data was used?
■ How many production vehicles’ data was used (the 0 records)?
■ How many warranty claims were used (the 1 records)?
■ What was the total dollar value of those claims used in the model building?
■ What was the average time period from the manufactured date when the claims were paid?
■ Present a list of sample variables used in the model building.
After presenting the profile, explain the 90/10 rule where 90% of the data was used to discern patterns and identify the variables that influence the claim output and the degree of influence they exert on an output. There is no need to explain the variables and their exact discriminatory value (degree of influence); treat that as a black-box instead. Then share the test results on the 10% where the model predicted the warranty claim correctly and where it predicted something incorrectly. This is called a confusion matrix. Let’s build one (see Table 7.1).
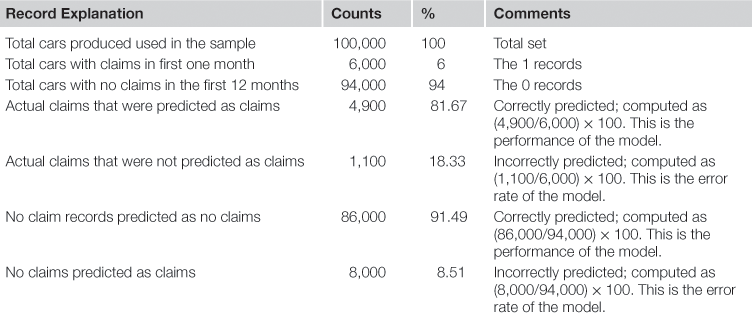
This is a very simplistic and management-focused explanation of the predictive model. Actual testing and validation of an analytics model is a little more complicated, but relies on the accurate prediction of the test sample for which outcomes are already known. The value of the model is that it can accurately predict 82% of the time if a car is going to claim warranty in the first 12 months. How that translates into a dollar value is a complicated question. The model is not telling what could be wrong with the engine, parts, or finish of the car; it is simply showing the probability of a claim is high, and presenting it in this summary form makes it easy to follow.
Roadshow
The results should be shared with engineering and assembly plant staff, vendors and suppliers, purchasing teams, other entities within the supply chain, etc. It should be shared with the upper and middle management and workforce supervisors along with experienced operations staff and subject matter experts. All departments that are dealing with manufacturing and warranty should review the results. The results should be simple and straight-forward and presented in a concise and interesting manner that everyone can follow.
Wider Adoption
The hope is that the pilot will trigger interesting additional questions and explanations. Engineering would definitely want to know the discriminatory power of variables, therefore, they will dig deeper and may introduce more data to further analyze the cause, requiring a more advanced tool or an additional project with their internal engineering data. The finance teams may ask for more financial impact and detailed cost of red tagging the cars and not shipping. Marketing may come in and analyze the customer perspective on the warranty claims to assess the customer relationship impact. Each of these can convert into additional projects and more application of clustering, classification, and optimization on the data. The data warehouse would need to grow larger and faster and the ETL will really have to beef up so a business case for a comprehensive analytics suite can be made.
The decision strategies as to what should be done if the warranty claim probability is high, is something that an analytics team will have to help business evolve into. The business in the past did not have this probability so they never designed an action around it. Undertaking a decision strategy at the pilot stage will be very difficult until the organizational or business owners themselves figure out how they want to react to the insight that analytics provides. It may not be a bad idea to suggest some strategies so the concept and approach are understood.