A Practical Guide to Analyzing IDE Usage Data
Will Snipes*; Emerson Murphy-Hill†; Thomas Fritz‡; Mohsen Vakilian§; Kostadin Damevski¶; Anil R. Nair||; David Shepherd* * ABB Corporate Research, Raleigh, NC, USA
† Computer Science, North Carolina State University, Raleigh, NC, USA
‡ Department of Informatics, University of Zurich, Zurich, Switzerland
§ University of Illinois at Urbana-Champaign, Champaign, IL, USA
¶ Mathematics and Computer Science Department, Virginia State University, Peterburg, VA, USA
|| ABB Corporate Research, Bangalore, KN, India
Abstract
Integrated development environments such as Eclipse and Visual Studio provide tools and capabilities to perform tasks such as navigating among classes and methods, continuous compilation, code refactoring, automated testing, and integrated debugging, all designed to increase productivity. Instrumenting the integrated development environment to collect usage data provides a more fine-grained understanding of developers’ work than was previously possible. Usage data supports analysis of how developers spend their time, what activities might benefit from greater tool support, where developers have difficulty comprehending code, and whether they are following specific practices such as test-driven development. With usage data, we expect to uncover more nuggets of how developers create mental models, how they investigate code, how they perform mini trial-and-error experiments, and what might drive productivity improvements for everyone.
Acknowledgments
The authors thank the software developer community’s contribution in sharing their usage data and the support of their respective institutions for the research work behind this chapter. This material is based in part on work supported by the National Science Foundation under grant number 1252995.
5.1 Introduction
As software development evolved, many developers began using integrated development environments (IDEs) to help manage the complexity of software programs. Modern IDEs such as Eclipse and Visual Studio include tools and capabilities to improve developer productivity by assisting with tasks such as navigating among classes and methods, continuous compilation, code refactoring, automated testing, and integrated debugging. The breadth of development activities supported by the IDE makes collecting editor, command, and tool usage data valuable for analyzing developers’ work patterns.
Instrumenting the IDE involves extending the IDE within a provided application programming interface (API) framework. Eclipse and Visual Studio support a rich API framework allowing logging of many commands and actions as they occur. We discuss tools that leverage this API to observe all the commands developers use, developer actions within the editor such as browsing or inserting new code, and other add-in tools developers use. In Section 5.3, we provide a how-to guide for implementing tools that collect usage data from Eclipse or Visual Studio.
Collecting IDE usage data provides an additional view of how developers produce software to help advance the practice of software engineering. The most obvious application of usage data is to analyze how developers spend their time in the IDE by classifying the events in the usage log and tracking the time between each event. Through usage data analysis, we gain a better understanding of the developer’s time allocation and can identify opportunities to save time such as reducing build time or improving source code search and navigation tools. Beyond time analysis, researchers have applied usage data to quantify developers’ use of practices such as the study of types of refactoring by Murphy-Hill et al. [1], who found developers mostly perform minor refactoring while making other changes. In another example, Carter and Dewan [2] leveraged usage data to discover areas of the code where developers have difficulty with comprehension and should ask for assistance from more experienced developers. One study determined whether developers are doing test-driven development properly by writing the tests first then writing code that passes the tests, or are doing it improperly by writing tests against previously written code [3]. Maalej et al. [4] describe how to collect and process data for recommendation systems including tools and analysis methods, and they discuss important findings from developer usage data analysis. These works provide good examples of how usage data provides necessary information to answer interesting research questions in software engineering.
There are limits, however, to what IDE usage data can tell us. The missing elements include the developer’s mental model of the code, and how developers intend to alter the code to suit new requirements. We must also separately obtain data on the developers’ experience, design ideas, and constraints they keep in mind during an implementation activity.
Looking forward, we see usage data from development environments provides a platform for greater understanding of low-level developer practices. We expect to uncover more nuggets of how developers work to comprehend source code, how they perform mini trial-and-error experiments, and what might result in further productivity improvements for all developers.
5.2 Usage Data Research Concepts
In this section we discuss the background on usage data research and provide motivation for analyzing usage data by describing what we can learn from it. With a review of goal-question-metric, we discuss how to focus usage data collection with specific research goals. To round out the concepts, we discuss additional considerations such as privacy and additional data sources that may be useful.
5.2.1 What is Usage Data and Why Should We Analyze it?
We refer to the data about the interactions of software developers with an IDE as the IDE usage data, or simply usage data. The interactions include commands invoked, files viewed, mouse clicks, and add-on tools used.
Several stakeholders benefit from capturing and analyzing usage data. First, IDE vendors leverage the data to gain insight into ways to improve their product on the basis of how developers use the IDE in practice. Second, researchers both develop usage data collectors and conduct rigorous experiments to (1) make broader contributions to our understanding of developers’ coding practices and (2) improve the state-of-the-art programming tools (e.g., debuggers and refactoring tools). Finally, developers benefit from the analysis conducted on the usage data because these analyses lead to more effective IDEs that make developers more productive.
At a high level, an IDE can be modeled as a complex state machine. In this model, a developer performs an action at each step that moves the IDE from one state to another. To capture usage data, researchers and IDE vendors have developed various usage data collectors (Section 5.3). Depending on the goals of the experiments, the usage data collector captures data about a subset of the IDE’s state machine. While a combination of video recordings of the IDE with the keyboard strokes and mouse clicks of a developer would provide a fairly complete set of usage data, it is difficult to automatically analyze video data and therefore this is mostly limited to small laboratory studies and is not part of the usage data collectors developed.
An example of a usage data collection and analysis project with wide adoption in practice is the Mylyn project (previously known as Mylar). Mylyn started as a research project that later became part of Eclipse and it exhibits both of the advantages of understanding programmers’ practices and improving tool support.
Mylyn created by Kersten and Murphy [5] was one of the first usage data collectors in IDEs. It was implemented as a plug-in for the Eclipse IDE and captured developers’ navigation histories and their command invocations. For example, it records changes in selections, views, and perspectives as well as invocations of commands such as delete, copy, and automated refactoring. The Mylyn project now ships with the official distribution of Eclipse.
The Mylyn project has been used to collect and then analyze usage data to gather empirical evidence on the usage frequency of various features of Eclipse (see, e.g., [6]). In addition to collecting usage data, Mylyn introduces new features to the Eclipse IDE that leverage the usage data to provide a task-focused user interface and increase a developer’s productivity [7]. In particular, Mylyn introduces the concept of a task context. A task context comprises a developer’s interactions in the IDE that are related to the task, such as selections and edits of code entities (e.g., files, classes, and packages). Mylyn analyzes the interactions for a task and uses the information to surface relevant information with less clutter in various features, such as outline, navigation, and autocompletion. More information on collecting data from Mylyn is given in Section 5.3.2.
Later, Eclipse incorporated a system similar to Mylyn, called the Eclipse Usage Data Collector (UDC),1 as part of the Eclipse standard distribution package for several years. UDC collected data from hundreds of thousands of Eclipse users every month. To the best of our knowledge, the UDC data set2 is the largest set of IDE usage data that is publicly available. As described in [8, 9], several authors, including Vakilian and Johnson [10], Vakilian et al. [9], and Murphy-Hill et al. [1], mined this large data set to gain insight into programmers’ practices and develop new tools that better fit programmers’ practices. For more information on UDC, see Section 5.3.1 on using UDC to collect usage data from Eclipse.
Studies of automated refactoring are another example of interesting research results from analyzing usage data. Vakilian et al. [9] and Murphy-Hill et al. [1] analyzed the Eclipse UDC data, developed custom usage data collectors [11], and conducted survey and field studies [1, 10, 12] to gain more insight into programmers’ use of the existing automated refactorings. Murphy-Hill et al. [1] and Negara et al. [12] found that programmers do not use the automated refactorings as much as refactoring experts expect. This finding motivated researchers to study the factors that lead to low adoption of automated refactorings [1, 11] and propose novel techniques for improving the usability of automated refactorings [1, 8, 13–17].
With this background on usage data collection and research based on usage data, we look next at how to define usage data collection requirements on the basis of your research goals.
5.2.2 Selecting Relevant Data on the Basis of a Goal
Tailoring usage data collection to specific needs helps optimize the volume of data and privacy concerns when collecting information from software development applications. While the general solutions described in the next sections collect all events from the IDE, limiting the data collection to specific areas can make data collection faster and more efficient and reduce noise in the data collected. A process for defining the desired data can follow structures such as goal-question-metric defined by Basili and Rombach [18] that refines a high-level goal into specific metrics to be generated from data. For example, in the experiences gamifying software development study [19], we focused on the navigation practices of developers. The study tried to encourage developers to use structured navigation practices (navigating source code by using commands and tools that follow dependency links and code structure models). In that study, we defined a subset of the available data on the basis of a goal-question-metric structure as follows:
• Goal: Assess and compare the use of structured navigation by developers in our study.
• Possible question(s)
What is the frequency of navigation commands developers use when modifying source code?
What portion of navigation commands developers use are structured navigation rather than unstructured navigation?
• Metric: The navigation ratio is the ratio of the number of structured navigation commands to the number of unstructured navigation commands used by a developer in a given time period (e.g., a day).
The specific way to measure the navigation ratio from usage data needs further refinement to determine how the usage monitor can identify these actions from available events in the IDE. Assessing commands within a time duration (e.g., a day) requires, for instance, that we collect a timestamp for each command. Simply using the timestamp to stratify the data according to time is then a straightforward conversion from the timestamp to the data and grouping the events by the day. Similarly the timestamp can be converted to the hour to look at events grouped by the hour of any given day. Calculating the duration or elapsed time for a command or set of commands adds new requirements to monitoring—specifically, the need to collect events such as window visibility events from the operating system that relate to when the application or IDE is being used and when it is in the background or closed.
5.2.3 Privacy Concerns
Usage data can be useful; however, there are some privacy concerns your developers might and often have regarding the data collection and who the data is shared with. These privacy concerns arise mainly since the data collected may expose individual developers or it may expose parts of the source code companies are working on. How you handle information privacy in data collection affects what you can learn from the data during analysis (see Section 5.4).
To minimize privacy concerns about the data collected, steps such as encrypting sensitive pieces of information, for instance, by using a one-way hash-function can be taken. Hashing sensitive names, such as developer names, window titles, filenames or source code identifiers, provides a way to obfuscate the data and reduce the risk of information allowing identification of the developers or the projects and code they are working on. While this obfuscation makes it more difficult to analyze the exact practices, using a one-way hash-function will still allow differentiation between distinct developers, even if the remain anonymous.
Maintaining developer privacy is important, but there may be questions for which you need the ground truth that confirms what you observe in the usage data. Thus, you may need to know who is contributing data so you can ask that person questions that establish the ground truth. A privacy policy statement helps participants and developers be more confident in sharing information with you when they know they can be identified by the information. The policy statement should specifically state who will have access to the data and what they will do with it. Limiting statements such as not reporting data at the individual level helps to reduce a developer’s privacy concerns.
5.2.4 Study Scope
Small studies that examine a variety of data can generate metrics that you can apply to data collected in bigger studies where the additional information might not be available. For instance, Robillard et al. [20] defined a metric on structured navigation in their observational study on how developers discover relevant code elements during maintenance. This metric can now be used in a larger industrial study setting in which structured navigation command usage is collected as usage data, even without the additional information Robillard et al. gathered for their study.
Finally, and most importantly, usage data may not be enough to definitively solve a problem or inquiry. While usage data tells us what a developer is doing in the IDE, it usually leaves gaps in the story (see Section 5.5). Augmenting usage data with additional data sources such as developer feedback, task descriptions, and change histories (see Section 5.4.7) can fill in the details necessary to understand user behavior.
Now that we have discussed aspects to consider, we are ready to dig deeper into the specifics on how to collect data from developer IDEs. The next section covers several options for tooling that collects usage data from IDEs.
5.3 How to Collect Data
There are many options for collecting usage data from IDEs. Existing tools can provide solutions for commonly used IDEs, and some support collecting data from additional sources. Another way to start is to study data collected in previous projects such as data available in the Eclipse archive for UDC data. This archive contains a wealth of data collected by UDC when UDC was integrated with each Eclipse version in 2009 and 2010. The data is currently available at http://archive.eclipse.org/projects/usagedata/.
You may have more specific questions than those that can be answered with the UDC data or you may need to collect usage data for a specific experiment. In this section we discuss details on how to use existing data collection tools for Eclipse, including UDC, Mylyn Monitor, and CodingSpectator (Section 5.3.3). Then we will walk through creating a usage data collection extension to Microsoft Visual Studio. Before we go into the details, we provide an overview of some existing frameworks.
Eclipse: UDC, discussed in Section 5.3.1, collects commands executed in the environment and editors and views that are invoked.
Eclipse: MylynMonitor, described in Section 5.3.2, collects task-oriented events and information about what code elements the programmers work with.
Eclipse:CodingSpectator , discussed in Section 5.3.3, focuses on refactoring actions and the context in which they are taken.
VisualStudio: Section 5.3.4 describes in detail how to build your own Visual Studio extension that collects all command events from the IDE.
VisualStudio: CodeAlike3 is a Visual Studio extension for personal analytics and research of usage data related to coding efficiency.
Eclipse:CodingTracker, created by Negara et al. [21], is a usage data collector for the Eclipse IDE that records every character insertion and deletion. CodingTracker records the code edits so accurately that it can later replay them to show the changes in action. CodingTracker has been used to conduct empirical studies and accurately infer high-level changes such as refactorings [12].
Eclipse: Fluorite, created by Yoon and Myers [22], is an Eclipse-based tool that captures usage data such as invoked commands, typed characters, cursor movements, and text selections. Fluorite has been used to study programmers’ backtracking strategies in [23] and visualizing code histories in [24].
Eclipseand Visual Studio: Hackystat, created by Johnson et al. [25], provides a framework to collect usage data from many sources.
The remainder of this section discusses in detail how to implement the top four tools from the list above. Where the section describes code, listings are provided that are based on the open source code available on GitHub (https://github.com/wbsnipes/AnalyzingUsageDataExamples). In Table 5.1, we summarize the advantages and disadvantages of each of the four tools we discuss in this chapter, as well as example papers that reported use of these tools.
Table 5.1
A Summary of the Four Tools Discussed in Depth in This Section
| Tool Name | Advantages | Disadvantages | Examples |
| Eclipse Usage Data Collector | Well tested, widely deployed | Collects data only on tools; sometimes missing data | [26–28] |
| Mylyn Monitor | Collects data both about tools and the program elements the tools are used on | No details about code beyond element names collected | [7, 29, 30] |
| CodingSpectator | Very detailed information collected | Information collected largely customized to observe usage of refactoring tools | [11, 21, 31] |
| Build-Your-Own for Visual Studio | A high degree of customizability. One of the few Visual Studio monitoring tools | Extra work required to collect a wider variety of events | [19] |

5.3.1 Eclipse Usage Data Collector
This section outlines how to collect IDE usage data using Eclipse’s UDC. The UDC framework was originally build by the Eclipse Foundation as a way to measure how the community was using the Eclipse IDE. While UDC was included in official Eclipse releases and data was collected from hundreds of thousands of Eclipse users between 2008 and 2011, the project was eventually shut down, and UDC was removed from official Eclipse releases. However, the source code for UDC remains available for collecting data.
5.3.1.1 Collected data
The Eclipse UDC records the following types of Eclipse information:
• The run-time environment, such as the operating system and Java virtual machine
• Environment data, such as which bundles are loaded and when Eclipse starts up and shuts down
• Actions and commands that are executed, via menus, buttons, toolbars, and hotkeys
• Views, editors, and perspectives that are invoked
Let us look at an example of an event that UDC produces on a developer’s machine:
| what | kind | bundleId | bundleVersion | description | time |
| executed | command | org.eclipse.ui | 3.7.0.v20110928-1505 | org.eclipse.ui.edit.paste | 1389111843130 |

The first column tells us what kind of thing happened—in this case, something was executed. The second column tells us what was executed—in this case, a command. The third column tells us the name of the bundle (a set of resources and code installed in Eclipse) this event belonged to—in this case, Eclipse’s user interface bundle. The fourth column gives us the version of the bundle. The fifth column tells us the name of the command that was executed—in this case, paste. The final column, a Unix timestamp that tells us when the command was executed, in Greenwich Mean Time—in this case, January 7, 2014 at 16:24:03 Greenwich Mean Time.
5.3.1.2 Limitations
Apart from the general limitations in collecting usage data (Section 5.5), one significant limitation of UDC that we have found is that sometimes it has unexpectedly incomplete data. For example, in planning a study involving when people ran their JUnit tests, we found that UDC recorded an event when the “Run > Run As > Run as JUnit Test” menu item was selected, but not when the “Run As” button was pressed on the toolbar. We suspect that the reason has to do with how different user interface accordances invoke the same functionality. In general, when you are planning to perform a study with UDC, be sure to know what types of events you are looking for, and test them to make sure UDC captures those events.
5.3.1.3 How to use it
Collecting usage data is fairly straightforward with Eclipse UDC, and we describe how to do so here. We also provide an accompanying screencast that shows the basics.4
Gathering data using the UDC client
Let us talk about how data is collected on a developer’s machine. Since UDC was last included in the Eclipse Indigo SR2 release,5 if you have the option of which Eclipse version to use, we recommend you use that version. By default, UDC starts collecting data when Eclipse is started. You can verify this by going to “Windows > Preferences,” then select the “Usage Data Collector” item (Figure 5.1). The Enable capture option should be checked.

Before looking at the data, execute a few commands and open a few views in Eclipse. Then, on your file system, open the following path as a subdirectory of your current workspace (Figure 5.2):
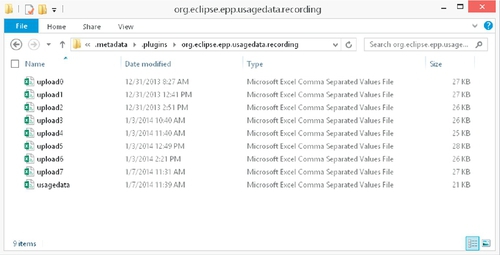
In that folder, depending on how many UDC events have been gathered, a number of comma-separated value (CSV) files will appear, where upload0.csv is the oldest and usagedata.csv is the newest. Open usagedata.csv—you should notice a large number and a large variety of events. Be sure to look specifically for events that you executed and views that you opened earlier.
Before doing a study, be aware that Eclipse will ask you and periodically attempt to upload data to the Eclipse Foundation server. You should not allow it to do this, because each time data is uploaded, the underlying CSV files are deleted. Furthermore, because the UDC project is no longer officially supported, the official Eclipse UDC server no longer accepts the data, so your usage data is, in effect, lost permanently. Unfortunately, there is no easy way to tell the UDC client to permanently store usage data. An easy work-around is to increase the upload period to allow enough time to complete the experiment(see Figure 5.3). The long-term fix for this issue is to either use some other tool, such as CodingSpectator (Section 5.3.3), to periodically submit the UDC data to your servers, or to modify the source code of UDC, as we will explain how to do shortly, to never upload data.

If you are doing a laboratory experiment, collecting data should be simply a matter of copying and deleting the CSV files after each participant has done the experiment. You can concatenate each file to the previous file, or put them in a database for analysis.
Modifying the UDC client
You may wish to modify the UDC client yourself, perhaps to add a custom filter for events or to disable data uploading. Whatever the reason, making modifications to the client is fairly easy.
The first step is to check out the UDC source code into your Eclipse workspace using git.6 Here we will again use Eclipse Indigo SR2, but we will specifically be using the “Eclipse for RCP and RAP Developers” download package because we will modify Eclipse plug-ins. Before you import the necessary plug-ins, we recommend your switching to the Indigo SR2 tag, to ensure compatibility with Eclipse. To do so, clone the git repository7 locally, open up “Tags,” right click on “Indigo SR 2,” and then choose “Checkout.”
To import the projects into Eclipse, right click on the repository, then click on “Import Projects,” then click on “Import Existing Projects.” The three core projects to import are as follows:
Next, we recommend a quick smoke test to determine whether you can actually make changes to the UDC client. Open UsageDataRecordingSettings.java, then modify the value of UPLOAD_URL_DEFAULT to "my_changed_server". Then, create a new debug configuration that is an Eclipse Application, and press “Debug” (Figure 5.4). Finally, you can verify that your change worked by going to UDC’s Uploading preference page, noticing that the Upload URL is now “my_changed_server.”

From here, you can make any changes to the UDC client that you wish. One thing you may want to do is upgrade UDC to work with more recent versions of Eclipse. The code is likely currently out of date because it has not been maintained since the UDC project was shut down. Another thing you may wish to do is to make available your new version of UDC via an Eclipse update site to the developers you want to study. There are many resources on the Web for plug-in deployment instructions, such as Lars Vogel’s tutorial on creating plug-ins.8
Transmitting data over the Internet
If you do not plan on doing a laboratory study where you can manually collect UDC usage files, you will want to have the UDC client send the data to you directly. As already mentioned, the best way to do this is probably by changing the default server URL in the client source code. An easy way to change the server when debugging is by adding the following Java virtual machine arguments:
However, simply changing the client to point at a new URL is insufficient, because there actually has to be a working server at that URL ready to receive UDC data. While the source code of the official Eclipse server was not officially made available, Wayne Beaton from the Eclipse Foundation unofficially released some of the PHP code from the Eclipse Foundation’s server.9 Since our PHP skills are rusty, next we will discuss how to create our own server using Java.
Creating your own server that receives UDC data is fairly straightforward. Let us create a simple one using Apache’s HttpComponents library, the same library that UDC uses to upload data. Specifically, we can create a server by simply extending Apache’s tutorial Web server.10 You can find this server in our GitHub repository.11
First, we will need a generic request handler to wait for HTTP connections:
We will also need a generic request listener:
And finally, we will need the guts of our server:
When this server is running and it receives a UDC upload, it will print a UserId, WorkspaceId, and the time of the upload. UserIds are randomly generated on the client side and are stored in a file in the developer’s home directory. As long as that file remains intact, future uploads from that developer will contain that UserId. WorkspaceIds are identifiers contained in each workspace, and can be used to uniquely (but anonymously) identify which workspace a set of data is uploaded from. Thus, there is normally only one UserId per computer, but there can be multiple WorkspaceIds per computer.
While there is some coding involved, setting up the UDC for Eclipse can provide thorough usage data collection for a project using Eclipse. For laboratory studies, not much setup is required. For larger or distributed studies, some infrastructure (a Web server) and code (the UDC data server) are required. Next we look at Mylyn and the Eclipse Mylyn Monitor component, which collects tool data like UDC, but also includes information about what program elements the programmer is working with.
5.3.2 Mylyn and the Eclipse Mylyn Monitor
Kersten and Murphy [7] created Mylyn, a task-focused user interface, a top-level project of the Eclipse IDE that is part of many of the Eclipse IDE configurations. To better support developers in managing and working on multiple tasks, Mylyn makes tasks a first class entity, monitors a developer’s interaction with the IDE for each task, and logs it in a so-called task context.
The first versions of Mylyn, originally called Mylar, were developed as part of the PhD research of Mik Kersten, and contained an explicit Mylyn Monitor component to collect and upload a developer’s activity within the Eclipse IDE. While the source code of the Mylyn Monitor can still be found online, it is not an active part of the Mylyn project anymore.
5.3.2.1 Data collected
Mylyn captures three types of developer interactions with the Eclipse development environment:
2. The editing of elements.
3. Commands in the IDE, such as saving or refactoring commands.
These interaction events are monitored and then stored in XML format in a log file. An interaction event log example of a developer selecting a Java class TaskEditorBloatMonitor.java in the package explorer of the Eclipse IDE is as follows:
The log entry contains among other information the kind of interaction event, in this case a selection, the full identifier of the element the developer interacted with, a Java type called TaskEditorBloatMonitor, the time when the interaction event occurred, in this case October 4, 2012, at 02:05:52 Central European Summer Time (CEST), and the place where the interaction event occurred, in this case the package explorer view of Eclipse.
You may notice that the log also contains an interest value, in this case 1.0. This value is used by Mylyn to calculate the interest a developer shows in a code element, the so-called degree of interest. The degree of interest of a code element, such as a class, method, or field, is based on the recency and frequency of interactions while working on a task. The more frequent and recent a developer selected and/or edited a code element, the higher the degree of interest. This degree-of-interest value is then used to highlight and/or filter elements in views of the IDE (see [7, 32]).
5.3.2.2 Logging interactions with the Mylyn Monitor
While the code for the Mylyn Monitor is not part of the active Mylyn project anymore, the code for the monitor and example code for using it can be found in the Incubator project online.12, 13 In the following, we will present relevant parts of the code from these examples to log the interactions.
To be able to use the Mylyn Monitor code and log the events of interest, there are two important classes you have to implement. First, you will need a plug-in class that extends the following plug-in:
Then, add a listener for the events that you are interested in to
Second, you will need to write the listener that creates the interaction event objects when an interaction event occurs. Let us assume you want to write a listener for selections of Java elements in the IDE. In this case you can extend the class org.eclipse.mylyn.monitor.ui.AbstractUserInteracti onMonitor and simply override the selectionChanged method. By extending the AbstractUserInteractionMonitor, you will automatically add your listener as a postselection listener to all windows in the current workbench so that all selection events in the windows are forwarded to your listener. The relevant code for the selectionChanged method is as follows:
The code first checks what type the selection has. If the selection is structured, and the first part of it is a Java Element, it collects the relevant information, and then creates an InteractionEvent with the information gathered, such as the interaction kind, the structure kind, and the element handle. At the end of the method, the MonitorUiPlugin is notified about the observed interaction event. The MonitorUiPlugin will then go through all registered interaction event listeners and forward the event to them. Since there is an InteractionEventLogger registered as part of the Mylyn code, the interaction event object will be forwarded to the logger and then written out into a file.
5.3.3 CodingSpectator
CodingSpectator14 is an extensible framework for collecting Eclipse usage data. Although researchers at the University of Illinois at Urbana-Champaign developed CodingSpectator primarily for collecting detailed data about the use of the Eclipse refactoring tool, it also provides a reusable infrastructure for submitting usage data from developers to a central repository. CodingTracker,15 described by Negara et al. [12, 21], is another data collector developed at the University of Illinois at Urbana-Champaign, and collects finer-grained IDE actions while reusing the data submission infrastructure provided by CodingSpectator.
5.3.3.1 Data collected
CodingSpectator was designed for capturing detailed data about the use of automated refactorings. It collects three kinds of refactoring events: canceled, performed, and unavailable. If a programmer starts an automated refactoring but quits it before it finishes, CodingSpectator records a canceled refactoring event. If a programmer applies an automated refactoring, CodingSpectator records a performed refactoring event. Finally, if a programmer invokes an automated refactoring but the IDE refuses to start the automated refactoring, indicating that the refactoring is not applicable to the selected program element, CodingSpectator records an unavailable refactoring event.
Eclipse creates a refactoring descriptor object for each performed refactoring event and serializes it in an XML file. CodingSpectator saves more data in Eclipse refactoring descriptors of performed refactorings. In addition, it creates and serializes refactoring descriptors for canceled and unavailable refactoring events. CodingSpectator supports 23 of the 33 automated refactorings that Eclipse supports.
We show a concrete example of the data that CodingSpectator collects for an invocation of the automated Extract Method refactoring in Eclipse, which extracts a piece of code into a new method. This refactoring moves a selected piece of code into a new method and replaces the selected code by an invocation to the new method. To use the automated Extract Method refactoring, a programmer has to go through multiple steps. First, the programmer selects a piece of code (Figure 5.5). Second, the programmer invokes the automated Extract Method and configures it (Figure 5.6). In this case, the programmer sets the name of the new method. The configuration page provides a number of other options, including method accessibility, the ordering and names of method parameters, and the generation of method comments. Third, after configuring the refactoring, the programmer hits the “Preview” button, and the automated refactoring reports the problems that the refactoring may introduce (Figure 5.7). In this example, the automated refactoring complains that the selected name of the new method conflicts with the name of an existing method. Finally, the programmer decides to cancel the refactoring, and CodingSpectator records a refactoring descriptor for this canceled refactoring, as shown in Figure 5.8. The type of refactoring event (i.e., unavailable, canceled, or performed) can be inferred from the directory in which the XML file containing the refactoring descriptor resides. CodingSpectator captures the following attributes for the canceled automated Extract Method refactoring in the above example:


1. captured-by-codingspectator: indicates that CodingSpectator created the refactoring descriptor.
2. stamp: a timestamp recording when the refactoring event occurred.
3. code-snippet, selection, selection-in-code-snippet, selection-text: the location and contents of the selection that the programmer made before invoking the automated refactoring.
4. id: the automated refactoring’s identifier.
5. comment, description, comments, destination, exceptions, flags, input, name, visibility: configuration options—for example, input elements, project, and settings that programmers can set to control the effect of the refactoring.
6. status: any problems reported by the automated refactoring to the programmer.
7. navigation-history: when the programmer pressed a button to navigate from one page of the refactoring wizard to another.
8. invoked-through-structured-selection, invoked-by-quick-assist: selection method (e.g., structured or textual selection and whether the automated refactoring was invoked using Quick Assist.
5.3.3.2 Deploying CodingSpectator
Deploying CodingSpectator consists of two main steps: (1) setting up a Subversion repository and (2) setting up an Eclipse update site.
1. Setting up a Subversion repository. CodingSpectator regularly submits developers’ data to a central Subversion repository. To collect CodingSpectator’s data automatically, you need to set up a Subversion repository and create accounts for your developers. To allow the developers to submit their data to the Subversion repository, you should grant them appropriate write accesses to the repository.
Using a version control system such as Subversion as the data repository has several advantages:
(a) Subversion makes all revisions of each file easily accessible. This makes troubleshooting easier.
(b) For textual files, Subversion submits only the changes made to the files as opposed to the entire new file. This differential data submission leads to faster submissions.
(c) There are libraries such as SVNKit16 that provide an API for Subversion operations such as add, update, remove, and commit. CodingSpectator uses SVNKit for submitting developers’ data to the central repository.
(d) Setting up a Subversion server is a well-documented process. This avoids the burden of setting up a specialized server.
On the other hand, a disadvantage of using Subversion as the data repository is that it requires the developers to maintain a copy of their data on their file systems. The Subversion working copy on the developers’ systems takes space, and can also cause merge conflicts—for example, if a developer restores the contents of the file system to an earlier version. To handle merge conflicts, CodingSpectator has built-in support for automatic conflict detection and resolution. When CodingSpectator detects a merge conflict, it removes the developer’s data from the central repository and then submits the new data. Despite removal of the data from the central repository, it is possible to locate the merge conflicts and restore the data that was collected before the conflicts occurred.
CodingSpectator prompts the developers for their Subversion user names and passwords when CodingSpectator is about to submit their data. CodingSpectator gives the developers the option to save their passwords in Eclipse securely. See http://codingspectator.cs.illinois.edu/documentation for more information on the features of CodingSpectator for developers.
2. Setting up an Eclipse update site. Users of CodingSpectator install it from an Eclipse update site.17 An Eclipse update site is an online repository of the JAR and configuration files that Eclipse requires for installing a plug-in.
You will have to customize CodingSpectator at least by specifying the URL of the Subversion repository to which CodingSpectator should submit developers’ data. You may also want to customize the message that CodingSpectator shows to the developers when it prompts them for their Subversion credentials. You can customize these aspects of CodingSpectator by changing the configuration files that are packed in the existing JAR files hosted on the Eclipse update site of CodingSpectator. If you need to customize CodingSpectator in more complex ways that involve changes to its source code, you should follow the instructions for building CodingSpectator’s update site from source code.
5.3.3.3 Extending CodingSpectator
In addition to collecting detailed refactoring data, CodingSpectator provides a reusable infrastructure for collecting Eclipse usage data. Extending CodingSpectator frees you from having to develop many features from scratch—for example, Subversion communications, automatic merge conflict detection and resolution, secure storage of Subversion credentials, and periodic update reminders.
CodingSpectator provides an Eclipse extension point (id = edu.illinois.codingspectator.monitor.core.submitter) and the following interface:
The above interface provides three hooks to CodingSpectator’s submission process. CodingSpectator checks out the Subversion repository into a folder, which we refer to as the watched folder. Then, it executes the Subversion commands (e.g., add and commit) on the watched folder. A plug-in that extends the submitter extension point and implements the SubmitterListener interface can perform actions before or after two of the Subversion commands that CodingSpectator executes: add and commit. For example, CodingSpectator overrides the method preSubmit to copy the recorded refactoring descriptors to the watched folder. As another example, the developers of CodingSpectator made the Eclipse UDC plug-in use the submitter extension point and copy the UDC data to the watched folder. As a result, CodingSpectator submits the UDC data to the Subversion repository. Effectively, this is an alternative method to the one presented in Section 5.3.1.3 for collecting UDC data in a central repository.
5.3.4 Build it Yourself for Visual Studio
This section shows how to implement a usage data collection tool for Visual Studio that generates the navigation ratio metric (see Section 5.2.2) daily, giving the developer insight into his or her own navigation patterns. Readers attempting the tutorial should be familiar with C# as well as have working knowledge of Visual Studio.
Because this extension is illustrative, some simplifications have been made that would need to be addressed in a widely deployed extension. For instance, this example extension does not perform any background processing; thus, the developer may notice a delay during Visual Studio start-up.
5.3.4.1 Creating a visual studio extension
1. Create a new extension solution. With the Visual Studio software development kit installed, create a new Visual Studio Extension project with a project name of “Collector” and a solution named “VisualStudioMonitor.” Set up the extension to provide a menu command named “Stop Monitoring” with a command ID of “StopMonitoring.” To separate the Visual Studio Extension setup code from the core functionality of the extension, create a second project within the same solution called “Monitor.”
2. Ensure the extension loads on start-up. The next step is to instruct the extension package to load when Visual Studio starts, by setting the attribute ProvideAutoLoad on the package class (CollectorPackage.cs). The globally unique ID (GUID) value in the listing below will load the package when Visual Studio starts:
3. Create the Monitor project. Add a class library type project to the “VisualStudioMonitor” solution. Because the class library must be signed, go to the “Properties” for the Monitor project and select “Signing” from the list at the right. In the “Signing” tab, check the “sign the assembly” checkbox, then under “Choose a strong name key file,” select “Browse” and browse over to the Key.snk file in the collector project (the file was created with the solution).
4. Create the monitoring class. The next step is to create a static class that will manage the log file, including starting, stopping recording data, and inserting data into the log file. Rename the class created by Visual Studio in the Monitor project as “DataRecorder.” Because we do not want more than one recorder running at a time and we want to access this class without instantiating it, make the class static. Create a method to start the recorder that generates a file name for the log file and sets a flag that the recording has started. A Stop method resets that flag and perhaps clears the file name. A method to write a log message to the file completes DataRecorder.
5. Connecting the extension framework with the recorder. Finally, insert a call to DataRecorder.Start() at the end of the Initialize() method in the CollectorPackage class. This will start the monitoring each time Visual Studio starts. You will need to add a reference for the Monitor project to the Collector project, make sure you sign the Monitor project, then rebuild the solution. See the listings for CollectorPackage.cs in Listing 5.1 and DataRecorder.cs in Listing 5.2.


5.3.4.2 Create the data model
The next step creates a data model for storing and managing event monitoring for Visual Studio. This includes designing the main event types and implementing a factory to create these events.
1. Implement the base class. Create the AbstractMonitoredEvent class in the Monitor project in Visual Studio. Then add properties for EventName and Classification as follows:
2. Enable serialization in the base class. So that we can store events in a configuration file then manipulate that configuration file later, we provision this abstract class for XML serialization of itself and its derived classes. .NET attributes support the XML serialization in this structure. The first attribute tells XML serialization that the MonitoredCommandEvent class is a derived class of AbstractMonitoredEvent that we will create next. This provides the ability to serialize and deserialize the public objects of the derived class by referencing the type of AbstractMonitoredEvent when creating a serializer. The second attribute creates an XML namespace that all derived classes will share with the AbstractMonitoredEvent class.
3. Create the concrete subclass. The next step is to create a derived class called MonitoredCommandEvent that inherits from AbstractMonitoredEvent. MonitoredCommandEvent implements a constructor that builds a MonitoredCommandEvent object from the Command class of the DTE.
The EnvDTE.Command object contains fields for Guid (a GUID string), ID and integer sub-id, and Name, a readable name for the command. To register an event handler for a EnvDTE.Command, you need to get an object reference for the command using the Guid and ID to identify the command. The Guid is a GUID for command events in Visual Studio; however, some command events share a GUID and distinguish themselves with different EventIDs. Thus, both elements are necessary to link a Command event from the DTE to an event handler in this extension. The Name is useful information to understand what the command is. There are several versions of the DTE object corresponding to versions of Visual Studio. Depending on the commands of interest, each version may need to be queried for its commands.
The constructor that takes a Command as input, simply extracts the necessary and relevant fields from the DTE’s Command object and transfers the matching information into the corresponding fields from this class and the AbstractMonitoredEvent class.
4. Enable serialization in concrete subclass. Ensure the class also includes a constructor that builds from an XElement and an output method ToXElement translates the object to XML for saving. Add using statements for System.Xml.Serialization, and EnvDTE and their corresponding references in the project References configuration.
The attribute for XMLRoot is the same attribute assigned to the AbstractMonitoredEvent class which tells XML Serialization that this type is a type belonging to the abstract class. In this class, create two public fields, EventID as int and Guid as string, that will save important information from the Visual Studio DTE object needed to engage monitoring for each command.
5. Create the event factory. To complete the Simple Factory pattern, a static factory class provides static factory methods that create an object of type MonitoredCommandEvent from a DTE Command object and returns it as an AbstractMonitoredEvent. For now the only class to consider is the MonitoredCommandEvent derived class; however, a future step will add more derived classes.
5.3.4.3 Storing visual studio command event information
Our extension is now wired to listen for events; however, events also need to be saved for later analysis. In this step we discuss how the data is collected and its persistence.
1. Create the collection manager class. In this step, build the MonitoredEventCollection class shown in Listing 5.6 that manages a List object of AbstractMonitoredEvent type.


2. Create and populate the configuration. Configuration data is stored in the List object. The List object is populated from an XML file that stores the configuration data. The MonitoredEventCollection class provides a method to query the DTE for all commands and initialize the list. Another method called after the DTE query stores the List contents in the same XML format file. These two methods should be called in sequence the first time the extension launches. After that, it reads the XML file on start-up to initialize the List. Call the method(s) to query, store, and load the event list from the Start() method of the DataRecorder class in the previous step so that the Monitor will load the commands on start-up.
Fortunately, the DTE object has a query method that lists all the commands it manages. The DTE Commands object returns an IEnumerable collection of EnvDTE.Command objects. The listing below provides a method to try to get an instance of the DTE. It depends on references to EnvDTE, Microsoft.VisualStudio.Shell.12.0, and Microsoft.VisualStudio.OLE.Interop, so be sure to add those to the project’s References list.
Once you have a reference to the DTE object from the tryGetDTEObject method, use the DTE to query the Commands object. Then process each command into the List managed by MonitoredEventCollection. Example code from the QueryVSForAddDTECommands method in MonitoredEventCollection.cs in Listing 5.6 is highlighted below, making use of the MonitoredEventFactory to generate each AbstractMonitoredEvent stored in the List. The try-catch here is necessary because the saved DTE object could be disposed while the loop processes the Commands.
3. Enable persistence of the configuration. A persistent configuration file helps independently manage the events that are monitored for a study, and makes the configuration of all possible events easier to manage. Using the framework’s ToXelement methods, build methods in MonitoredEventCollection to save the List of AbstractMonitoredEvents to the configuration file and load them from the configuration file. Below is the core code for the saveEventInterestTable method in MonitoredEventCollection.cs in Listing 5.6 that creates an XML serializer for the List object then writes that to the file stream:
5.3.4.4 Register event handlers
Now that the framework is complete and a configuration file for all command events to be monitored is ready, the methods to hook Visual Studio into event handlers that log each command can be created. This step will add methods and member objects to the AbstractMonitoredEvent and MonitoredCommandEvent classes to register event handlers with the DTE and dispose of them appropriately when necessary. The MonitoredEventCollection class gets a new method to perform the registration from the objects in the list and another method to deregister them.
1. Define the registration interface. The AbstractMonitoredEvent class should get a virtual RegisterEventForMonitoring method that takes an object parameter we will use to pass a DTE reference in. The method returns a bool based on successful registration. The class also gets a nonvirtual Dispose() method and a virtual Dispose(bool disposing) method, with the former calling the latter and the latter setting the field isDisposed to true. This is the typical dispose structure. Finally, the abstract class holds the nonvirtual method to write the event log information (the abstract class’s fields and a timestamp) to the log via the DataRecorder class. This unites logs for all derived classes into a common format.
2. Implement the registration routine. The MonitoredCommandEvent class in Listing 5.4 overrides the virtual RegisterEventForMonitoring method to implement registering an event handler for Command events. Registering first must find the event in the DTE and assign it to the field, then attach a new event hander to the event. Looking at the method listing below, we see the Guid and EventID are used as parameters to query the DTE Events object for the specific command event in this instance. The result is assigned to a field, eventTypeObject. With this reference to the event, the next block adds an event handler that runs after the command is executed. After all that, if the eventTypeObject is not null, the method returns true for success.


With the above method in Visual Studio, the missing fields and methods can be automatically generated via the “Generate” context menu command.
The last step with MonitoredCommandEvent is to create the Dispose method that will deregister the event handler. This looks as follows:
Use the Visual Studio “Generate” command to generate a method stub for OnAfterExecute and the code will compile. In the OnAfterExecute method, call ToLog so the event data is captured in the log.
3. Register all commands. MonitoredEventCollection in Listing 5.6 now needs methods to perform registration and deregistration on all the events in the list. As the following listing shows, RegisterEventInventoryForEventMonitoring() must get the DTE object, then walk through the IDEEventListenerRegistry list calling the abstract method RegisterEventForMonitoring with the DTE. If one of them succeeds, then this method considers it successful.
4. Connect to the package life cycle. Refactor the MonitoredEventCollection object in DataRecorder to a static class field. Then add a call to RegisterEventInventoryForEventMonitoring() in the Start() method of DataRecorder. Add a call to the deregister method of MonitoredEventCollection in the Stop() method of DataRecorder.
5. Execute the extension. Run the solution and use a few commands in Visual Studio, then give the Stop Collector command and check the log file. You should see output like the following:
Below are descriptions of the code listings for the example code we discussed in this section. Code listings can be found in Section 5.7.
• The listing for AbstractMonitoredEvent.cs in Listing 5.3 shows the additions to that class.


• The listing for CommandMonitoredEvent.cs in Listing 5.4 shows methods implemented for registration and disposal.
• The listing for MonitoredEventCollection.cs in Listing 5.6 shows list processing in calls to respective registration and deregistration methods for the List object.
• The DataRecorder class is shown in Listing 5.2.
With this demonstration, you see how to build a usage monitor for Visual Studio that records most commands the developer can issue in the IDE. What is missing? Well, there are other areas of the DTE to explore, such as editor events, unit test events, and build and debug session events that provide greater context to the developer experience. For brevity, capturing those events is left to readers to explore on their own.
Thus far we have been focusing on concrete usage data collection frameworks and the specific data collected by these frameworks. With options to collect data from both Visual Studio and Eclipse, we hopefully have provided a good resource to get you started on collecting and analyzing usage data. Next, let us look at methods and challenges in analyzing usage data.
5.4 How to Analyze Usage Data
The tools described in this chapter provide the usage data you can use to study developer interactions, but leave the selection of the methods for analyzing the data to the reader. In this section we discuss several data analysis techniques that you may apply to usage data. We will discuss attributes of the data, including format and anonymity of the data, categorizing the records, defining sequences, using state models, and other techniques to extract information from the usage data.
5.4.1 Data Anonymity
Nonanonymous data, where sensitive information, including source code snippets, change sets, and even access to the source code base, is provided, has obvious advantages. We can replay the developers’ activity stream, affording them a deep understanding of their actions [11]. There are few limits on how this data can be analyzed, and nonanonymous data is well suited for exploratory studies. Unfortunately, there are some key disadvantages. First, it may not be permitted for developers to participate in a study; typical enterprise developers may face termination of their contracts if they were to leak even parts of their source code base. Second, while playback and other deep analyses are possible, these analyses can be costly in terms of time and resources.
Anonymous data, where only records of activities and anonymous facts about artifacts are recorded, may at first seem strictly inferior. Indeed, there are some limitations on what can be learned from anonymous activity streams, yet there are key advantages. First, Snipes et al. [19] report that developers are more receptive to sharing anonymous data, and thus the ability to collect a large amount of information from many developers increases greatly. Second, because the data set is relatively large and is harvested from working developers, conclusions are ultimately more reliable.
In this section we focus on analyzing anonymous data sources. We do so because analyzing anonymous activity streams is similar to analyzing nonanonymous data streams (i.e., they are both activity streams) and because the unlimited variation of analysis permitted by nonanonymous data affords few generalities. As we discuss analyzing usage data, we start with straightforward magnitude analysis, build to a categorization system for activity streams, discuss dividing streams into sessions, and finally discuss state-based analysis.
5.4.2 Usage Data Format
Most usage data is collected as an activity stream with varying levels of supporting detail. In Figure 5.9 we present an abstraction of a typical activity stream. It includes a timestamp, followed by the activity, appended with (often anonymous) details concerning that activity. We can apply this model to the examples discussed earlier. For instance, the event recorded by UDC corresponds to a row in our theoretical model. It includes a timestamp (i.e., time), an activity description (i.e., what, kind, and description), and additional information (i.e., bundleId, bundleVersion). Similarly, the CodingSpectator example includes a timestamp (i.e., stamp), an activity description (i.e., id), and a much larger set of additional information (i.e., code-snippet, selection, selection-in-code-snippet, etc.). Because these and other usage data activity streams can easily be described using our abstraction, we will refer to it as we describe data analysis techniques.

5.4.3 Magnitude Analysis
A major advantage of anonymous usage data is the fact that it captures developers in their natural habitat, without any observational bias. Deriving conclusions from hours of developers’ fieldwork is naturally more convincing than deriving conclusions from hour-long, in-laboratory developer studies. One type of question that usage data is well suited to answer uses measurement of the magnitude of occurrence of a specific event. For instance, we may want to know how often developers invoke pull-up refactoring or how often a file search is invoked. By performing a count of a specific message in the collected logs, researchers can easily calculate the frequencies of specific actions, which can often be sufficient to answer important questions.
However, there are a few common issues with magnitude analysis. First, in any sufficiently large set of user logs there is a small set of developers who will use the feature/tool under analysis orders of magnitude more often than the general population, potentially skewing the data. Second, attempts to attribute time to individual activities are fraught with difficulties. For instance, there is a temptation to report the percentage of time spent doing activity X. Yet, because the data is based on a stream of activities, any time calculation requires making unsound assumptions about what happens in between these events.
The work by Murphy et al. [6] on understanding Eclipse IDE usage provides several examples of magnitude analysis being used effectively. By simply counting instances of events in developers’ activity streams, they were able to present how often developers accessed certain views, the top 10 commands executed by developers, and the percentage of developers who used each specific refactoring command. In spite of the simplicity of this analysis, it is ideal for identifying heavily used features for improvements and unused features for removal, as well as for getting a sense of how developers are currently working.
5.4.4 Categorization Analysis
While magnitude analysis is well suited for answering questions about the use of a single IDE command, many questions are related to a specific feature or tool in the IDE, which usually maps to multiple activities. For instance, the question “How often are refactorings performed?” cannot be answered via magnitude analysis alone, as refactorings can be triggered through a number of different IDE commands. These commands first need to be categorized, after which magnitude analysis can be used.
When focusing on a concrete subtask, such as refactoring, one may find it easy to categorize activities. In this case, all refactoring commands, such as pull-up or extract method, can be classified as refactorings. However, when focusing on more general behavior, such as editing, navigating, and searching, one may find categorization difficult. It is impossible to say, for instance, from a single click in the File Explorer window whether that click represents a search, as the developers browses a few promising files, or a navigation, as he or she implicitly opens a type declaration of a variable he or she was just browsing. Thus, categorization without context can produce noisy data in certain cases. However, categorization is a powerful tool, especially when there is little ambiguity in the IDE commands that are analyzed.
To illustrate both the power and the limitations of category analysis, consider the following IDE data stream, asking the question “Do developers use code search tools?”
For this question, the category of log events related to code search tools should be identified and counted. Modern IDEs commonly offer several code search tools, which operate at the global or local scale, such as the Find-in-Files and Quick Find tools. An example log from Visual Studio with these tools is shown in Figure 5.10. Using categorization analysis, we can identify three log events related to usage of code search tools, and report various statistics aimed at answering the question (e.g., number of code search events per day, number of code search events per developer; see Figure 5.11). However, the IDE usage data can sometimes be affected by noise, which cannot be avoided by categorization analysis. For instance, the second query to Find-in-Files is not followed by a developer click, which is a failed interaction with the Find-in-Files tool and should likely not be included in answering the question.


5.4.5 Sequence Analysis
Magnitude analysis and categorization are both appropriate for answering questions that are simply manifested in the IDE usage log. However, a more powerful way of analyzing activity logs is through sequence analysis, which first breaks the IDE data stream into a number of sequences, according to some criteria, and then reports on the characteristics of each sequence. A sequence in the IDE usage data corresponds to a software engineering task or subtask accomplished by the developer (e.g., refactoring or looking for a starting point for a maintenance task), consisting of all of IDE events in a given time span. For instance, answering the question “Are developers successful at finding initial points in the code for a software maintenance task?” requires that the sequence of IDE events corresponding to each maintenance task be identified before we can perform further analysis using either magnitude or categorization analysis. The granularity of a sequence is determined by the guiding question. For certain questions, we may be interested in a smaller sequence (e.g., searching the code base), while for others we may need to consider a longer time span (e.g., implementing a new feature, fixing a bug). According to Zou and Godfrey [33], the larger and more complex the task or subtask to extract, the harder it is for sequence analysis to determine its starting and stopping point in the activity log.
In many cases, extracting activity sequences can be challenging as it impossible to know exactly when a developer begins or ends a particular task or subtask without understanding the developer’s underlying thought process. There are several possibilities in how sequence extraction can be performed, based on the specific question. One possibility is to use sentinels, which are specific actions that indicate the beginning and end of a sequence. For instance, in the context of the code search question mentioned above, submitting a query to the code search tool begins a sequence, while performing an edit or structural navigation (e.g., following the call graph) ends the sequence. Another possibility is to use the passage of time to extract sequences, where time without any activity is used as a signal of task start or finish. Yet another possibility is to use locations in the code base to identify a sequence in the activity log. This is the key insight used in the algorithm of Coman and Sillitti [34], which uses periods of activity on the same program elements to represent the core of a task, and the time gap between such events to extract sequences corresponding to developer tasks. Laboratory validation studies of this algorithm have shown very high accuracy (80%) when compared with the ground truth reported by developers. Zou and Godfrey [33] found that this accuracy may not hold up in an industrial setting, where tasks are longer, code bases are more complex, and developer interruptions are common. Also, the algorithm requires that information regarding program elements be kept in the activity log, which may conflict with many developers’ privacy and anonymity requirements.
We illustrate sequence analysis with the usage log shown in Figure 5.12 and the question “Are developers successful at finding initial points in the code for a software maintenance task?” To answer the question, sequence analysis can extract two separate sequences in the log from Figure 5.12 by using sentinels indicative of start/end of a code search activity, among other possible sequence identification approaches. Both of the extracted search sequences can be deemed as successful since for each of the queries to the Find-in-Files code search tool the developer clicks on a retrieved result, followed by a structured navigation event (open caller/callee) or editing event (developer-edited code). Therefore, it would seem that the developer is successful at finding initial points in the code for his or her software maintenance task. However, on closer inspection of the second sequence, we observe that there is a large time gap between clicking on a result and editing code. The reason for this time gap is open to interpretation, as the developer may have returned to the previous results, continuing the search session, or may have started on a completely new development activity. Certain types of sequence analysis, such as Coman’s algorithm, take time into account when identifying sequences, while others, such as the sentinel approach used above, do not. Neither of these approaches, however, helps to resolve the origin of ambiguous events, which is left to the reader to characterize.

5.4.6 State Model Analysis
Another way to analyze log data is to view the log as a sequence of events occurring in a state machine. Using state models, we can quantify the occurrences of repeating actions and describe a usage pattern in statistical analysis. Nagappan and Robinson [35] used sequence analysis to generate a graphical view of a profile of how users interacted with the components of a system from log data. In state model analysis, the sequential data is converted to nodes and edges of a graph which represents the entire data in states and transitions between them. A Markov state model provides information about the probability of occurrence of each state and the transitional probability of each activity. The statistics provided in a Markov state model include the quantity of time the developer is in each state and the probability of the developer being in each state. From a given state, the model calculates the probability of each transition to different unique states. State models answer specific questions such as the following: What is the probability that once a developer searches the code, that developer edits a code element listed in the find results? Expanding this question, the probability of an entire use case or set of transitions through the usage model is calculable from the state model.
State model graphs make it easy to identify the most active states, and edges provide information about the important activities in the data set. As the number of states increases, the weighted directed graph (WDG) becomes more complex and hence more difficult to understand. When this occurs, summarizing the detailed event data into higher-level categories effectively combines the states to get more meaningful information. For example, classifying events in usage data of similar types into categories results in fewer states with the same number of transitions as the original data.
We generate a state model from a usage log by transforming the serially ordered events in sequence data to a WDG data structure. We can group the information in the log line to any level, such as event level, event category level, tool level, or application level. In the sequence data, each event is important as a stand-alone event; however, in the WDG representation, the importance shifts to adjacent pairs of events. Therefore, each group in the sequence data is represented by a unique node in the WDG. For example, suppose we choose to create a WDG at the level of an event. The analysis that generates the graph creates a node for each unique event name, then determines the transitions that occur in the log before and after that event name.
To understand how to interpret a state model, look at our example graph in Figure 5.14. We see that an edge exists from one node (head) to another (tail) if there is an occurrence of the event representing the tail node immediately after the event representing the head node in the log file. For example if event B follows event A in the log file, then there is a directed edge from node A to node B in the WDG. The edges are labeled with the number of times this transition has occurred. For example if event B occurs 50 times after event A in the log file, then the edge from node A to node B in the WDG is labeled with 50. Typically, we keep track of the actual count as the weight of the edge when building the graph. In the graph we display the percentage as the label. This percentage is proportional to the total number of transitions. The cumulative probability of out-edges of a node is 1. The transitional probabilities of each out-edge is calculated by dividing the number of transactions of that out-edge by the sum of all outward transactions from that node. We could also store the dynamic parameter information in each log line as a list along the edges.


As an example, consider the sample log file shown in Figure 5.13 and the corresponding state model graph in Figure 5.14. Intuitively, you can see how the state model represents the log states and transitions between them in the sequence of events.
Converting a log into a state model requires three steps. We use Java Usage Model Builder (JUMBL) from the Software Quality Research Laboratory (SQRL) of the University of Tennessee. Details on input formats and JUMBL tools are available on SourceForge.18
1. First, convert the log file into a representation for each transition called a sequence-based specification. The format for a sequence-based specification in CSV files is described in the JUMBL user guide. This representation contains the following information with one row for each transition:
• Count of transitions
• Total time elapsed
• State in information
• State out information
2. After the sequence-based specification has been imported, JUMBL can write out the representation of a state model as a TML script or in several other formats, including Graph Modeling Language (GML), that graph tools can import. The TML script has information about the nodes, the out-edges from each node, and the number of transitions from each node to another node. The corresponding graph for the usage log example is depicted in Figure 5.14.
With the use of state models, sequence data with hundreds of thousands of lines can be quickly converted to more meaningful graphical representation using this method. Once the TML file has been generated, we can use JUMBL to find out the state probabilities of each state. Using the state probability and the usage patterns, we can draw conclusions about the occupancy of individual states and the use cases that involve transitions through several states.
5.4.7 The Critical Incident Technique
The critical incident technique (CIT) is a general method for improving a process or system with respect to a set of objectives. The CIT prescribes a systematic study of the critical incidents. Critical incidents are positive or negative events that have a significant effect on the objectives.
The CIT was developed and published in its current form by Flanagan [36] in 1954. Nevertheless, it is believed that the technique was introduced even earlier by Galton (ca 1930). Variations of the CIT have been widely used in the field of human factors [37].
Del Galdo et al. [38] applied the CIT to human-computer interaction as part of evaluating the documentation of a conferencing system. They asked the study participants to perform a task and report any incident that they ran into. The researchers observed the participants during the study, analyzed the reported incidents, and proposed improvements to the documentation accordingly.
In the context of IDEs, Vakilian and Johnson [10] adapted the CIT to automated refactorings. The goal of this study was to identify the usability problems of automated refactorings by analyzing refactoring usage data. The researchers found that certain events such as cancellations, reported messages, and repeated invocations are likely indicators of the usability problems of automated refactorings. By locating these events in the usage data and analyzing their nearby events, the researchers were able to identify 15 usability problems of the Eclipse refactoring tool. For instance, the usage data indicated that six participants invoked the Move Instance Method refactoring a total of 16 times, but none finished the refactoring successfully. In all cases, the participants either canceled the refactoring or could not proceed because of an error that the refactoring tool reported. By inspecting these critical incidents, the researchers were able to infer two usability problems related to the Move Instance Method.
To apply the CIT on a set of usage data, you should follow several steps. First, identify the objectives. Finding usability problems is only one example. Second, identify a set of events that may be critical incidents. These are events they may have significant effects on your objectives. Usually, the negative critical incidents, which may have negative effects on the objectives, are better indicators of problems than the positive ones. Third, identify the critical incidents in your usage data. Fourth, collect sufficient contextual information to interpret the critical incidents. This may include events that have occurred in close time proximity to the critical incidents. You may even have to interview the developers or ask them to report their explanations of the incidents during the study. Although the developer reports may be short or incomplete, they can provide more insight into the nature of the problems. Finally, evaluate the effectiveness of the critical incidents and revisit the steps above. The process that we described for applying the CIT on usage data is iterative in nature—that is, it is natural to go back to a previous step from each step.
5.4.8 Including Data from Other Sources
Other data sources, such as developer feedback, task descriptions, and change histories, can provide context for usage data and yield new opportunities for supporting developers. In this section, we briefly outline some related work in this area.
5.4.8.1 Developer feedback
Usage data collection can be augmented by explicit developer feedback to establish a ground truth. For instance, if you want to understand a developer’s opinion of a tool or his or her purpose for using an IDE feature, it is best to ask about it. A postanalysis interview can shed light on your observations and confirm your analysis or point out different aspects.
Information on a developer’s activities can provide an additional rationale to the usage data and explain the developer’s actions. Asking questions about how well the developer knows the code he or she is working on can explain a developer’s navigation patterns and usage of code search [19], while questions about the task—for example, implementing a new feature versus fixing a bug—can explain other characteristics, such as the amount of editing versus testing.
5.4.8.2 Tasks
As mentioned earlier, Mylin is a popular extension to the Eclipse IDE that supports task management, reducing the effort for a developer to switch between tasks and maintaining relevant information for each task [7]. In the context of a specific task, Mylin collects usage data in order to compute a degree-of-interest value for each program element, which represents the interest the developer has in the program element for the task at hand. Program elements that a developer interacted with frequently and recently have a higher degree-of-interest value. Using these calculated degree-of-interest values, Mylyn highlights the elements relevant for the current task and filters unnecessary information from common views in the IDE.
5.4.8.3 Change history
The FastDash tool created by Biehl et al. [39] enables real-time awareness of other developers’ actions (e.g., focus or edits to a specific file) by utilizing usage data in concert with the source files and directories. FastDash’s purpose is to reduce faults caused by lack of communication and lack of awareness of activities that other developers are performing on the same code base. The tool highlights other developer’s activity as it is occurring using a sophisticated dashboard on the developer’s screen or on a team’s dashboard.
Using this overview of analysis techniques should give you a good start in analyzing usage data. The ideas you bring to your usage data analysis process provide the real opportunities for innovating usage-data-based research. Next we discuss limitations we have observed when collecting and analyzing usage data.
5.5 Limits of What You Can Learn from Usage Data
Collecting usage data can have many interesting and impactful applications. Nonetheless, there are limits to what you can learn from usage data. In our experience, people have high expectations about what they can learn from usage data, and those expectations often come crashing down after significant effort implementing and deploying a data collection system. So before you begin your usage data collection and analysis, consider the following two limitations of usage data.
1. Rationale is hard to capture. Usage data tells you what a software developer did, but not why he or she did it. For example, if your usage data tells you that a developer used a new refactoring tool for the first time, from a trace alone you cannot determine whether (a) the developer learned about the tool for the first time, (b) the developer had used the tool earlier, but before you started collecting data, or (c) the developer’s finger slipped and the developer pressed a hotkey by accident. We do not know whether the developer is satisfied with the tool and will use it again in the future. It may be possible to distinguish between these by collecting additional information, such as asking the developer just after he or she had used the tool why he or she used it, but it is impossible to definitively separate these on the basis of the usage data alone.
2. Usage data does not capture everything. It is practically impossible to capture “everything,” or at least everything that a developer does, so using the goal-question-metric method helps narrow the scope of data required. If you have a system that captures all key presses, you are still lacking information about mouse movements. If you have a system that also captures mouse movements, you are still missing the files that the developer is working with. If your system also captures the files, you are still lacking the histories of those files. And so on. In a theoretical sense, one could probably collect all observable information about a programmer’s behavior, yet the magnitude of effort required to do so would be enormous. Furthermore, a significant amount of important information is probably not observable, such as rationale and intent. Ultimately, usage data is all about fitness for purpose—is the data you are analyzing fit for the purpose of your questions?
To avoid these limitations, we recommend thinking systemically about how the data will be used while planning rather than thinking about usage data collection abstractly. Invent an ideal usage data trace, and ask yourself:
• Does the data support my hypothesis?
• Are there alternative hypotheses that the data would support?
• Do I need additional data sources?
• Can the data be feasibly generated?
Answering these questions will help you determine whether you can sidestep the limitations of collecting and analyzing usage data.
5.6 Conclusion
Analyzing IDE usage data provides insights into many developer activities which help identify ways we can improve software engineering productivity. For example, one study found developers spend more than half of their time browsing and reading source code (excluding editing and all other activities in the IDE) [19]. This finding supports initiatives to build and promote tools that improve the navigation experience by supporting structural navigation. Other references mentioned in this chapter leveraged usage data to identify opportunities to improve refactoring tools [8, 10]. By identifying task contexts through usage data, Mylyn made improvements to how developers manage their code and task context [7].
If the last two decades can be labeled the era of big data collection, the next two decades will surely be labeled as the era of smarter big data analysis. Many questions still remain: How do we balance data privacy and data richness? What are the long-term effects of developer monitoring? How can we maximize the value of data collection for as many questions as possible, and reduce the strain on developers providing the data? How can we provide the right data to the right person at the right time with the least effort? Answering these questions will help the community advance in usage data collection and analysis.
Usage data, while now widely collected, still remains a resource largely untapped by practitioners and researchers. In this chapter, we have explained how to collect and analyze usage data, which we hope will increase the ease with which you can collect and analyze your own usage data.
5.7 Code Listings
The following code listings show the code mentioned in Section 5.3.4.
Listing for CollectorPackage.cs
Listing for DataRecorder.cs
Listing for AbstractMonitoredEvent.cs
Listing for MonitoredCommandEvent.cs
Listing for MonitoredEventFactory.cs

Listing for MonitoredEventCollection.cs