Past, Present, and Future of Analyzing Software Data
Christian Bird*; Tim Menzies†; Thomas Zimmermann* * Microsoft Research, Redmond, WA, USA
† Computer Science, North Carolina State University, Raleigh, NC, USA
Acknowledgments
The work of this kind of book falls mostly on the authors and reviewers, and we’re very appreciative of all those who took the time to write and comment on these chapters. The work of the reviewers was particularly challenging because their feedback was required in a very condensed timetable. Accordingly, we offer them our heartfelt thanks.
We’re also grateful to the Morgan Kaufmann production team for their hard work in assembling this material.

So much data, so little time.
Once upon a time, reasoning about software projects was inhibited by a lack of data. Now thanks to the Internet and open source, there’s so much data about software projects that it’s impossible to manually browse through it all. For example, at the time of writing (December 2014), our Web searches shows that Mozilla Firefox has over 1.1 million bug reports, and platforms such as GitHub host over 14 million projects. Furthermore, the PROMISE repository of software engineering data (openscience.us/repo) contains data sets, ready for mining, on hundreds of software projects. PROMISE is just one of more than a dozen open source repositories that are readily available to industrial practitioners and researchers; see the following table.

Repositories of Software Engineering Data
| Repository | URL |
| Bug Prediction Dataset | http://bug.int.usi.ch |
| Eclipse Bug Data | http://www.st.cs.uni-saarland.de/softevo/bug-data/eclipse |
| FLOSSMetrics | http:/flossmetrics.org |
| FLOSSMole | http://flossmole.org |
| International Software Benchmarking Standards Group (IBSBSG) | http://www.isbsg.org |
| Ohloh | http://www.ohloh.net |
| PROMISE | http://promisedata.googlecode.com |
| Qualitas Corpus | http://qualitascorpus.com |
| Software Artifact Repository | http://sir.unl.edu |
| SourceForge Research Data | http://zeriot.cse.nd.edu |
| Sourcerer Project | http://sourcerer.ics.uci.edu |
| Tukutuku | http://www.metriq.biz/tukutuku |
| Ultimate Debian Database | http://udd.debian.org |
It is now routine for any project to generate gigabytes of artifacts (software code, developer emails, bug reports, etc.). How can we reason about it all? The answer is data science. This is a rapidly growing field with immense potential to change the day-to-day practices of any number of fields. Software companies (e.g., Google, Facebook, and Microsoft) are increasingly making decisions in a data-driven way and are in search of data scientists to help them.
1.1 Definitions
It is challenging to define software analytics for software engineering (SE) since, at different times, SE analytics has meant different things to different people. Table 1.1 lists some of the more recent definitions found in various papers since 2010. Later in this introduction, we offer a short history of work dating back many decades, any of which might be called “SE data analytics.”
Table 1.1
Five Definitions of “Software Analytics”
| Hassan A, Xie T. Software intelligence: the future of mining software engineering data. FoSER 2010: 161-166. | [Software Intelligence] offers software practitioners (not just developers) up-to-date and pertinent information to support their daily decision-making processes. |
| Buse RPL, Zimmermann T. Analytics for software development. FoSER 2010:77-90. | The idea of analytics is to leverage potentially large amounts of data into real and actionable insights. |
| Zhang D, Dang Y, Lou J-G, Han S, Zhang H, Xie T. Software analytics as a learning case in practice: approaches and experiences. MALETS 2011. | Software analytics is to enable software practitioners to perform data exploration and analysis in order to obtain insightful and actionable information for data driven tasks around software and services (and software practitioners typically include software developers, tests, usability engineers, and managers, etc.). |
| Buse RPL, Zimmermann T. Information needs for software development analytics. ICSE 2012:987-996. | Software development analytics … empower(s) software development teams to independently gain and share insight from their data without relying on a separate entity. |
| Menzies T, Zimmermann T. Software analytics: so what? IEEE Softw 2013;30(4):31-7. | Software analytics is analytics on software data for managers and software engineers with the aim of empowering software development individuals and teams to gain and share insight from their data to make better decisions. |
| Zhang D, Han S, Dang Y, Lou J-G, Zhang H, Xie T. Software analytics in practice. IEEE Softw 2013;30(5):30-7. | With software analytics, software practitioners explore and analyze data to obtain insightful, actionable information for tasks regarding software development, systems, and users. |
One reason for this wide range of definitions is the diversity of services and the diversity of audiences for those services. SE data science covers a very wide range of individuals and teams including, but not limited to, the following:
1. Users deciding what funds to allocate to that software;
2. Developers engaged in software development or maintenance;
3. Managers deciding what functionality should be assigned to which developers engaged in that development of maintenance;
4. Analysts trying to reduce code runtimes;
5. Test engineers developing work arounds to known problems;
6. And many more besides these five.
It would be very brave, and very inaccurate, to say that one definition of “analytics” holds across this diverse range. For example, Table 1.2 shows nine different information needs seen in interviews with 100+ software managers and developers [1].
Table 1.2
Space of Information Needs that can be Addressed by Data Science in SE
| Past | Present | Future | |
| Exploration Find important conditions. | Trends Quantifies how an artifact is changing. Useful for understanding the direction of a project. | Alerts Reports unusual changes in artifacts when they happen. Helps users respond quickly to events. | Forecasting Predicts events based on current trends. Helps users make pro-active decisions. |
| Analysis Explain conditions. | Summarization Succinctly characterizes key aspects of artifacts or groups of artifacts. Quickly maps artifacts to development activities or other project dimensions. | Overlays Compares artifacts or development histories interactively. Helps establish guidelines. | Goals Discovers how artifacts are changing with respect to goals. Provides assistance for planning. |
| Experimentation Compare alternative conditions. | Modeling Characterizes normal development behavior. Facilitates learning from previous work. | Benchmarking Compares artifacts to established best practices. Helps with evaluation. | Simulation Tests decisions before making them. Helps when choosing between decision alternatives. |

Other work has also shown the broad range of information needs for different audiences. For example, the paper “Analyze This! 145 Questions for Data Scientists in Software Engineering” lists over 12 dozen different kinds of questions that have been seen in the information needs of software developers [2]. Note that each of these may require a different kind of analysis before an SE data scientist can answer the particular questions of specific users (as shown in the last column of Table 1.3).
Table 1.3
Mapping Information Needs (Left) to Automatic Technique (Right)
| Information Need | Description | Insight | Relevant Techniques |
| Summarization | Search for important or unusual factors to associated with a time range. | Characterize events, understand why they happened. | Topic analysis, NLP |
| Alerts (& Correlations) | Continuous search for unusual changes or relationships in variables | Notice important events. | Statistics, Repeated measures |
| Forecasting | Search for and predict unusual events in the future based on current trends. | Anticipate events. | Extrapolation, Statistics |
| Trends | How is an artifact changing? | Understand the direction of the project. | Regression analysis |
| Overlays | What artifacts account for current activity? | Understand the relationships between artifacts. | Cluster analysis, repository mining |
| Goals | How are features/artifacts changing in the context of completion or some other goal? | Assistance for planning | Root-cause analysis |
| Modeling | Compares the abstract history of similar artifacts. Identify important factors in history. | Learn from previous projects. | Machine learning |
| Benchmarking | Identify vectors of similarity/difference across artifacts. | Assistance for resource allocation and many other decisions | Statistics |
| Simulation | Simulate changes based on other artifact models. | Assistance for general decisions | What-if? analysis |

We use the term “data scientist” to denote a person who can handle all these techniques (and more) as well as and adapt them to different information needs. As the following historical notes show, organizations have had “data scientists” for many years—albeit not as high demand or highly paid as in the current environment. Organizations hire these data scientists to explore the local data to find models that most answer the questions of most interest to the local business users [3]. These scientists know that before they apply technique XYZ, they first spend much time with their business users learning their particular problems and the specific information needs of their domain.
1.2 The Past: Origins
Moving on from definitions, we now offer a historical perspective on SE data analytics. Looking back in time, we can see that this is the fourth generation of data science in SE. This section describes those four generations.
However, before doing that, we add that any historical retrospective cannot reference all work conducted by all researchers (and this is particularly true for a field as large and active as data science in software engineering). Hence, we apologize in advance to any of our colleagues not mentioned in the following.
1.2.1 Generation 1: Preliminary Work
As soon as people started programming, it became apparent that programming was an inherently buggy process. As recalled by Wilkes [4], speaking of his programming experiences from the early 1950s:
“It was on one of my journeys between the EDSAC room and the punching equipment that ’hesitating at the angles of stairs’ the realization came over me with full force that a good part of the remainder of my life was going to be spent in finding errors in my own programs.”
It took several decades to gather the experience required to quantify the size/defect relationship. In 1971, Akiyama [5] described the first known “size” law, stating that the number of defects D was a function of the number of LOC; specifically:
In 1976, Thomas McCabe argued that the number of LOC was less important than the complexity of that code [6]. He argued that code is more likely to be defective when its “cyclomatic complexity” measure was over 10.
Not only is programming an inherently buggy process, it’s also inherently difficult. Based on data from 63 projects, in 1981 Boehm [7] proposed an estimator for development effort that was exponential on program size:
At the same time, other researchers were finding repeated meta-level patterns in software development. For example, in the late 1970s, Lehman proposed a set of laws of software evolution to describe a balance between (1) forces driving new developments and (2) forces that slow down progress [8]. For example, the law of continuing change states that an “e-program” (whose behavior is strongly connected to the environment where it runs) must always be continually adapted or it will become progressively less satisfactory.
1.2.2 Generation 2: Academic Experiments
From the late 1980s, some data scientists starting analyzing software data using algorithms taken from artificial intelligence research. For example, Selby and Porter found that decision-tree learners could identify which components might be error-prone (or having a high development cost) [9]. After that, very many researchers tried very many other AI methods for predicting aspects of software projects. For example, some researchers applied decision trees and neural networks to software effort estimation [10] or reliability-growth modeling [11]. Yet other work explored instance-based reasoning by analogy [12] or rough sets [13] (again, for effort estimation).
1.2.3 Generation 3: Industrial Experiments
From around the turn of the century, it became more common for workers at industrial or government organizations to find that data science can be successfully applied to their software projects.
For example, Norman Schneidewind explored quality prediction via Boolean discriminant functions for NASA systems [14]. Also at NASA, Menzies and Feather et al. used AI tools to explore trade-offs in early lifecycle models [15] or to guide software inspection teams [16].
Further over at AT&T, Ostrand and Weyuker and Bell used binomial regression functions to recognize 20% of the code that contained most (over 80%) of the bugs [17]. Other prominent work in this time frame included:
• Zimmermann et al. [18] who used association rule learning to find patterns of defects in a large set of open source projects.
• Nagappan, Ball, Williams, Vouk et al. who worked with Nortel Networks and Microsoft to show that data from those organizations can predict for software quality [19, 20].
1.2.4 Generation 4: Data Science Everywhere
After the above, it became harder to track the massive growth in data science for SE. Many organizations such as Google, Facebook, and Microsoft (and others) routinely apply data science methods to their data. Since 2005, at many conferences, it has became routine to find papers from industrial practitioners and/or academics applying data science methods to software projects. Additionally, since 2010, we have seen a dramatic increase in the starting salaries of our graduate students who take industrial data science positions.
Further, various conferences have emerged that devote themselves to SE data science. At the time of writing, it is now routine for many SE conference papers to use data miners. However, during the last decade, two conferences lead the way: the Mining Software Repositories conference and the PROMISE conference on repeatable experiments in SE. Both communities explore data collection and its subsequent analysis with statistics or data mining methods, but each community has a particular focus: the MSR community is mostly concerned with the initial data collection while PROMISE community is more concerned with improving the efficacy and repeatability of that data’s analysis. This book focuses more on the MSR community, while another book (Sharing Data and Models in Software Engineering, Morgan Kaufmann, 2014) offers the PROMISE perspective on data analysis.
1.3 Present Day
Data science has became so popular that at the time of writing (May, 2014), there is something of an unsustainable “bubble” in this area. Over the past few years, the volume and types of data related to SE has grown at an unprecedented rate and shows no sign of slowing. This turn of events has led to a veritable gold rush, as many “big data” enthusiasts mine raw data and extract nuggets of insight. A very real danger is that the landscape may become a Wild West where inexperienced software “cowboys” sell hastily generated models to unsophisticated business users, without any concern for best or safe practices (e.g., such as the best practices documented in this book).
To some extent, the current “bubble” in data is not surprising. New technologies such as data science typically follow the “hype curve” of Figure 1.1. Just like the dot-coms in the late 1990s, the current boom in “big data” and data science is characterized by unrealistic expectations. However, as shown in Figure 1.1, if a technology has something to offer, it won’t stay in the trough of disillusionment. Internet-based computing survived the “dot-gone” meltdown of 1999–2001 and has now risen to a new sustainable (and growing) level of activity. We are confident that data science will also endure and thrive as a important technology for the decades to come.

One goal of this book is to go “behind the hype” and demonstrate proven principles for a sustainable data science industry. One standout result from this book is that data science needs data scientists. As shown by the examples in this book, data science for SE can be an intricate task involving extensive and elaborate combinations of tools. Further, it is not enough to merely use those tools—it is also necessary to understand them well enough to adapt and integrate them into some human-level process. Hence, to use data science properly, organizations need skilled practitioners, extensive knowledge of humans and of organizations, a broad skill set, and a big toolkit of methods.
For example, consider the technology used in the chapter “Analytical Product Release Planning” by Maleknaz Nayebi and Guenther Ruhe. As shown below, this list of technology is not short. Further, it is representative of the kind of data science solutions being deployed today in many organizations.
The automatic methods discussed in that chapter include:
• DBScan (which is a kind of density-based clustering algorithm);
• Attribute weighting; Preprocessing of data (e.g., to filter out erroneous values or to fill in missing values); and
• Methodological tools for assessing a learned model (e.g., leave-n-out experiments; different performance measures).
However, that chapter does not stop at mere automatic methods. Recalling part our definition (shown above), we said that the goal of data science is “to gain and shareinsightfrom data to make better decisions.” Note how this “insight” is a human-reaction to data analysis. Therefore, it is vital that automatic tools be augmented with human-in-the-loop interaction. As examples of that kind of human-level analysis, Nayebi and Ruhe use:
• Qualitative business modeling;
• Amazon’s Mechanical Turk;
• Combining algorithmic vs. expert judgement;
• Aggregation of expert judgments.
The bad news is that this kind of analysis is impossible without trained and skilled data scientists. The good news is that the community of trained and skilled data scientists, while not large, is growing. Maryalene LaPonsie calls “data scientists” the “the hottest job you haven’t heard of” [21]. She writes that “The University of California San Diego Extension lists data mining and analytics as the second hottest career for college graduates in 2011. Even the Cheezburger Network, home of the web’s infamous LOLCats, recently brought a data scientist on board.”
In any field with such rapid growth, there are two problems:
1. How do we train the newcomers?
2. How do we manage them?
As to the issue of training, most people in SE data science currently get their knowledge about analysis from general data analysis texts such as data mining texts [22], statistical texts [23], etc. While these are useful, they are aimed at a broader audience and do not include common issues in SE (as a simple example, unlike many fields, most SE metrics are not normally distributed). This aim of this book is to focus on how analysis is applied to real-world SE. This book will discuss a range of methods (from manual to automatic and combinations in the middle). Our goal in this book is to give readers an understanding of the breadth of analysis methods possible for a wide range of data taken from SE projects. A companion bookSharing Data and Models in Software Engineering takes a different in-depth approach (where the same data is analyzed in-depth by many different ways using many different methods) [24].
As for the issue of management, it can be difficult for senior managers to effectively lead teams where the teams are working on technologies that are so novel and disruptive as data science. For such senior managers, we offer the following advice:
• It ain’t all hardware: In the era of Google-style inference and cloud computing, it’s a common belief that a company can analyze large amounts of data merely by building (or renting) a CPU farm, then running some distributed algorithms, perhaps using Hadoop (http://hadoop.apache.org) or some other distributed inference mechanism. This isn’t the case. In our experience, while having many CPUs is (sometimes) useful, the factors that determine successful software analytics rarely include the hardware. More important than the hardware is how that hardware is used by skilled data scientists.
• It ain’t all tools:Another misconception we often see relates to the role of software. Some managers think that if they acquire the right software tools—Weka, Matlab, and so on—then all their analytical problems will be instantly solved. Nothing could be further from the truth. All the standard data analysis toolkits come with built-in assumptions that might be suitable for particular domains. Hence, a premature commitment to particular automatic analysis tools can be counterproductive.
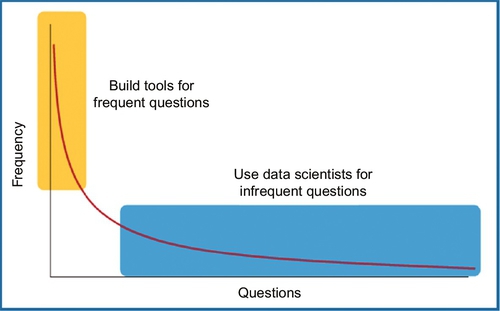
In our view, one vital role for a data scientist is to uncover the right hardware and the right tools for a particular application. At the start of a data science project, when it isn’t clear what the important factors in a domain are, a good data scientist will make many ad hoc queries to clarify the issues in that domain. Subsequently, once the analysis method stabilizes, it will then be possible to define what hardware and software tools would best automate any of the routine and repeated analysis tasks.
We can illustrate this process in Figure 1.2. As shown most data science projects mature by moving up along a curve. Initially, we might start in the darker region (where the queries are many, but the repeated queries are few) and then move into the lighter region (where we repeatedly make a small number of queries). This diagram leads to one of our favorite mantras for managing data science projects:
For new problems, deploy the data scientists before deploying tools or hardware.
As for other principles for data science, in our Inductive Engineering Manifesto [25], we made some notes on what characterizes best practices in industrial data mining. Combining them with the above, we arrive at six points from this chapter and five further points:
2. It ain’t all software.
3. Data science needs data scientists–especially during that initial analysis stage where the goal is to find (a) the most informative queries (that should be automated) and (b) the right hardware and the right tools to automate that query.
4. Users before algorithms. Data mining algorithms are only useful in industry if users fund their use in real-world applications. The user perspective is vital to inductive engineering. The space of models that can be generated from any dataset is very large. If we understand and apply user goals, then we can quickly focus an inductive engineering project on the small set of most crucial issues.
5. Broad skill set, big toolkit. Successful inductive engineers routinely try multiple inductive technologies. To handle the wide range of possible goals an inductive engineer should be ready to deploy a wide range of tools. Note that the set of useful inductive technologies is large and constantly changing. Therefore, use tools supported by a large ecosystem of developers who are constantly building new learners and fixing old ones.
6. Deploy the data scientists before deploying tools or hardware—especially for new problems.
7. Plan for scale: In any industrial application, data mining is repeated many times to (a) answer additional questions raised by the users; or (b) make some enhancement and/or bug fix to the method, or (c) to deploy it to a different set of users. That is, for serious studies, to ensure repeatability, the entire analysis should be automated using some high-level scripting language.
8. Early feedback. Continuous and early feedback from users allows needed changes to be made as soon as possible and without wasting heavy up-front investment. Prior to conducting very elaborate studies, try applying very simple tools to gain rapid early feedback.
9. Be open-minded.It’s unwise to enter into an inductive study with fixed hypotheses or approaches, particularly for data that hasn’t been mined before. Don’t resist exploring additional avenues when a particular idea doesn’t work out. We advise this because data likes to surprise: initial results often change the goals of a study when business plans are based on issues irrelevant to local data.
10. Do smart learning. Important outcomes are riding on your conclusions. Make sure you check and validate them. There are many such validation methods such as repeat the analysis N times on, say, 90% of the available data—then check how well your conclusions hold across all those samples.
11. Live with the data you have. You go mining with the data you have, not the data you might want or wish to have at a later time. Because we may not have control over how data is collected, it’s wise to clean the data prior to learning. For example, before learning from a dataset, conduct instance or feature selection studies to see what spurious data can be removed.
1.4 Conclusion
This is an exciting time for those of us involved in data science and the analysis of software data. Looking into the very near future, we can only predict more use of data science in SE. By 2020, we predict
• more algorithms,
• faster decision making with the availability of more data and faster release cycles,
• more people involved in data science as it becomes more routine to mine data,
• more education as more people analyze and work with data,
• more roles for data scientists and developers as this field matures with specialized subareas,
• more real-time data science to address the challenges of quickly finding patterns in big data,
• more data science for software systems such as mobile apps and games, and
• more impact of social tools in data science.
As an example of this last point, check out Human Boosting by Harsh Pareek and Pradeep Ravikumar, which discusses how to boost human learning with the help of data miners [26]. In the very near future, this kind of human(s)-in-the-loop analytics will become much more prevalent.