
Mining Android Apps for Anomalies
Konstantin Kuznetsov*; Alessandra Gorla†; Ilaria Tavecchia‡; Florian Groß*; Andreas Zeller* * Software Engineering Chair, Saarland University, Saarbrücken, Germany
† IMDEA Software Institute, Pozuelo de Alarcon, Madrid, Spain
‡ SWIFT, La Hulpe, Bruxelles, Belgium
Abstract
How do we know a program does what it claims to do? Our CHABADA prototype can cluster Android™ apps by their description topics and identify outliers in each cluster with respect to their API usage. A “weather” app that sends messages thus becomes an anomaly; likewise, a “messaging” app would typically not be expected to access the current location and would also be identified. In this paper we present a new approach for anomaly detection that improves the classification results of our original CHABADA paper [1]. Applied on a set of 22,500+ Android applications, our CHABADA prototype can now predict 74% of novel malware and as such, without requiring any known malware patterns, maintains a false positive rate close to 10%.
Acknowledgments
This work was funded by the European Research Council (ERC) Advanced Grant “SPECMATE—Specification Mining and Testing.”
10.1 Introduction
Detecting whether a mobile application behaves as expected is a prominent problem for users. Whenever they install a new app on their mobile device, they run the risk of it being “malware”—i.e., to act against their interests. Security researchers have largely focused on detecting malware in Android™ apps, but their techniques typically check new apps against a set of predefined known patterns of malicious behavior. This approach works well for detecting new malware that uses known patterns, but does not protect against new attack patterns. Moreover, in Android it is not easy to define what malicious behavior is and therefore to define its key features to detect malware. The problem is that any specification on what makes behavior beneficial or malicious very much depends on the current context.
Typical Android malware, for instance, sends text messages to premium numbers, or collects sensitive information from users, such as mobile number, current location, and contacts. However, this very same information, and the very same operations, frequently occur in benign applications as well. Sending text messages to premium numbers is for instance a legitimate paying method to unlock new app features; tracking the current location is what a navigation app has to do; and collecting the list of contacts and sending it to an external server is what most free messaging apps like WhatsApp do upon synchronization. The question thus is not whether the behavior of an app matches a specific malicious pattern or not; it is whether an app behaves as one would expect.
In our previous work we presented CHABADA, a technique to check implemented app behavior against advertised app behavior [1]. We analyzed the natural language descriptions of 22.500+ Android applications, and we checked whether the description matched the implemented behavior, represented as a set of application programming interfaces (APIs). The key of CHABADA is to associate descriptions and API usage to detect anomalies.
Our CHABADA approach includes the five steps illustrated in Figure 10.1:

1. CHABADA starts with a collection of 22,500+ supposedly “benign” Android applications downloaded from the Google Play Store.
2. Using Latent Dirichlet Allocation (LDA) on the app descriptions, CHABADA identifies the main topics (“theme,” “map,” “weather,” “download”) for each application.
3. CHABADA then clusters applications by related topics. For instance, if there were enough apps whose main description topics are “navigation” and “travel,” they would form one cluster.
4. In each cluster, CHABADA identifies the APIs each app statically accesses. It only considers sensitive APIs, which are governed by a user permission. For instance, APIs related to Internet access are controlled by the “INTERNET” permission.
5. Using unsupervised learning, CHABADA identifies outliers within a cluster with respect to API usage. It produces a ranked list of applications for each cluster, where the top apps are most abnormal with respect to their API usage—indicating possible mismatches between description and implementation. Unknown applications would thus first be assigned to the cluster implied by their description and then be classified as being normal or abnormal.
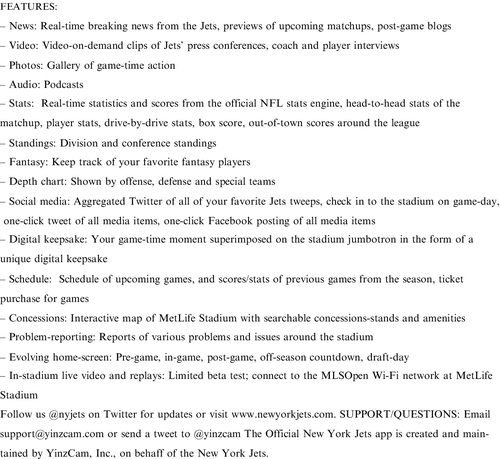
By flagging anomalous API usage within each cluster, CHABADA is set up to detect any suspicious app within a set of similar apps and can therefore detect whether an app has any mismatch between advertised and implemented behavior. We show how this works in practice with a real app as an example. Figure 10.2 shows the description of the Official New York Jets team app,2 available from the Google Play Store. Its description clearly puts it into the “sports” cluster.
In addition to expected common API calls, the version of the Official New York Jets app we analyzed can check whether GPS location is available, via the API method LocationManager.addGpsStatusListener(), and can send text messages, via the API method SmsManager.sendTextMessage(), which are highly uncommon operations for this kind of application. These API method calls, together with similar others, make Official New York Jets an outlier within the “sports” cluster. By flagging such anomalies, CHABADA can detect false advertising, plain fraud, masquerading, and other questionable behavior. CHABADA can be used as a malware detector as well. By training it on a sample of benign apps, CHABADA can classify new apps as benign or malware, without any previous notion of malicious behavior.
This chapter extends our previous conference paper [1] by presenting several new techniques that lead to significant improvements:
1. We now rank down irrelevant APIs when looking for anomalies. Specifically, we give a lower weight to APIs that are common within a particular cluster (e.g., Internet access, which is frequently used in applications). By giving more importance to less common behavior, CHABADA can highlight outliers more easily.
2. We incorporate an additional technique for anomaly detection. The anomaly detection of CHABADA is now based on a distance-based algorithm, which allows clearly identifying the APIs that make an app anomalous.
3. To use CHABADA as a classifier of malicious applications, we now run anomaly detection as a preliminary step, and we exclude the anomalies from the training set. This allows to remove noise from the training set, and consequently to improve the abilities of the classifier. CHABADA can now predict 74% of malware as such (previously 56%), and suffers from only 11% of false positives (previously 15%).
4. We can now automatically select the optimal parameters for the classifier. This also contributes to the improvement of CHABADA as a malware classifier.
The remainder of this paper is organized as follows. We first describe how CHABADA clusters applications by description topics in Section 10.2. This book chapter does not improve our first paper [1] on this side, but we include a description of this step for the sake of completion. Section 10.3 describes how in each cluster we detect outliers with respect to their API usage. In particular, we describe the new algorithm that CHABADA uses, and we highlight the advantages of the new approach. Section 10.4 evaluates the improvements of CHABADA. After discussing the related work (Section 10.5), Section 10.6 closes with conclusions and future work.
10.2 Clustering Apps by Description
The intuition behind CHABADA is simple: applications that are similar, in terms of their descriptions, should also behave similarly. As a consequence, applications that behave differently from their similars should be further inspected, as they may have malicious behavior. For this, we must first establish what makes two descriptions “similar”. We start with describing our Android apps collection, and how we collected it (Section 10.2.1). After initial processing (Section 10.2.2), CHABADA identifies topics of app descriptions (Section 10.2.3), and then clusters the apps based on common topics (Section 10.2.4 to Section 10.2.6).
10.2.1 Collecting Applications
CHABADA is based on detecting anomalies from “normal,” hopefully benign applications. As a base for such “normal” behavior, CHABADA relies on a large set of applications from the Google Play Store, the central resource for Android apps. Our automated crawler ran at regular intervals (i.e., every 2 weeks) during the Winter and Spring of 2013, and for each of the 30 categories in the Google Play Store, downloaded the top 150 free 3 applications in each category. A single complete run of our script thus returned 4500 apps; as the top 150 apps shifted during our collection, we obtained a total of 32,136 apps across all categories.
In addition to the actual app (coming as an android application package (APK) file), we also collected the store metadata—such as name and description.
10.2.2 Preprocessing Descriptions with NLP
Before subjecting app descriptions to topic analysis, CHABADA applies standard techniques of natural language processing (NLP) for filtering and stemming [2].
App descriptions in the Google Play Store frequently contain paragraphs in multiple languages—for instance, the main description is in English, while at the end of the description developers add a short sentence in different languages to briefly describe the application. To be able to cluster similar descriptions, CHABADA has to work on a single language, and because of its predominance we chose English. CHABADA relies on Google’s Compact Language Detector4 to detect the most likely language of the app description, and it removes non-English paragraphs.
After multi-language filtering, CHABADA removes stop words (common words such as “the,” “is,” “at,” “which,” “on,” …), and applies stemming on all descriptions employing the power of Natural Language Toolkit.5 Stemming is a common NLP technique to identify the word’s root, and it is essential to make words such as “playing,” “player,” and “play” all match to the single common root “plai”. Stemming can improve the results of later NLP processes, since it reduces the number of words. CHABADA also removes non-text items such as numerals, HTML tags, links, and email addresses thanks to specific Python modules such as HTMLParser.6
As an example, consider the description of Official New York Jets in Figure 10.2; after the preprocessing phase, it appears as:
action aggreg amen android anytim anywher app around audio behalf beta blog box break can catch chart check clip coach com concess concessions-stand confer connect countdown creat defens depth devic digit divis draft-dai drive drive-by-dr email engin everi evolv experi facebook fantasi favorit featur follow form galleri game game-dai game-tim head-to-head home-screen in-gam in-stadium inc interact interview issu item jet jumbotron keep keepsak leagu limit live maintain make map matchup media metlif mlsopen mobil moment network new newyorkjet nfl now nyjet off-season offens offici one-click out-of-town part photo player podcast post post-gam pre-gam press preview previou problem problem-report purchas question real-tim replai report schedul score searchabl season see send shown social special stadium stai stand stat statist superimpos support team test ticket touch track tweep tweet twitter uniqu upcom updat us variou video video-on-demand visit want watch wi-fi yinzcam york
We remove from our dataset those applications whose description has less than 10 words after the preprocessing we just described. We also eliminate all applications without any sensitive APIs (see Section 10.3 for details). This resulted in a final set of 22,521 apps, which form the basis for CHABADA.
10.2.3 Identifying Topics with LDA
To identify sets of topics for the apps under analysis, CHABADA resorts to topic modeling using Latent Dirichlet Allocation (LDA) [3].
LDA is an unsupervised, statistical algorithm that discovers latent semantic topics in a collection of text documents. LDA represents documents as random mixtures over multiple latent topics, where each “topic” is characterized by a distribution over a fixed vocabulary of words. Given a set of documents and the number of topics, LDA produces the probability distribution of each topic-document pair and of each word-topic pair, and consequently learns, for each topic, a set of words.
By analyzing a set of app descriptions on sports and social networking, for instance, LDA would group words such as “team,” “soccer,” “league,” and “sport” into one topic, and “share,” “facebook,” “twitter,” and “suggest” into another topic. Applications whose description is mainly about sports would thus be assigned to the first topic, since most of the words occurring in the description belong to the first group. Applications such as the Official New York Jets, however, would be assigned to both topics, as the words in the description appear in both groups.
CHABADA feeds the NLP pre-processing output (i.e., the English text without stop words and after stemming) into the Mallet framework [4]. CHABADA can be freely configured to choose the number of topics to be identified by LDA; by default it identifies 30, the number of categories covered by the apps in the Google Play Store. Furthermore, by default CHABADA is configured such that an app can belong to at most four topics. Limiting the number of topics an app can belong to makes the clustering more effective in our experience.
Table 10.1 shows the resulting list of topics for the 22,521 descriptions that we analyzed with CHABADA; the “assigned name” is the abstract concept we assigned to that topic. Our example application, Official New York Jets, is assigned to these four topics:
Table 10.1
Topics Mined from Android Apps
| Id | Assigned Name | Most Representative Words (Stemmed) |
| 0 | “personalize” | galaxi, nexu, device, screen, effect, instal, customis |
| 1 | “game and cheat sheets” | game, video, page, cheat, link, tip, trick |
| 2 | “money” | slot, machine, money, poker, currenc, market, trade, stock, casino coin, finance |
| 3 | “tv” | tv, channel, countri, live, watch, germani, nation, bbc, newspap |
| 4 | “music” | music, song, radio, play, player, listen |
| 5 | “holidays” and religion | christmas, halloween, santa, year, holiday, islam, god |
| 6 | “navigation and travel” | map, inform, track, gps, navig, travel |
| 7 | “language” | language, word, english, learn, german, translat |
| 8 | “share” | email, ad, support, facebook, share, twitter, rate, suggest |
| 9 | “weather and stars” | weather, forecast, locate, temperatur, map, city, light |
| 10 | “files and video” | file, download, video, media, support, manage, share, view, search |
| 11 | “photo and social” | photo, friend, facebook, share, love, twitter, pictur, chat, messag, galleri, hot, send social |
| 12 | “cars” | car, race, speed, drive, vehicl, bike, track |
| 13 | “design and art” | life, peopl, natur, form, feel, learn, art, design, uniqu, effect, modern |
| 14 | “food and recipes” | recip, cake, chicken, cook, food |
| 15 | “personalize” | theme, launcher, download, install, icon, menu |
| 16 | “health” | weight, bodi, exercise, diet, workout, medic |
| 17 | “travel” | citi, guid, map, travel, flag, countri, attract |
| 18 | “kids and bodies” | kid, anim, color, girl, babi, pictur, fun, draw, design, learn |
| 19 | “ringtones and sound” | sound, rington, alarm, notif, music |
| 20 | “game” | game, plai, graphic, fun, jump, level, ball, 3d, score |
| 21 | “search and browse” | search, icon, delet, bookmark, link, homepag, shortcut, browser |
| 22 | “battle games” | story, game, monster, zombi, war, battle |
| 23 | “settings and utils” | screen, set, widget, phone, batteri |
| 24 | “sports” | team, football, leagu, player, sport, basketbal |
| 25 | “wallpapers” | wallpap, live, home, screen, background, menu |
| 26 | “connection” | device, connect, network, wifi, blootooth, internet, remot, server |
| 27 | “policies and ads” | live, ad, home, applovin, notif, data, polici, privacy, share, airpush, advertis |
| 28 | “popular media” | seri, video, film, album, movi, music, award, star, fan, show, gangnam, top, bieber |
| 29 | “puzzle and card games” | game, plai, level, puzzl, player, score, challeng, card |
• Topic 24 (“sports”) with a probability of 63.1%
• Topic 8 (“share”) with a probability of 17.7%
• Topic 10 (“files and videos”) with a probability of 10.4%
• Topic 6 (“game”) with a probability of 6.7%
10.2.4 Clustering Apps with K-means
Topic modeling can assign application descriptions to topics with a certain probability. What we want, however, is to cluster applications with similar descriptions within the same group. It would appear reasonable to consider obtained topics as separate clusters, but unfortunately topic modeling does not provide a binary decision of whether a description belongs to a particular topic. Moreover, each description may be related to many topics, and even with equal probability, so it would not be clear how to choose a specific cluster for a given application description.
As a consequence, CHABADA uses K-means [5], one of the most common clustering algorithms, to group applications with similar descriptions, and it does so by using topic probabilities as features. Given a set of elements and the number of clusters K to be identified, K-means selects one centroid for each cluster, and then associates each element of the dataset to the nearest centroid, thus identifying clusters. It should be noted that using words instead of topics would significantly increase the dimension of the feature space and would thus make K-means almost ineffective.
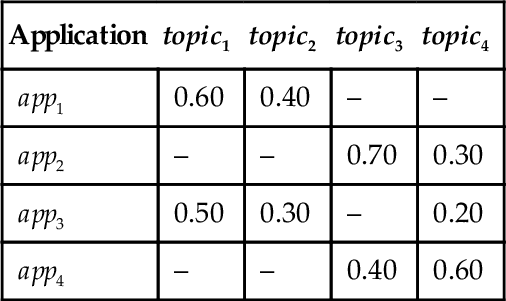
In this context, we use applications as the elements to be clustered, and we use the probabilities of belonging to topics as features. As an example, Table 10.2 shows four applications app1 to app4, with the corresponding probabilities of belonging to topics. If we applied K-means to partition the set of applications into two clusters, it would create one cluster with app1 and app3, and a second cluster with app2 and app4.
10.2.5 Finding the Best Number of Clusters
One of the challenges with K-means is to estimate the number of clusters that should be created. The algorithm needs to be given either some initial potential centroids, or the number K of clusters to identify. There are several approaches to identifying the best solution, among a set of possible clustering solutions. Therefore, CHABADA runs K-means several times, each time with a different K number, to obtain a set of clustering solutions it would then be able to evaluate. The range for K covers solutions among two extremes: having a small number of clusters (even just 2) with a large variety of apps; or having many clusters (potentially even one per app) and thus being very specific. CHABADA fixes num_topics × 4 as an upper bound, since according to the default settings an application can belong to up to four topics.
To identify the best solution, i.e., the best number of clusters, CHABADA uses the elements silhouette, as discussed in [6]. The silhouette of an element is the measure of how closely the element is matched to the other elements within its cluster, and how loosely it is matched to other elements of the neighboring clusters. When the value of the silhouette of an element is close to 1, the element is in the appropriate cluster. If the value is close to − 1, instead, the element is in the wrong cluster. Thus, to identify the best solution, CHABADA computes the average of the elements’ silhouette for each solution using K as the number of clusters, and selects the solution whose silhouette is closest to 1.
10.2.6 Resulting App Clusters
Table 10.3 shows the list of clusters that CHABADA identifies for the 22,521 apps we analyzed. Each of these 32 clusters contains apps whose descriptions contain similar topics, listed under “Most Important Topics”. The percentages reported in the last column represent the weight of specific topics within each cluster.
Table 10.3
Clusters of Applications
| Id | Assigned Name | Size | Most Important Topics |
| 1 | “sharing” | 1453 | share (53%), settings and utils, navigation and travel |
| 2 | “puzzle and card games” | 953 | puzzle and card games (78%), share, game |
| 3 | “memory puzzles” | 1069 | puzzle and card games (40%), game (12%), share |
| 4 | “music” | 714 | music (58%), share, settings and utils |
| 5 | “music videos” | 773 | popular media (44%), holidays and religion (20%), share |
| 6 | “religious wallpapers” | 367 | holidays and religion (56%), design and art, wallpapers |
| 7 | “language” | 602 | language (67%), share, settings and utils |
| 8 | “cheat sheets” | 785 | game and cheat sheets (76%), share, popular media |
| 9 | “utils” | 1300 | settings and utils (62%), share, connection |
| 10 | “sports game” | 1306 | game (63%), battle games, puzzle and card games |
| 11 | “battle games” | 953 | battle games (60%), game (11%), design and art |
| 12 | “navigation and travel” | 1273 | navigation and travel (64%), share, travel |
| 13 | “money” | 589 | money (57%), puzzle and card games, settings and utils |
| 14 | “kids” | 1001 | kids and bodies (62%), share, puzzle and card games |
| 15 | “personalize” | 304 | personalize (71%), wallpapers (15%), settings and utils |
| 16 | “connection” | 823 | connection (63%), settings and utils, share |
| 17 | “health” | 669 | health (63%), design and art, share |
| 18 | “weather” | 282 | weather and stars (61%), settings and utils (11%), navigation and travel |
| 19 | “sports” | 580 | sports (62%), share, popular media |
| 20 | “files and videos” | 679 | files and videos (63%), share, settings and utils |
| 21 | “search and browse” | 363 | search and browse (64%), game, puzzle and card games |
| 22 | “advertisements” | 380 | policies and ads (97%) |
| 23 | “design and art” | 978 | design and art (48%), share, game |
| 24 | “car games” | 449 | cars (51%), game, puzzle and card games |
| 25 | “tv live” | 500 | tv (57%), share, navigation and travel |
| 26 | “adult photo” | 828 | photo and social (59%), share, settings and utils |
| 27 | “adult wallpapers” | 543 | wallpapers (51%), share, kids and bodies |
| 28 | “ad wallpapers” | 180 | policies and ads (46%), wallpapers, settings and utils |
| 29 | “ringtones and sound” | 662 | ringtones and sound (68%), share, settings and utils |
| 30 | “theme wallpapers” | 593 | wallpapers (90%), holidays and religion, share |
| 31 | “personalize” | 402 | personalize (86%), share, settings and utils |
| 32 | “settings and wallpapers” | 251 | settings and utils (37%), wallpapers (37%), personalize |

“Size” is the number of applications in the respective cluster. “Most Important Topics” list the three most prevalent topics; most important (¿10%) shown in bold. Topics less than 1% not listed.
The clusters we identified are quite different from the categories we would find in an app store such as the Google Play Store. Cluster 22 (“advertisements”), for instance, is filled with applications that do nothing but display ads in one way or another; these apps typically promise or provide some user benefit in return. Cluster 16 (“connection”) represents all applications that deal with Bluetooth, Wi-Fi, etc.; there is no such category in the Google Play Store. The several “wallpaper” clusters, from adult themes to religion, simply represent the fact that several apps offer very little functionality.
The Official New York Jets app ended up in Cluster 19, together with other applications that are mostly about sports. Table 10.3 lists the clusters of apps related by their descriptions in which we now can search for outliers with respect to their behavior.
10.3 Identifying Anomalies by APIs
After clustering apps based on similarity of their description topics, CHABADA searches for outliers regarding their actual behavior. Section 10.3.1 shows how CHABADA extracts API features from Android binaries. Section 10.3.2 describes how it filters the APIs to be used as features, and how it weighs APIs according to their importance. Section 10.3.3 describes how CHABADA detects API outliers, while Section 10.3.4 describes how CHABADA can be used as a classifier.
10.3.1 Extracting API Usage
As discussed in the introduction, CHABADA uses static API usage as a proxy for behavior. API use is straightforward: while Android bytecode can also be subject to advanced static analysis such as information flow analysis and standard obfuscation techniques that easily thwart any static analysis, API usage has to be explicitly declared; in Android binaries, as in most binaries on other platforms, static API usage is easy to extract. For each Android application, CHABADA extracts the (binary) APK file with apktool,7 and with a smali parser extracts all API invocations.
10.3.2 Sensitive and Rare APIs
Using all API calls would result in too much information to represent the behavior of an application. Therefore, we focus on a subset of APIs only, namely sensitive APIs that are governed by an Android permission setting. These APIs access sensitive information (such as the user’s picture library, camera, or microphone) or perform sensitive tasks (altering system settings, sending messages, etc.). When installing an app, the user must explicitly permit usage of these APIs. For this purpose, each Android app includes a manifest file that lists the permissions the application needs to run. To obtain the set of sensitive APIs, we relied on the work of Felt et al., who identified and used the mapping between permissions and Android methods [7]; CHABADA only considers a sensitive API to be used by the app if and only if it is declared in the binary and if its corresponding permission is requested in the manifest file. This allows eliminating API calls that are used within third party libraries, and not used by the application directly.
As an example for such sensitive APIs, consider Table 10.4. These are some of the APIs used by the Official New York Jets app that are governed by a specific permission; through these APIs, the app accesses the GPS status, accesses the WiFi status, sends text messages, and executes arbitrary shell commands. The score of each API method expresses its impact on the overall anomaly score of the app. The anomaly score will be introduced and explained in the next section. Table 10.4 reports the top APIs ordered by anomaly score.
Table 10.4
Filtered APIs Used in Official New York Jets that Make this App an Outlier in its Cluster
| com.yinzcam.nfl.jets | Anomaly Score 10,920.1 |
| Feature importance: | |
| android.location.LocationManager.addGpsStatusListener() | 2900.00 |
| android.net.wifi.WifiManager.pingSupplicant() | 2900.00 |
| android.net.wifi.WifiManager.setWifiEnabled() | 1452.51 |
| android.telephony.SmsManager.sendTextMessage() | 1162.01 |
| java.lang.Runtime.exec() | 970.02 |
Each application is associated to an anomaly score, which is explained in Section 10.3.
As each permission governs several APIs, going for permissions alone would be too few features to learn from; going for sensitive APIs allows a much more fine-grained characterization of the application behavior. Section 10.4 provides empirical evidence that using APIs as features yields better results than using permissions.
Filtering the APIs by considering only the sensitive ones considerably limits the number of features. In [1] we show that it is possible to identify anomalous apps by using all sensitive APIs as features. However, we noticed that among the sensitive APIs there are some that are not as interesting as others. For instance, Internet access is governed by the “INTERNET” permission, and consequently any API requiring this permission should be considered as a sensitive one. However, most apps access the Internet, so accessing the Internet is not an important feature for an application, since it has no discriminating power. On the contrary, sending text messages (governed by the “SEND-SMS” permission) is not a common feature among Android apps, and should thus be considered more than others. The cluster context, however, must be taken into account, since wallpaper applications, for instance, do not often use Internet connection, and consequently this could be a discriminating feature.
Removing common features would be too aggressive. Instead, we employ feature ranking based on statistical analysis. We then use different weights either to emphasize or diminish a particular feature. Our strategy is similar to IDF (inverse document frequency) [8], which is a part of the TF-IDF measure, well known in information retrieval. It is intended to reflect how important a word is to a document in a collection of documents (typically referred to as corpus).
Accordingly, we define weights with the following formula:
The weight Wa of an API a is obtained by dividing the total number of applications (N) in a cluster by the number of applications dfa calling the API a and then taking the logarithm of that quotient. Thus, the weight of a rare API is high, whereas the weight of a common API is likely to be low.
Section 10.4 provides empirical evaluation that using IDF helps CHABADA identify the important features for anomaly detection.
10.3.3 Distance-Based Outlier Detection
Now that we have all API features for all apps, the next step is to identify outliers—i.e., those applications whose API usage would be abnormal within their respective topic cluster. Since we have no notion about an underlying generating model for our data, it is reasonable to utilize a non-parametric approach to identify these outliers. Namely, we changed CHABADA such that it uses a distance-based technique [9], i.e., it uses the distance of an app to the other apps within the same cluster as a measure of anomaly. Distance-based approaches can identify outliers according to different definitions:
1. Outliers are those elements with fewer than k neighbors, where a neighbor is an element that is within a maximum specified distance [9].
2. Outliers are those elements whose distance to their respective k-th nearest neighbor is highest. This is what is usually referred as the k-Nearest Neighbors (k-NN) algorithm [10].
3. Outliers are those elements whose average distance to their respective k nearest neighbors is highest [11].
CHABADA uses Orca, an open source framework that implements distance-based outlier detection [12]. The distance function of Orca computes the Euclidean distance of two apps in the feature space (i.e., the APIs). The first definition of outliers requires specifying the maximum neighborhood, and does not provide ranking scores for the outliers. The second definition does not take into account the local density of samples. Thus, CHABADA identifies anomalies by considering the average distance of an element, i.e., an app in the cluster, to the k nearest neighbors. The idea is that if there are other samples that are close to the candidate in the feature space, then the sample is probably not an outlier. We use 5 as the value for k, since this number offers a good trade-off between two extremes: a small value for k would be too sensitive to noise, and would therefore miss many outliers; on the other hand, a high value for k would regard almost any app as an outlier.
CHABADA uses the average distance to the 5 closest neighbors as the “anomaly” score of each app in the cluster, and it ranks the apps according to this score. The higher the score, the more anomalous the behavior of an app is. Some apps may be flagged as anomalies because they use few APIs that are never (or seldomly) used in the cluster. Others may be considered anomalies because they use combinations of APIs that do not occur frequently. Table 10.4 shows the anomaly score for the Official New York Jets app, and shows the features with the highest values, i.e., the APIs that have the highest impact on the final anomaly score.
By virtue of this distance-based technique, CHABADA can assign an anomaly score to each app within each cluster. However, these anomalies are meant to be manually evaluated, and it is therefore critical to select a cut-off value. Apps whose anomaly score is above this cut-off value would be reported as anomalies, and the ones below this value would be considered normal. It is non-trivial to select a cut-off value, as it strongly depends on the data. An easy solution would be to report as outliers a certain fraction of the data, namely the apps with the highest score. An alternative common approach would be to use quartile statistics.
The potential outliers here would be those apps whose score exceeds the third quartile by more than 1.5 times the interquartile range (third quartile minus first quartile). This is one of the standard measures for identifying outliers in a dataset.
Within various clusters the anomaly scores differ widely in their their range, contrast, as well as in their meaning, and unfortunately this makes it difficult to interpret and compare the results. In many cases, an identical outlier score in two different clusters can denote substantially different degrees of outlierness, depending on different local data distributions. Simple normalization for k-NN does not result in good contrast between outliers and inlier scores, since it just scales data onto the range ![]() . A solution to this problem is to represent values as a probability of an application of being an outlier.
. A solution to this problem is to represent values as a probability of an application of being an outlier.
Following the approach proposed by Kriegel et al. [13] CHABADA transforms the anomaly scores into probabilities using Gaussian Scaling.
Without drawing any assumptions on the distribution of the data, we can suppose, according to the central limit theorem, that the computed anomaly scores have normal distribution. Given the sample mean μ and the sample standard deviation σ of the set of anomaly scores S, we can use its cumulative distribution function and the “Gaussian error function” erf() to turn the anomaly score into a probability value:

All applications with non-zero probability are reported by CHABADA as outliers.
10.3.4 CHABADA as a Malware Detector
CHABADA can also be used to detect malware. For this task we use One-Class Support Vector Machine learning (OC-SVM) [14], which is an unsupervised machine learning technique to learn the features of one class of elements. The learned model can then be used to evaluate new apps, and the classifier can decide whether they are similar or different to the training set. Note that this is in contrast to the more common usage of support vector machines as classifiers, where each app additionally has to be labeled as belonging to a specific class—say, “benign” vs. “malicious”—during training.
OC-SVMs have been successfully applied in various contexts that span from document classification [15] to automatic detection of anomalous Windows registry access [16]. In our context, the interesting feature of OC-SVM is that one can provide only samples of one class (say, of regular benign applications), and the classifier will be able to identify samples belonging to the same class, tagging the others as malware. OC-SVMs, therefore, are mainly used in those cases in which there exist many samples of one class of elements (e.g., benign applications), and not many samples of other classes (e.g., malicious applications).
The OC-SVM algorithm first projects input data into a high dimensional feature space via an appropriate kernel function, and considers the origin as the only sample different from the training data. It then identifies the maximal margin on the hyperplane that best separates the training data from the origin. The kernel mapping is necessary since usually data in the initial feature space are not separable via linear hyperplane division.
A training dataset containing anomalies would not result in a good model, since outliers could significantly influence the decision boundary of a OC-SVM. With the filtered APIs as features (as described in Section 10.3.2), CHABADA first identifies outliers, as described in Section 10.3.3, and then trains a OC-SVM within each cluster with the subset of the applications that were not tagged as outliers. Thus, the obtained model represents the APIs that are commonly used by the applications in that cluster. The resulting cluster-specific models are then used to classify new apps, which can be benign, and thus expected to have features that are similar to the trained model, or malicious, and thus expected to differ. Our OC-SVM uses a radial-bases-function (Gaussian) kernel, which is the most commonly used for OC-SVM. It has been shown that for this type of classification it performs better than other kernels (e.g., linear or polynomial) [17], which was confirmed by our experiments.
The Gaussian kernel size, which represents how tight the boundary should fit over the training data, has to be manually specified. It is essential to properly select this parameter, as it highly influences the performance of the classifier. Values that are too small will lead to overfitting, while a larger value of the kernel size will give a smoother decision surface and more regular decision boundary.
Selecting the kernel size of OC-SVM remains an open problem. In CHABADA we used the default kernel size value, as proposed by Schölkopf [18], which is equal to the inverse of the feature space dimension. Using the default kernel size, however, does not take into account the arrangement of data, and it is therefore not optimal. According to Caputo et al. [19], the optimal value of the inverse kernel size γ lies between the 0.1 and 0.9 quantile of the statistics involving distance from training samples to their center point. We thus now set γ to the mean of quantiles of this range, and this significantly improves the results, as we will show in the evaluation.
Section 10.4 shows how γ influences the classification ability of CHABADA.
10.4 Evaluation
To evaluate the effectiveness of CHABADA, we investigated the following main research questions:
RQ1 Can CHABADA effectively identify anomalies (i.e., mismatches between description and behavior) in Android applications? For this purpose, we visualized how often anomalies occur in each cluster, and we manually analyzed the top anomalies (Section 10.4.1).
RQ2 Are sensitive and rare APIs the appropriate features to detect anomalies? We compare the results obtained with the sensitive and rare set of APIs, as described in Section 10.3.2, against different sets of features (Section 10.4.2).
RQ3 Can CHABADA be used to identify malicious Android applications, and how does the improved technique compare to [Can CHABADA be used to identify malicious Android applications, and how does the improved technique compare to [1]? For this purpose, we included in our test set of applications a set of known malware, and we ran OC-SVM as a classifier. We show how the improvements proposed in this paper lead to more accurate results (Section 10.4.3).
10.4.1 RQ1: Anomaly Detection
To identify anomalies (i.e., mismatches between description and behavior) in Android applications, we ran CHABADA on all 32 clusters, as described in Section 10.3.
The best way to evaluate whether the outliers that CHABADA identifies are indeed anomalous applications is via manual evaluation. We did this in our conference paper [1], and we found similar results using the new outlier detection mechanism described in Section 10.3. Outliers fall into the following categories: (1) spyware applications, which mainly collect sensitive information about the user by means of third party advertisement libraries; (2) very unusual applications, i.e., applications that, although benign, behave differently from other similar applications; and (3) benign applications that were assigned to the wrong topic cluster, and thus behave differently from other applications in the cluster. The third category shows that we should improve the first step of the CHABADA approach (Section 10.2), but the other two categories show that the outliers reported by CHABADA indeed have suspicious behavior and should therefore be further analyzed. We give a few example applications that appeared as top outliers in the corresponding clusters. We list the cluster number, as reported in Table 10.3, the package identified of the application, the anomaly score, a brief description (which is a one line summary of the original one), the list of the top anomalous features, and a brief comment:
| 7th cluster (language): com.edicon.video.free Score: 29112.7 | |
| All-In-One multi language video player. | |
| android.media.AudioManager.stopBluetoothSco() | 3025.00 |
| android.media.AudioManager.startBluetoothSco() | 3025.00 |
| android.media.AudioManager.setBluetoothScoOn(boolean) | 3025.00 |
| android.media.AudioManager.isWiredHeadsetOn() | 3025.00 |
| android.media.AudioManager.isBluetoothA2dpOn() | 3025.00 |
| android.bluetooth.BluetoothAdapter.getState() | 3025.00 |
| android.bluetooth.BluetoothAdapter.enable() | 3025.00 |
| The app has been associated with the “language” cluster because the description emphasizes the multi-language support. The main reason why this app was tagged as an outlier is because of the heavy bluetooth support, which is highly uncommon both for video and for language applications. The bluetooth connection is likely required to support external headsets. | |
| 10th cluster (sports game): com.mobage.ww.a987.PocketPlanes.Android Score: 21765.2 | |
| Flight simulator. | |
| android.provider.Contacts.People.createPersonInMyContactsGroup(ContentResolver, ContentValues) | 6595.00 |
| android.provider.ContactsContract.RawContacts.getContactLookupUri | 6595.00 |
| (android.content.ContentResolver,android.net.Uri) | |
| android.provider.ContactsContract.Contacts.getLookupUri | 6595.00 |
| (android.content.ContentResolver, android.net.Uri) | |
| android.app.NotificationManager.notify(java.lang.String, int, android.app.Notification) | 661.00 |
| android.app.ActivityManager.getRunningTasks(int) | 249.17 |
| android.hardware.Camera.open() | 191.33 |
| android.location.LocationManager.getProvider(java.lang.String) | 149.50 |
| This application shows suspicious behavior. It can access the list of existing contacts, and it can add a new one. Moreover, it can look at what tasks are currently running, and it can access the photo camera. | |
| 22nd cluster (advertisements): com.em.lwp.strippergirl Score: 3799.35 | |
| Erotic wallpaper. | |
| android.provider.Browser.getAllBookmarks(android.content.ContentResolver) | 1900.00 |
| android.location.LocationManager.getLastKnownLocation(java.lang.String) | 952.51 |
| android.location.LocationManager.isProviderEnabled(java.lang.String) | 275.79 |
| android.location.LocationManager.requestLocationUpdates(java.lang.String) | 241.97 |
| android.location.LocationManager.getBestProvider(android.location.Criteria, boolean) | 241.97 |
| android.net.wifi.WifiManager.isWifiEnabled() | 65.23 |
| android.net.wifi.WifiManager.getConnectionInfo() | 65.23 |
| This application is clearly spyware, since it can access sensitive information of the user, such as the browser bookmarks and the location. This app has been removed from the play store. | |

In addition to a qualitative analysis of the results, we tried to estimate the ability of CHABADA to detect anomalies by plotting the anomaly scores of the outliers of each cluster. Intuitively, a good result would be to have few outliers with high anomaly scores within each cluster. A worse result, instead, would be to have lots of outliers whose anomaly score is not too high. In the second case, in fact, it would mean that there is no clear border between the outliers and the normal applications. Figure 10.3 shows such a plot. We report the anomaly scores (on the y axis) of all the apps grouped per cluster (on the x axis) scaled such that all clusters have the same width, in order to ease the comparison. The cluster ids correspond to the ones listed in Table 10.3).

As expected, the results vary depending on the cluster. There are clusters in which the outliers are clear anomalies, e.g., Cluster 5 or 29, and others for which there are lots of outliers with high anomaly scores, e.g., Cluster 6 and 20. When clusters have too many outliers, they lack a proper model of “normal” behavior, and as a consequence our technique might be less effective in such clusters.
10.4.2 RQ2: Feature Selection
Section 10.3.2 describes how we select the list of features to detect anomalous applications within a cluster. In [1] we considered the sensitive API usage as binary features (i.e., 1 if the app used the API at least once; 0 otherwise), while we now use IDF to weigh APIs. To evaluate whether the feature selection is reasonable, we ran the anomaly detection process on each cluster with three different sets of features:
1. We considered binary values for sensitive API usage. These are the features used in our conference paper [1]. We refer to this setting as api-binary.
2. We weighed sensitive API according to IDF. This is, in our opinion, the optimal set. We refer to this setting as api-idf.
3. We used permissions instead of APIs, and we weighed permissions with IDF. With this, we wanted to evaluate whether using permissions could be considered a valid alternative to using APIs. We refer to this setting as permission-idf.
Comparing different settings is non-trivial, as it would require an extensive manual inspection. We instead visually compare the distance-based plots of several clusters. Figure 10.4 shows the plots of Cluster 29, which is one of the clusters for which we have better results. From left to right, the plots show the three different settings described above: api-binary, api-idf, and permission-idf.

We used multi-dimensional scaling, which is a statistical technique used to visualize dissimilarity of multi-dimensional data. This allowed us to plot data in two dimensions, and at the same time preserve the original distances in the multi-dimensional space as accurately as possible [20].
As we can see, by using permissions or APIs with IDF it is possible to differentiate the anomalies better, since the distance between the outliers and the rest of the cluster is emphasized. However, between the two options it is better to use APIs instead of permissions. In the next section we provide more evidence that using IDF can lead to better results.
10.4.3 RQ3: Malware Detection
Let us now turn to RQ3: Can CHABADA be used to identify malicious Android applications? And do the improvements proposed in this paper lead to better results than the ones presented in [Can CHABADA be used to identify malicious Android applications? And do the improvements proposed in this paper lead to better results than the ones presented in [1]? For this purpose, we used the dataset of Zhou et al. [21] that contains more than 1200 known malicious apps for Android. This is the same dataset we used in the original CHABADA paper [1]. In their raw form, these apps lack metadata such as title or description. Since many of these apps are repackaged versions of original apps, we were able to collect the appropriate description from the Google Play Store. We used the title of the application and the package identifier to search for the right match in the store. For 72 cases we could find exactly the same package identifier, and for 116 applications we found applications whose package identifiers were very similar. We manually checked that the match was correct. As with our original set of “benign” apps (Section 10.2.1), we only kept those applications with an English description in the set, reducing it to 172 apps.
As a malware detector, we used the OC-SVM classifier, as described in Section 10.3.4. Within each cluster, we trained the model using only the applications that were not tagged as outliers by the distance-based algorithm. Following K-fold validation, we partitioned the entire set of non-outlier benign applications in 10 subsets, and we used 9 subsets for training the model and 1 for testing. We then included the malicious applications in the test set, and we ran this 10 times, each time considering a different subset for testing. What we thus simulated is a situation in which the malware attack is entirely novel, and CHABADA must correctly identify the malware as such without knowing previous malware patterns. The number of malicious applications are not equally distributed across clusters, as malicious applications are assigned to clusters depending on their descriptions. In our evaluation setting, with our dataset, the number of malicious applications per cluster spans from 0 to 39.
To evaluate the performance of a classifier we use the standard approach of the Receiver Operating Characteristic (ROC) [22]. A ROC curve depicts the relative trade-offs between benefits (true positives) and costs (false positives). Figure 10.5 shows the results of our experiments in the form of this ROC curve, which plots the true positives rate against the false positives rate considering different thresholds.

Figure 10.5 shows the ROC curves of the worst and best clusters (Cluster 16 and 7, respectively), and the average performance on all clusters. To obtain these numbers, we computed the average over 10 different runs. We also report the Area Under the ROC curve (AUC) [22] metric, which can expose the predictive accuracy obtained by the classifier. When the AUC is equal to 1.0, the classification was perfect, while an area of 0.5 represents a worthless test. CHABADA as a classifier has a very good performance, as the AUC is 0.87 for the considered dataset, and thus we can claim that it is effective at detecting malware, reporting only limited false positives.
In our first paper, CHABADA used the set of sensitive Android APIs as binary features. Moreover, we did not filter anomalous applications when training the model for classification, and we used the default (and therefore not optimal) values for the kernel size and marginal error for OC-SVM. Section 10.3 described all the improvements we implemented in the new release of CHABADA. To evaluate the effectiveness of our technique as a malware detector, we evaluate how such improvements impact the final result.
Table 10.5 shows the detailed results of the evaluation considering different parameters. The first column (Filter) lists whether malware detection ran on filtered data. The + sign means that we ran the anomaly detection first, and we removed the outliers from the training set. The − sign means that we considered all the applications, as we did in [1]. The second column lists whether the γ parameter of OC-SVM was automatically selected to have optimal results, or whether the default value was selected, as in [1]. γ is related to the kernel size, as explained in Section 10.3.3. The third column lists the value assigned to the ν parameter, which can be specified in OC-SVM. The parameter ν is an upper bound on the fraction of margin errors in training data and a lower bound of the fraction of support vectors relative to the total number of training examples. Assigning a small value to ν will produce less false positives and likely more false negatives, while assigning greater values to ν would have the opposite effects. In [1] we used the default value. The last six columns report the results obtained with the corresponding settings using APIs as binary features (as in [1]) or weighing them using IDF (as explained in Section 10.3.2). We report the True Positive Rate (TPR) (i.e., the fraction of malicious Android apps that were recognized as such), the True Negative Rate (TNR) (i.e., the fraction of benign Android apps that were recognized as such), and the geometric accuracy. We report the geometric accuracy because we have highly unbalanced datasets (malicious vs. benign applications) and therefore common accuracy metrics would have distorting effects [23]. The geometric accuracy can be computed with the following formula:
Table 10.5
Evaluation of the Malware Detection Ability of CHABADA with Different Settings
| True Positive Rate (Malware Recognized as such) | True Negative Rate (Benignware Recognized as such) | Geometric Accuracy | ||||||
| Filter | γ | ν | IDF | Binary | IDF | Binary | IDF | Binary |
| – | Default | 0.15 | 0.610 | 0.564 | 0.845 | 0.841 | 0.718 | 0.689 |
| – | Optimal | 0.05 | 0.592 | 0.484 | 0.889 | 0.915 | 0.726 | 0.666 |
| – | Optimal | 0.1 | 0.609 | 0.539 | 0.870 | 0.869 | 0.728 | 0.684 |
| + | Default | 0.02 | 0.633 | 0.535 | 0.962 | 0.96 | 0.780 | 0.716 |
| + | Default | 0.1 | 0.726 | 0.637 | 0.890 | 0.885 | 0.804 | 0.750 |
| + | Optimal | 0.02 | 0.737 | 0.695 | 0.890 | 0.902 | 0.810 | 0.791 |
| + | Optimal | 0.05 | 0.738 | 0.752 | 0.884 | 0.887 | 0.808 | 0.791 |
| + | Optimal | 0.1 | 0.752 | 0.738 | 0.850 | 0.856 | 0.799 | 0.795 |
| + | Optimal | 0.15 | 0.810 | 0.771 | 0.814 | 0.813 | 0.812 | 0.792 |

Just as we did for the plot in Figure 10.5, we report the average values of 10 runs. The first highlighted row reports the results and the setting used in the original CHABADA paper. This, in essence, represents the baseline for our malware detector. This row also reports how only applying IDF to the used features would have changed the results. As highlighted in bold, without any of the improvements we described in this paper we could detect 56.4% of malware and 84.1% of benignware.
The other two highlighted rows in Table 10.5 show the results of the using the improvements described in this paper. In essence, we propose two possible settings, which both achieve an accuracy of over 79% (instead of 69% as in [1]). Using a small ν value would report a limited number of false positives (11%), and at the same time would detect a high number of malicious apps (73.7%). Using a bigger ν value, instead, would increase the number of detected malicious apps up to 81%, but at the cost of reporting more false positives (19%).
The results in Table 10.5 clearly highlight the following facts:
• Training the OC-SVM model without the identified outliers clearly improves the classifier results. This is obvious, as removing outliers helps create a model that better represents the core features of the cluster.
• Tuning the γ value, which relates to the kernel size of the OC-SVM model, can also lead to significantly better results.
• Assigning weights to APIs with IDF produces consistently better results than using APIs as binary features.
Thus, the three main improvements we propose in this paper (filtering outliers, optimal selection of the OC-SVM kernel size, and using IDF to assign weights to APIs) can produce results that are significantly better than the ones we presented in [1].
Choosing parameter ν is a matter of taste, as it depends on whether it is more important to have as little false positives as possible (and consequently choose a smaller value for ν) or to have as little false negatives as possible (and consequently choose a higher value for ν). In this context it is probably better to detect as many malicious applications as possible, and consequently a higher value of ν should be chosen (last highlighted row in Table 10.5). However, if it is desirable to lower the number of false positives, a lower value of ν can be selected and still have comparable effectiveness (second highlighted row in Table 10.5). This trade-off can be tuned using the ROC curve of Figure 10.5.
10.4.4 Limitations and Threats to Validity
We inherit most of the limitations of the original CHABADA paper, and we include a new one that comes with the filtering phase. The most important threats and limitations are listed below.
Grey area in classification. Filtering outliers when building the model to classify new applications leads to significant improvements in malware detection. The consequence of this gain, however, is that the outlier apps that are filtered out in first place cannot be classified. More precisely, these apps are reported in a “grey area,” i.e., they are suspicious since they are not part of the majority of the apps in the same cluster, but CHABADA does not report them as clearly malicious.
External validity. CHABADA relies on establishing a relationship between description topics and program features from existing, assumed mostly benign, applications. We cannot claim that these relationships can be applied in other app ecosystems, or be transferable to these. We have documented our steps to allow easy replication of our approach.
Free apps only. Our sample of 22,521 apps is based on free applications only; i.e., applications that need to generate income through ads, purchases, or donations. Not considering paid applications makes our dataset biased. However, the bias would shift “normality” more toward apps supported by ads and other income methods, which are closer to the undesired behavior of malware. Our results thus are conservative and would be improved through a greater fraction of paid applications, which can be expected to be benign.
App and malware bias. Our sample also only reflects the top 150 downloads from each category in the Google Play Store. This sample is biased toward frequently used applications and toward lesser used categories; likewise, our selection of malware (Section 10.4) may or may not be representative of current threats. Not knowing which actual apps are being used, and how, by Android users, these samples may be biased. Again, we allow for easy reproduction of our approach.
Native code and obfuscation. We limit our analyses to the Dalvik bytecode. We do not analyze native code. Hence, an application might rely on native code or use obfuscation to perform covert behavior, but such features may again characterize outliers. Further, neither of these would change the set of APIs that must be called.
Static analysis. As we rely on static API usage, we suffer from limitations that are typical for static analysis. In particular, we may miss behavior induced through reflection, i.e., code generated at runtime. Although there exist techniques to statically analyze Java code using reflection, such techniques are not directly applicable with Android apps [24]; in the long run, dynamic analysis paired with test generation may be a better option.
Static API declarations. Since we extract API calls statically, we may consider API calls that are never executed by the app. Checking statically whether an API is reached is an instance of the (undecidable) halting problem. As a workaround, we decided to consider an API only if the corresponding permission is also declared in the manifest.
Sensitive APIs. Our detection of sensitive APIs (Section 10.3.2) relies on the mapping by Felt et al. [7], which now, two years later, may be partially outdated. Incorrect or missing entries in the mapping would make CHABADA miss or misclassify relevant behavior of the app.
10.5 Related Work
While this work may be the first to generally check app descriptions against app behavior, it builds on a history of previous work combining natural language processing and software development.
10.5.1 Mining App Descriptions
Most related to our work is the AsDroid prototype, which can detect malicious behavior by identifying mismatches between the program behavior and the user interface [25]. CHABADA and AsDroid share the same final intent, but AsDroid checks the text in GUI components, while we use the program description. Since AsDroid focuses on few permissions and works only if the GUI elements contain textual keywords. CHABADA, on the other hand, uses the application description, which is always available, and works with any permission or API call.
Also very related to our work is the WHYPER framework of Pandita et al. [26]. Just like our approach, WHYPER attempts to automate the risk assessment of Android apps and applies natural language processing to app descriptions. The aim of WHYPER is to tell whether the need for sensitive permissions (such as access to contacts or calendar) is given in the application description. In contrast to CHABADA, which fully automatically learns which topics are associated with which APIs (and by extension, which permissions), WHYPER requires manual annotation of sentences describing the need for permissions. Further, CHABADA goes beyond permissions in two ways: first, it focuses on APIs, which provide a more detailed view, and it also aims for general mismatches between expectations and implementations.
The very idea of app store mining was introduced in 2012 when Harman et al. mined the Blackberry app store [27]. They focused on app meta-data to find correlation patterns in consumer rating and rank of app downloads, but did not download or analyze the apps themselves.
Our characterization of “normal” behavior comes from mining related applications; in general, we assume that what most applications in a well-maintained store do is also what most users would expect them to. In contrast, recent work by Lin et al. [28] suggests crowdsourcing to infer what users expect from specific privacy settings; just like we found, Lin et al. also highlight that privacy expectations vary between app categories. Such information from users can well complement what we infer from app descriptions.
10.5.2 Behavior/Description Mismatches
Our approach is also related to techniques that apply natural language processing to infer specifications from comments and documentation. Lin Tan et al. [29] extract implicit program rules from the program Corpora and use these rules to automatically detect inconsistencies between comments and source code, indicating either bugs or bad comments. Rules apply to ordering and nesting of calls and resource access (“fa must not be called from fb”).
Høst and Østvold [30] learn from Corpora which verbs and phrases would normally be associated with specific method calls and use these to identify misnamed methods.
Pandita et al. [31] identify sentences that describe code contracts from more than 2500 sentences of API documents; these contracts can be checked either through tests or static analysis.
All these approaches compare program code against formal program documentation, whose semi-formal nature makes it easier to extract requirements. In contrast, CHABADA works on end-user documentation, which is decoupled from the program structure.
10.5.3 Detecting Malicious Apps
There is a large body of industrial products and research prototypes that focus on identifying known malicious behavior. Most influential on our work was the paper by Zhou and Jiang [21], who use the permissions requested by applications as a filter to identify potentially malicious applications; the actual detection uses static analysis to compare sequences of API calls against those of known malware. In contrast to all these approaches, CHABADA identifies outliers even without knowing what makes malicious behavior.
The TAINTDROID system [32] tracks dynamic information flow within Android apps and thus can detect usages of sensitive information. Using such dynamic flow information would yield far more precise behavior insights than static API usage; similarly, profilers such as ProfileDroid [33] would provide better information. However, both TAINTDROID and ProfileDroid require a representative set of executions. Integrating such techniques in CHABADA, combined with automated test generation [34–37], would allow learning normal and abnormal patterns of information flow, which is part of our future work (Section 10.6).
10.6 Conclusion and Future Work
By clustering apps according to description topics and identifying outliers by API usage within each cluster, our CHABADA approach effectively identifies applications whose behavior would be unexpected given their description. In [1] we identified several examples of false and misleading advertising; and as a side effect, obtained a novel effective detector for yet unknown malware. This chapter presented several improvements on the original technique and thus introduces a more powerful malware detector.
In the future we plan to provide better techniques to cluster applications according to their descriptions. This should improve the ability of CHABADA to identify relevant abnormal behaviors. Furthermore, we plan to integrate dynamic information in the approach, thus overcoming the known limitations of static analysis.
The dataset we used for our evaluation, as well as a list of more detailed results, are available on the CHABADA website: http://www.st.cs.uni-saarland.de/appmining/chabada/.