
Using Data to Make Decisions in Software Engineering
Providing a Method to our Madness
Brendan Murphy*; Jacek Czerwonka†; Laurie Williams‡ * Microsoft Research Cambridge, Cambridge, UK
† Microsoft Corporation, Redmond, WA, USA
‡ Department of Computer Science, North Carolina State University, Raleigh, NC, USA
Abstract
The challenges facing software engineering teams are complex and are evolving over time. Many teams aim to produce software more frequently without sacrificing quality. These teams may be considering changing their development processes to meet these new challenges. Teams creating products in such a changing and challenging environment can benefit from data to make decisions based on evidence rather than based on intuition. In many cases, software engineers have a tremendous amount of data, and sometimes, they are overloaded with it. However, the challenge is to determine what data is relevant, how it should be analyzed, and how the analysis should be interpreted to guide decision-making.
Due to the great diversity of products made by means of software engineering, no single type of dataset, which can be interpreted through metrics, is applicable to all software engineering efforts. The guidance accentuates the need to establish clear goals, identifies the important components of a decision support program, identifies common pitfalls when choosing metrics, and discusses interpretation challenges.
13.1 Introduction
Each day, software development teams make decisions about their development process and the release-readiness of their product. The teams may be facing new challenges, such as the need to release more frequently, or the need to improve product quality. These teams may choose to use a different software process or different software practices to meet these challenges. Have other similar teams developing similar products achieved increased speed and quality by using these practices? Do results to-date suggest objectives will be met? Additionally, teams must decide if the software product is of high enough quality to release. Does the rate of test failures indicate the desired level of reliability has been achieved? And, are the teams actually following the process or actually incorporating the practices that were decided upon?
With the right data, important software engineering decisions can be made through evidence rather than through intuition or by following the latest process or technology trend. This era of “big data” provides a deluge of information. However, data only provides valuable information with carefully planned processing and analysis. Without a plan, the right data may not be collected, the wrong data may be analyzed, the research methods may not provide defensible or insightful results, or undesired comparisons, or inappropriate interpretations may be made.
The goal of this chapter is to aid software engineers and software engineering researchers by providing guidance for establishing a metrics-based decision support program in software engineering. This guidance has three components:
1. accentuating the need for establishing clear goals for the metrics-based program;
2. articulating important components of the metrics-based decision support program, including metrics to record project and product’s context, constraints and development;
3. sharing pitfalls to avoid when collecting and interpreting metrics.
The five major components of an iterative and cyclical metrics-based decision support program are summarized in Figure 13.1. The cyclical process begins with the establishment of goals for the product and development for which the measurement program is being developed. Example software development goals include increased time to product deployment, improved quality, and increased productivity. Next, the team determines which metrics need to be collected so that analysis can reveal whether the goals have been met or are predicted to be on target. The metrics are then collected. Procedures are documented so that the metrics collection can be repeated on the same product at a different time, or on other projects. The metrics data is then analyzed and explored. Based on the result of the metric analysis the team should determine if the development is on target and if it is not they need to determine if changes are required to the process or if the product goals need adjustment.
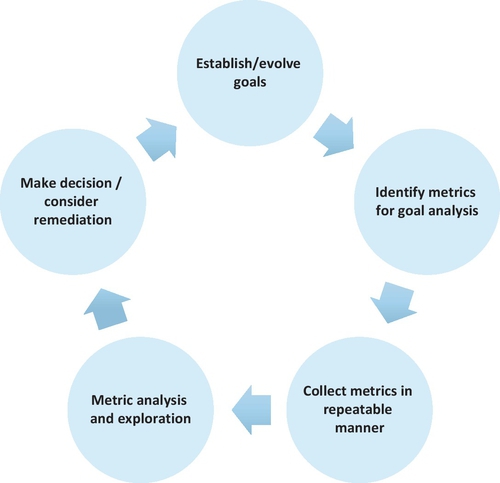
In software development, this data analysis and exploration is often called software analytics [1]. Through software analytics, insightful and actionable information is folded into the decision-making process. Once decisions are made, the goals of the measurement program can be evolved. The cycle is then repeated. The ultimate goal of such a program is to positively impact the behavior of the team and the success of the project. To illustrate this process, this chapter will provide an example of a Microsoft product group, who re-architected their development process based on data derived from benchmarking previous releases of their product.
We base our guidance on experiences and lessons learned when developing metrics-based decision support programs at Microsoft and when doing research with other companies. The first author previously worked at Digital Corporation monitoring customer systems to characterize hardware and software reliability [2], and initially continued this work in Microsoft [3, 4]. He then focused his research in understanding the relationship between the way software is developed and its post-release behavior. Both the first and second authors form part of the Empirical Software Engineering [ESE] team in Microsoft Research and have published a substantial body of work in this area. The second author manages CodeMine, a process that is used to collect and analyze the engineering processes used to develop the majority of Microsoft products [5]. Finally, the third author has conducted research on the use of agile process and agile practices at Microsoft, IBM, Telelec, SAS, Sabre Airlines [6–10], and other companies.
This chapter describes the process, as depicted in Figure 13.1, through which practitioners can use data to drive improvements in their software engineering processes. The key area that practitioners should focus on is the establishment of clear goals. Often, teams, at best, have aspirations of what they would like to achieve through their development process. Establishing metrics that can be repeatedly collected, and the careful analysis of the metrics can help teams understand if they have achieved their goals.
The rest of this chapter proceeds as follows: Section 13.2 provides information on a short history in the area of software metrics in software engineering. Section 13.3 discusses the need to provide clear goals for the project. Section 13.4 provides information on the components of a metrics-based program. Section 13.5 identifies the pitfalls to avoid in choosing metrics and information about interpretation challenges, respectively. Section 13.6 provides an example of how the Windows Server product team is re-architecting their development environment based on a metric-based decision support program. Section 13.7 shows how to use the processes described in this chapter to allow product teams to use data to drive their engineering process.
13.2 Short History of Software Engineering Metrics
Software engineering differs from other engineering disciplines by its lack of a standardized set of metrics to manage projects. Other engineering disciplines have standardized processes and practices that have evolved over time. For instance, the railway industry standardized their total process for building and managing trains over the last 150 years [11].
Research into the relationship between metrics and software reliability can be traced back to the 1970s. John Musa took an empirical approach in his data collection works [12], whereas other researchers built reliability models based on the software structure [13]. The computer industry initially focused on hardware failures using reliability metrics, such as Mean Time Between Failures (MTBF) and Mean Time To Repair (MTTR) [14, 15]. In the 1980s, software was identified as increasingly impacting overall product reliability. Additionally, [16] identified that software reliability is also influenced by human factors.
In the late 1980s, a number of major computer manufacturers started providing real-time monitoring of their computer systems at the customer sites. This monitoring allowed the total behavior of the computers to be analyzed. Digital Equipment Corp identified that software was becoming the dominant factor impacting the overall system reliability, and its reliability could no longer be measured only in terms of system crash rates [2, 17]. Similarly, IBM analysts attempted to characterize software quality and productivity [18]. Barry Boehm built a model to analyze the economics of software development [19], while Fred Brooks highlighted the difficulty of bringing out-of-control software development projects back under control, based upon his experiences with the IBM System/360 [20]. Similarly Lehman and Belady [21] analyzed the impact of program evolution, from which Manny Lehman derived the “Lehman’s laws of software evolution” [22], which assist in our understanding of how products evolve over time.
In the 1990s, in some areas, the perceived lack of standards was assumed to result in catastrophic failures as the new millennium approached. One solution was to apply formal development methods to control the software development process through the use of guidelines and standards, such as ISO 9000 Standard [23] or those promoted by the Software Engineering Institute [24]. During this same timeframe, Norman Fenton produced a comprehensive book on software metrics [25], and other authors focused on the analysis of software development methods [26].
At the same time, the 1990’s saw the emergence of the Open Source community producing reliable software, such as Linux and Apache, without the use of these formal methods. The turn of the millennium (Y2K) came and went without catastrophic events. A backlash against the overemphasis of processes in software development resulted in a group of software engineering consultants publishing the Manifesto for Agile Software Development [27].
In this millennium, researchers in software engineering have performed numerous studies linking software metrics to post-release failures. For example, Li [28] examined factors that led to system and application unreliability. Mockus [29] discovered the effects of organizational volatility on software reliability, and Zimmermann [30] performed similar studies to identify the causes of security defects in released products. Cataldo [31] found that coordination breakdowns negatively impacted development productivity and software failures. Finally, Zimmermann [32] predicted defects using network analysis on dependency graphs. This sampling of studies found relationships between attributes of the development process and post-release failures for a specific set of products. However, researchers often have difficulty in replicating results on different product sets, suggesting the product and project context influence the metrics. Some practitioners have analyzed which metrics are applicable to specific coding practices, such as Lanza and Marinescu [33] providing assistance in developing object-oriented code.
This chapter incorporates a lot of the learning gained from all of this historical work to improve the effectiveness of managing software development through metrics; and provides a practical approach to this subject.
13.3 Establishing Clear Goals
The development of any engineering project requires a clear set of goals to provide a focus for the engineers and a mechanism to ensure the development is on target. At times, the goals may change during the development period. Other engineering disciplines may have an established set of metrics that that can be used to determine if the overall product goals have been met. For instance, engineers building a bridge can decide on materials and the design of the bridge, but their usage must exist within defined bounds that are verified through a set of metrics and mathematical equations.
With a plethora of available data, the Goal-Question-Metric (GQM) [34] methodology can be used to guide the development of a metrics-based decision support program, as shown in Figure 13.1. GQM is focused, whereby only the data needed to determine if a goal has been met is processed and analyzed. The GQM approach forms the basis for any organization to measure its attainment of goals in a purposeful way. The first step is to build a goal statement. Then, a set of questions is developed that need to be answered to gain an understanding of whether the goal has been met. Finally, the metrics that need to be collected to answer the questions are enumerated. A set of data is associated with every question, such that the question can be answered in a quantitative way. In this way, the organization traces the goals to the needed data to define those goals operationally, and finally provides a framework for interpreting the data with respect to the stated goals. Other available data not required to answer the questions is ignored, even though it may intuitively look interesting.
The choice of any metric depends on the relevance of the metric to the attainment of product goals and also its accuracy. The accuracy of metrics, in turn, depends on how the data is collected, which often relies upon the tools and practices of the engineering teams. An effective way to establish the metrics and target values for those metrics is to benchmark an equivalent product, as discussed in Section 13.3.1. The benchmark provides a framework for collecting and interpreting metrics for the new product in the relevant context and provides a point of comparison [35]. Re-using metrics from previous projects will provide the analyst some confidence that the metrics accurately capture their development process. Once the metrics are defined, a project-specific criteria for metrics can be established, which more closely relate to the specific product goals.
This section describes the methods of obtaining benchmarking data and how that benchmarking data can then be used in interpreting the metrics. The section also describes the methods for quantifying the goals of the project.
13.3.1 Benchmarking
Many software products are either a new version of an existing system or derivatives of other products. The objective of the benchmarking process is to:
1. collect the metrics generated during the product development;
2. process the metrics to identify missing data and outliers;
3. ensure the metrics can be correctly interpreted.
Outside of major refactoring activities, which are typically evident, a new version of an existing product will rarely make a significant change to the core attributes of the product; especially as they relate to the product’s architecture. Ideally, the products that are to be used as a benchmark should have developed using equivalent tools to the target product. If possible, metrics should be collected from more than one single product release. Product teams should not overly focus on the metrics from a problematic release. Rather, the objective should be to identify the normal value for a metric, because bad releases may only provide outlier values for a metric. Additionally, a team can consider the baseline being a product with a good reputation for quality and customer acceptance.
More generally, the same collection and analysis methods that were applied to previous versions of the product should be used for data collection and analysis of the release under study. Therefore, the methods for data collection and analysis should be clearly defined to enable replication. Additionally, the team interpreting the metrics should have knowledge of the data collection tools and their idiosyncrasies. The metrics collected from the prior release should be analyzed and an initial interpretation of the metrics should be produced. As part of this interpretation, the team should also focus on comparing metrics across the development cycle analyzing differences in trends to identify inaccuracies of the metrics or possible gaming of the system.
The creation of benchmarks for products that are significantly different from prior versions is more complex, and is dependent on the percentage of the new product that has been derived from the prior version. The smaller the percentage of derivation, the less applicable it is to use the prior development as a benchmark for the new product. But even in these circumstances, the benchmarking process can provide bounds for the metrics, whereby when metrics move outside of these bounds the product group should initiate investigations to identify if any potential issues exist.
The analysis of the metrics should be shared with the team that developed the product to clarify the discrepancies between the interpreted metrics and the product team’s perception. During these discussions, the software engineers will often identify why the metrics may not be accurate. The team may reveal sources of noise in the data, gaming of the system, sources of inaccuracy, or outliers.
To illustrate the point of the relevance of choosing appropriate products to provide benchmarking data, we can consider how the Microsoft Bing team would choose a relevant benchmark. Bing is a service product that is continually deploying new features onto a single deployment target. Consequently, Bing does not support older versions, and it exposes its functionality through web servers. Alternatively, each release of Windows can be separated by years and it is deployed onto millions of computers whose failure profile is very different from Bing. So while the different product groups will share experiences, they would never attempt to benchmark their developments against each other.
Within a single product group, not all product releases may be used as benchmarks for other releases. For example, while the development tools and process are common for a Windows product and its Service Packs, neither would be a valid benchmark for the other. The focus of a main Windows release is to provide a new user experience, whereas for Service Packs the focus is on maintaining the current experience while correcting security or reliability issues. Therefore Windows 8.1 would use Windows 8 as a benchmark, whereas Windows 8.1 Service Pack 1 would use Windows 8 Service Pack 1 as a benchmark.
The phase of the product’s development lifecycle should also be considered. For a product such as Windows, the development cycle is split into milestones that consist of periods of feature development and periods of stabilization. The expected product behavior should change between these milestones. In these circumstances, the development performance during Windows 8.1 feature development milestone would be compared against the equivalent feature development milestone in Windows 8.
13.3.2 Product Goals
Once a clear relationship is established between the metrics and the development attributes of the previous release, the metric goals can be defined for the future products. The quantified metric targets are estimated based on the data calculated from benchmarks and the overall goals of the next release. Specifically, if the objective of the next release is to improve performance, then the goal could be a specified performance percentage increase over the previous release.
The goals should be realistic, which often takes considerable experience, judgment and restraint. For a complex product, improving all product attributes simultaneously is difficult. So, if the goal is to improve performance, then the goal for reliability may be to maintain the current level. The goals should also reflect any changes in development methodology.
A common mistake is to define goals at too detailed a level. For instance, if the goal is to improve productivity in terms of rate of code changes or feature added, defining that goal in terms of the increased productivity expected by individual engineers is discouraged. By breaking the goals down to the individual level, ownership of the goal from the teams is reduced, which removes the motivation of the team to innovate (e.g., assigning engineers to improve tools may be far more effective than asking them to code faster) and to work together as a team. The preferred way is to define and monitor the goal at the product level. If the product is not meeting the goals, then the causes of the issue should be investigated. The solution may be improved tools, sharing of best practices between teams or identifying that the goal itself is unachievable and needs to be reset.
13.4 Review of Metrics
This section provides the details of the metrics that are available to assist teams in the characterization of their software development process. Since the collection and analysis of metrics is a cost overhead for product teams, the objectives of the metrics must be to provide the developers with useful information that is not otherwise available to them. A small development team of five people may not need to collect daily metrics to know the amount of effort and bug fixes that occurred over the last few weeks. Their own experience would provide that knowledge. However, they may like to see trends over a period of time to monitor improvements. Conversely, a large product, such as Windows, benefits from detailed daily and weekly metrics, because no individual would have the knowledge of the amount and type of effort occurring in the entirety of its development. As the objective of the process is to use metrics to determine the status of a development, then the number and type of metrics that are required should be determined by the size and complexity of the product. Smaller teams and simpler products require fewer metrics to understand the product status.
The following should be considered in developing a metric framework for a product’s development:
1. The product’s characteristics. Is the product stand-alone, an application that is deployed on multiple platforms, or a service product? What is the objective of the next release of the product? For example, is the release focused on introducing new features or is the release intended to address customer feedback from prior release? If the objective is to add new features to a product, then the product goals can be complex, especially in regard to quality. The introduction of new features can change the product’s user experience for the customers. Whereas, if the objective of a release is to improve reliability, reliability measures should be more precisely defined.
2. The development process. The chosen development process controls how the engineers behave, which has an obvious impact on interpretation of the metrics. One team may decide that features must be complete prior to integration into the master version of the product or component. For these teams, integrated features should be complete. Other teams may opt for continuous integration and will allow unfinished features to be submitted. For these teams, burst of changes until the product stabilizes is expected. Within Microsoft, and in most organizations, changes being submitted into the master version of the product should not break that product in fundamental ways, often referred to as “not breaking the build”. Often, teams opt for verification processes prior to checking into the trunk branch to prevent such build breakage. Quality metrics should reflect the verification processes available to the developers. If the developers are not able to perform a “system test” on a change, a higher failure rate for these changes would be predicted.
3. The deployment and support characteristics. Nowadays, product can be deployed via many different mediums. Some types of software are installed to be executed locally. Externally managed channels, such as app stores, may help with deploying such applications, or they can be deployed completely independently (such as via downloaded or shrink-wrapped packages). Other software can be shipped as a component of a larger product. In this case, the developer has much less control over the deployment and the usage scenario of the software. Deployment of the software can occur through a browser reaching a web service. In this case, software engineers have full control of their deployment and servicing of the product. Finally, some software might be deployed by multiple methods simultaneously.
All metrics collected and analyzed should be tied to a specified product goal, as discussed in Section 13.3. We grouped metrics into three classes, each with a different purpose. This grouping is an extension of the work of Williams et al. [20] when establishing the Extreme Programming Evaluation Framework. Product teams should aim at understanding all these aspects of the project and product characteristics to be able to make informed decisions regarding the way they develop software. These three classes are as follows:
1. Contextual metrics. Drawing conclusions from empirical studies of teams may be difficult because the results of any process largely depend upon the relevant context variables. One cannot assume a priori that a study’s results generalize beyond the specific environment in which it was conducted [36]. Therefore, recording an experiment’s context factors is essential for comparison purposes and for fully understanding the generality and utility of the conclusions and the similarities and differences between the case study and one’s own environment. Factors such as team size, project size, criticality, and staff experience can help explain differences in the results of applying the practices. Product teams should look back at the project history as it creates a framework for assessing future performance. Organizational structure and relevant product expertise permeate the project and heavily influence the product and these also need to be understood.
2. Constraint metrics. While the goals of the product under development may be to release a set of new features, each release must meet a series of constraints. The majority of software products have to work under predefined constraints. For instance, applications distributed through an app store have to satisfy requirements of the particular store. Constraints can be related to past releases of products. For example, a new release may be required to maintain the same level of performance or reliability. Products may be required to ensure backward compatibility or security or privacy constraints. For instance, the new version of the product is required to improve the performance of data retrieval by 10%.
3. Development metrics. Assessing the state of development, verification, and deployment readiness and tracking these over time is an important part of managing a project. Is the development progressing according to plan? Is the progression rate higher or lower than in the past? How much time is spent in verification as opposed to design and implementation? These types of metrics can be used to assess the achievement of a goal, such as the code should decrease in complexity by 20%.
This section discusses a set of metrics that individually can address some aspects of the above characteristics. Later parts of the document will discuss methods and challenges often occurring when interpreting these metrics. Table 13.1 provides an overview of the metrics discussed in this chapter, identifying the metric category, providing specific examples of the metrics, their goals.
Table 13.1
Selected Product Metrics
| Metric | Category | Example Metric | Goals | Challenges |
| Product objectives | Contextual | Product releases every month | Relate metrics to product goals | Each product may have unique characteristics |
| Product revision | Contextual | Service-based release | Assists in setting realistic development goals | Each release may have unique characteristics |
| Organizational structure | Contextual | % of experienced engineers | Ensure development teams have correct balance of experience | Sometimes this is not within the control of the product team |
| Development methodology | Contextual | Code velocity | Identify the most relevant product metrics | Product teams may use a variety of development processes |
| Quality | Constraint | MTBF | To improve the end-user experience | Some aspects of quality such as usage and visualization are difficult to measure |
| Performance | Constraint | Average response time on specific configurations | To understand the end-user performance | Performance is dependent upon a lot of environmental factors, such as network speed, outside product control |
| Compatibility | Constraint | Product is compatible with applications released since the previous version | Upgrading the software does not break compatibility | Difficult to emulate all the user’s environments |
| Security and privacy | Constraint | Development complies with industry standards | Improve product security | Security threat landscape is constantly evolving making it less amenable to quantification |
| Legacy code | Constraint | Code age | Minimize technical debt | Can impact compatibility with older software |
| Code churn | Development | Files changed per week | Verify development activity match plan | Tracking only the code that forms the released product |
| Code velocity | Development | Time for feature completion | Increasing productivity | Difficult to interpret |
| Complexity | Development | McCabe’s complexity | Minimize product complexity | Unclear what action to take based on McCabe’s metrics |
| Dependency | Development | Count of direct dependencies on a module | Minimize product complexity | Tools do not calculate state dependencies |
| Quality | Development | Number of open defects | Improve product quality | Metrics are often gamed and not reflective of actual product quality |

13.4.1 Contextual Metrics
The developments of software projects are varied in terms of scope, resources, and time commitments, and the resulting products have widely differing functionalities, intended audiences and lifecycles. An operating system that is deployed on servers will be, by necessity, differently scoped, produced and verified than a web service or a single-function application on a consumer-class device. The product and project context information explicitly describes some of the key attributes which later assist in identifying relevant products as benchmarks and in the interpretation of the metrics.
Among the most crucial context details are the project objectives, intended audience and the mode of deployment, project history and revision specifics, organizational structure and knowledge, and applied development methodology.
13.4.1.1 Product objective, audience, and delivery method
Understanding the project and the product context begins with business goals. These inform decisions around what value the product will provide, who the product is intended for, and how the functionality will be delivered and presented to the user. The differences between traditional software packages that need to be installed versus software exposing the functionality through a browser, are profound, and will require adjustments to the development methodology and the analyst’s understanding of the data.
The output of this information will result in the adjustments of other metrics. For example, if a product moves from a traditional software package to a service, then that often results in increases in the frequency of releases.
13.4.1.2 Project scope, history, and revision specifics
Project size and scope can be measured in multiple ways, starting from counting source code artifacts, executables or higher-level functionality through a measure, such as function points. Unless the product is brand new, the product history is useful for putting metrics into context. History, moreover, provides the means of allowing for more precise analysis. The scope and timing of a release, put in context by the objectives and timing of the past releases, determine how relevant measurements are to understanding the project today. On the other hand, if past releases were focused on delivering new functionality and the current release is focused on improving reliability, historical comparisons might be less useful, although the past release will define the baseline for the minimum improvement in quality required for the current release.
In addition, previous releases at least partially determine the scope of the current release. The scope might take a form of addressing users’ feedback from, or quality issues found in previous releases. Lastly, product history is invaluable in understanding persistent strong and weak points of the product; areas of concern across multiple releases in the product and in the development methods; and the levels and concentrations points for accumulated technical debt. Technical debt is a metaphor for incomplete or inadequate artifacts in the software development lifecycle [37].
Data from prior releases can be used to determine the percentage change in the metric in a new release. For instance, if the goal is to improve the quality of the product, then the reliability goals can be set at a specified percentage improvement over a prior release. The previous product release may have focused on providing new functionality, and the current release is focused on addressing technical debt (e.g., a Service Pack release), then you would expect the current release would be more reliable than the previous release, without any changes to the development process.
13.4.1.3 Organizational structure and expertise
The organizational structure and the expertise of the team play a pivotal role in the success or failure of any project and the long-term viability of the product. Further, the architecture of the product is typically related to the organizational structure that created it; often referred to as Conway’s law [38].
Understanding the organizational context starts from identifying the team’s size, structure, defined and implied roles and responsibilities and, if possible, lines of communication. Distributed teams will work differently than co-located teams and will have different patterns of decision-making and knowledge sharing. Conflicts within teams may indicate goal- and role-definition problems, which often will translate into architectural, design, or quality issues later in the product lifecycle [39].
Finally, mapping out the longevity and churn of team members on the project is an indicator of retained organizational knowledge and expertise. Useful metrics in this space are the average level of experience per team. New people joining can bring new ideas and experiences to the teams but teams also benefit from retaining product expertise and experience. Another useful metric to track is the turnover of all the teams. Excessive turnover may indicate morale problems in the team.
13.4.1.4 Development methodology
The development methodology chosen by the team, and applied to developing the product, has an impact on the goals of the project, especially when changes to the methodology occur during or between product releases. Methodologies most often change in response to a project failure, inability to quickly respond to new requirements, quality issues with past releases, or frustration with the existing development workflow by the engineering team. If a team starts a project using deep branching hierarchy, then they may be focused on metrics, such as code velocity across branches. If the team then moves to a more agile approach during system verification, then code integration velocity may no longer be of prime interest to the team.
13.4.2 Constraint Metrics
During product development, the focus for engineers is the implementation of new features or the fixing or improvement of existing functionality. Changes to the software are verified through a number of different processes, such as code reviews, unit tests, static analysis, component verification, system verification, deployments, usability studies, or acceptance tests. The objective of the verification process is to ensure the change meets its goals by:
1. satisfying its functional requirements,
2. satisfying any constraints placed on the features by the system and the environment.
While functional requirements are product- and feature-specific and largely self-explanatory, constraint metrics focus on the system constraints. Typical constraints found in today’s software relate to reliability, compatibility, security, standards and regulatory compliance, privacy, accessibility, UI guidelines, physical limitations, power consumption, and performance. Project goals should explicitly enumerate all the constraints the final product should meet, but often at least some of the constraints remain implicit. Users only perceive software meeting all its explicit and implicit constraints as high quality.
The constraints that a feature has to satisfy vary based on the product. A feature developed for a mobile application and for the kernel of an operating system would have to comply with completely different sets of constraints.
Lastly, all constraints can be expressed as absolute or relative. The former often have a form of a precise statement, creating a target for the engineers, for example, the start-up time of the software from a user initiating its launch to having the user interface ready to accept inputs should be less than 3 seconds. The latter is typically relative to the previous release or a competing product, such as to meet the value for the constraint in a prior release. For instance, a product’s Service Pack may be required to be compatible with all the same applications as the original product.
13.4.2.1 Quality
The quality of the released product is dependent upon the ability of the product to match the needs of the customer. As such, quality is a difficult characteristic to measure. Often, product groups try to translate quality into the reliability attributes that are readily noticeable by end-users, which is translated into reliability constraints. In addition, reliability can also be characterized as the lack of availability of the product. Reliability targets and reliability trend monitoring are typically easy to establish, although care should be given to ensuring the target is appropriate for the scenario for which the product was designed. The traditional primary metric for measuring reliability is the mean time to failure (MTTF), which is still appropriate for most of the software written today. The secondary metric of mean time to recovery (MTTR) is often useful as a complement to the MTTF metric.
Depending on the nature of the product, increased MTTF may be traded off for decreased MTTR. For systems processing non-critical data where a failure will not corrupt any data, speed of recovery (MTTR) is more important to perceived quality than encountering a failure (MTTF). A system processing critical data would prioritize MTTF and the need to guarantee correctness of the data more than the MTTR.
13.4.2.2 Performance and scaleability
Performance or scalability constraints relate to resource consumption, both on the part of the software (e.g., ability to hold sufficient number of objects in its data structure) or the user (e.g., time spent waiting for an operation to complete). In certain product areas, such as communications, performance goals may be specified both in normal state and in a degraded state. In other software areas, performance and scalability is dependent on multiple factors, including those that the software cannot directly control, such as environment on which it runs. Performance and scalability metrics are typically expressed as distributions over a representative population of environments, for example, the response rate from the website for a user with a broadband connection should be between 1 and 2 seconds. The consequence of such representation is that the question of whether a product meets the constraints is subject to interpretation. At the very least, the boundary between meeting and not meeting a performance and scalability constraint is often soft. Performance metrics are often based around the performance of the software on representative equipment with representative user load, although some software, such as communications, often specify allowable performance degradation based on poor environments.
13.4.2.3 Compatibility
Compatibility relates to how the product interacts with its environment. The most prevalent case of having the ability to use data (and sometimes programs, for example, scripts) from its own previous versions is often referred to as providing backwards compatibility. Compatibility constraints come in a wide range depending on how interoperable the product needs to be with its environment and how big an installed-base it needs to support. In principle, the problem is confined to finding a representative set of configurations needing to maintain compatibility. In practice, fully establishing whether this constraint is met depends on how difficult it is to validate various combinations of the product interoperating with other software or its own previous versions. When such a representative validation set is established, the answer to how compatible the product is in relation to its requirements is straightforward.
The compatibility metrics often fall into two categories. One category is the type of equipment that can run the software and the other is the versions of the application that can interface with the software. Examples of equipment metrics are the software runs on computers running Windows 7 or above and have at least 1GB of memory. Examples of application compatibility are that the software must be compatible with browsers running at or above a specific version.
13.4.2.4 Security and privacy
Security of systems is another aspect of the product requirement set that becomes a constraint. Various ways of probing the security boundary of the system have been established over the years. Starting from performing a comprehensive analysis of threats, through analysis of entry points and paths through the software statically or through testing (including security focused fuzzing of inputs), to targeted penetration testing.
The security and privacy requirements of a software system must also comply within a legal system and laws governing the customer’s location and, in case of companies, its line of business. The software has obligations for compliance with various policies, such as user data privacy, requirements around data storage and transmission, defined by the laws of the country (e.g., European Union (EU) data privacy laws).
Security metrics are often related to the process that product groups use to minimize the risk of security holes, rather than product goals. Examples of these metrics are whether the product groups follow the security development lifecycle (SDL). Privacy goals often relate to defining what types of data is classified as privacy related and how that data should be stored and accessed.
13.4.2.5 Legacy code
Legacy code is the amount of “old” code in a code base as compared with new code. Legacy metrics provide measurement in terms of age of the code or in terms of in which previous products did the code exist, depending on the definition of age. Engineers may use this to identify areas of accumulated technical debt, ripe for refactoring as old code is often not really well understood by current team members and a lack of expertise in such parts of the codebase may represent future risk.
Examples of legacy metrics are the percentage of the current code base that existed in prior releases of the product.
13.4.3 Development Metrics
Development metrics capture the status of the product across its development cycle over time. These metrics are used by the development team to identify bottlenecks and problems with the development process. Different product development models will place different emphasis on different areas of its development. Therefore, the development metrics are organized into the categories below for different characteristics of the development process.
13.4.3.1 Code churn
The code churn occurring on a single file is defined as the lines added, modified, or deleted between two revisions of a file. These metrics are most often obtained through the use of textual diff’ing tools, which provide a convenient way for engineers to track and understand changes occurring at a level of a source line. Calculating churn is a lot easier when files are managed by a version control system (VCS), as the majority of VCSs have built-in diff tools.
For any type of software, a released product is comprised primarily of files that form the deployable artifacts; in addition, there can exist secondary software to perform the act of deployment or other process management functions. A project team may additionally store files that perform related tasks, such as testing or build process. These files need to be classified into their own category, as the churn of these files should be analyzed separately from the churn of the files that form the final deployed product. Monitoring the churn of these non-product related files and their correlations with testing efforts and product churn can be informative. If a correlation does not exist, the new features may not have been tested at the right level.
Numerous research has studied the relationship between code churn and reliability and through combining code churn with other progressive metrics. Nagappan [40] showed that characteristics of code churn can have a negative impact on overall system reliability.
The churn rate over the product lifecycle should correspond with the product lifecycle phase. For example, during feature development, the churn should consist of large changes while during stabilization, changes should be primarily smaller changes and bug fixes. Tracking churn provides a method to identify if the development process matches the plan. It is also invaluable to correlate where churn is occurring against where churn is planned to occur. A lot of churn happening in unplanned areas may be an indicator of problematic code, that is, code that continually requires patching. In these scenarios, the code should be investigated to identify if it requires to be refactored.
Code churn metrics are based on the number of changes that are occurring within specific time periods or within specific releases. The types of changes that are monitored are lines changed or files changed. For products with long development cycles the amount of churn is often tracked over time periods, such as a week. For short release cycles, such as services where a release could be weekly or monthly, the churn metric is the change occurring continuously within a release.
13.4.3.2 Code velocity
Code velocity is a term encompassing measures of efficiency of the development process, characterizing the time from the development of a new feature to its ultimate deployment to the end-user. In all product developments within Microsoft there is an intermediary stage, where the completed feature is merged into the master version of the product or component, this is traditionally managed within a trunk branch in the version control system. The applicability of the code velocity metrics assumes that the development process can be categorized into three phases:
1. feature development, this phase often includes unit testing;
2. system verification and the merging the feature into the trunk branch;
3. deployment of the feature to the end-user.
Based on these development phases the code velocity metrics can be deconstructed into the following:
1. Implementation velocity: The time between a team starting to write a feature and the feature being merged into the trunk branch. This does not include the time needed for clarification of requirements, designing a feature and performing design verification, as accurately measuring these time periods is difficult. This metric includes the time for the implementation and verification of the feature.
2. Integration velocity: The time from feature completion to the feature being integrated into the trunk branch. This metric is more relevant for teams that develop software within a branch structure and measures the time for the feature to move through intermediary branches, before being integrated into the trunk branch.
3. Deployment velocity: The time between a feature being integrated into the trunk branch to deploying that feature into a running service or into the shipped product.
To provide an example for these metrics we consider a feature being developed in its own feature branch and the master version of the product being managed in the trunk branch of a source tree. A team starts working on implementation at time T1; the feature is verified and ready for merging into the trunk branch at time T2. After going through an integration and verification process, the feature is merged into the trunk branch at time T3, and deployed to the end-user at time T4. The metrics characterizing the code movement are:

The appropriateness of the code velocity metrics is dependent upon the objective of the development process, for example, for a product such as Windows, the whole product is deployed yearly so measuring the deployment velocity for an individual feature is irrelevant, whereas for service products, features can be continuously deployed, and so the time for feature deployment is important.
If the code velocity of a development is slower than a team’s goal (derived from past developments) a possible bottleneck may exist in the process or quality issues may be present necessitating additional verification and bug fixes that will slow the code flow into its trunk and subsequent deployment.
13.4.3.3 Complexity
The original complexity metric was defined by McCabe’s and was defined as the number of branches in the flow of code at the level of a procedure. While this is accepted as a good metric for calculating the testability of a product, one complaint against this particular metric is that it does not handle loops very well.
Research results conflict relating to the importance of the complexity metrics, some indicating that the metric is correlated with failures [41] and others that do not find any such relationship. Additionally, measuring the total complexity of a product does not differentiate between legacy code and new code, and therefore is not an actionable metric.
A more relevant measure is the amount of change in complexity that is occurring over the project development. This metric is more actionable as it can be used to identify whether the increase in complexity matches planned changes to the product and helps detect mismatches between the intended design and implementation. This metric can also identify areas that are increasing in complexity or decreasing in their testability.
13.4.3.4 Dependencies
Dependency metrics are measures of architectural complexity. They typically count the number of artifacts that an artifact in question is dependent upon to perform its functionality. Artifacts can be binaries, components, modules, functions. In addition, dependencies can be measured in terms of direct dependencies (i.e., a binary calls a method or function of another binary) or indirect dependencies (a binary makes a call to another through an intermediary).
Engineers often analyze the dependency of the program at the start of the product development to identify areas of dependency complexity, which may require refactoring. Once the product development begins, it is important to track and characterize the changes in dependencies that occur over time. These changes should reflect the product plans. Areas of code that are increasing in complexity where no added functionality is planned may indicate issues.
Examples of dependency metrics are measures of the number of dependencies a component or binary is taking or has on them. Other useful measurements are identifying the total depth of dependencies in the program and the existence of cyclic dependencies.
13.4.3.5 Quality
Various in-process metrics, such as the number of defects found, tests executed and passed, achieved code coverage, or uptime under stress, are used as proxies for quality during development. Ultimately though, the level of quality of any software system is fully manifest in real world usage. Therefore, quality is most often equivalent to counting defects filed and/or fixed after release. Defects filed and fixed are the most common metrics collected by product groups but are among the most difficult metrics to correctly interpret. Issues with noise in defect data notwithstanding, some measures of overall quality collected from defect data are possible and often applied. These include:
1. the number of defects found during a period of time,
2. the number of defects resolved during a period of time,
3. the number of defects resolved through making a change to the product,
4. the number of defects that remain unsolved,
5. product availability under representative user load,
6. percentage of test executions succeeding.
Such metrics are often broken down by severity to give more weight to more urgent and important issues. These defect trends are quite often used as a proxy for determining the product’s readiness to release.
A common practice is for engineers to use the product as it is being developed. This practice is often called “Eating your own dog food” or “dogfooding,” for short. In these scenarios, it is possible to measure changes in end-user quality over the product lifecycle, such as system failure rates (e.g., MTTF), system availability (e.g., MTTR).
13.5 Challenges with Data Analysis on Software Projects
The greatest challenge for product groups is not collecting data for metrics but in their interpretation. For product groups to interpret the metrics to determine the current status of the product development, it is important to take into account how the data was collected to create the metric but also to understand and counteract common interpretation issues.
This section addresses both of these issues related to managing a project through metrics.
13.5.1 Data Collection
As described in Section 13.3, characterizing the software development process through metrics begins with goals, defining the specific questions that will be asked, and defining metrics appropriate for answering the questions. Once the objectives and definitions are established, typically the next step is the collection of data.
13.5.1.1 Collection methods
Data can be collected manually or automatically. Manual data collection takes a form of surveys, interviews, or manual inspections of artifacts. The process can be time-consuming but it is often the easiest to perform especially in the absence of any structured data collection available on the project. Automated data collection, on the other hand, typically consults some existing data source, such as a source version control system or a defect repository, and extracts the necessary information from there.
There is a trade-off between the two methods in terms of cost of the collection and quality of the data. Frequently, a combination of both methods is necessary for the collection to reach the desired level of precision and data volume. For example, the initial data extraction is often done automatically but then the result needs to be manually verified and noise removed. The noise at the level of the structure of data is quite easy to identify. This is the case, for example, with missing values or values not conforming to the prescribed schema. Much harder cases involve the data semantics where the knowledge of the product or the team’s process is necessary for disambiguation and a successful resolution.
There are situations, however, in which automated data collection creates datasets of higher quality than those created by a manual process. This happens when the artifacts that the data is collected from are generated outside of the critical-path in the engineer workflow. A classic example of data of this kind are the various relationships between semantically-related artifacts, such a work item and a source code change or a code change and a code review performed on it. In many engineering workflows, explicitly saving such relationships in the repository is unnecessary for successful task completion and is often considered extra effort. Thus, work items, code reviews and code changes often form independent data silos. An engineer might be asked to make a connection between any two artifacts by a team policy but as the engineering system will work without them, the adherence to policy is based on managerial and peer pressure and often not universally applied. In such cases, being able to discover the relationships automatically from metadata surrounding the artifacts (code reviews and code submissions share many characteristics that can be retrieved from their metadata and correlated) often creates a more complete, higher quality dataset without requiring human input, making it less expensive.
13.5.1.2 Purpose of used data source
No matter if the collection is manual or automated; the particulars of the collection process can heavily influence the ability to draw conclusions from data. Therefore, it is important to have a full understanding not only of the data collection process but how the data was introduced into the system in the first place. Often, knowledge of details allows the analyst to work around data deficiencies. To that end it is important to know the objective of the process or tool that generates the metric.
The most accurate data often comes from tools designed to manage the workflow or process being measured. Such tools or processes are the primary source. Examples include source code version control systems when code churn is being analyzed.
The data accuracy is lower when the data is collected indirectly as it is, for example, when attempting to enumerate bug fixes in code from defect data (which is not the same as the data from source code). And when data needs to be interpreted, the accuracy depends on how well the interpretation aligns with the goal of the metric. For instance, metrics relating to the size of change can take the form of counting changed files or changed lines of code. In some circumstances a “changed file” would also include files newly added or deleted, the definition is dependent on the goal of the metric. In addition, defining a “changed line of code” is even more complex, as it depends on a chosen similarity measure and the format of files. For example, measuring changes in “lines” for XML files, is not very useful. In such cases, the interpretation tries to be as close as possible to the intuitive understanding of the concept of a “change size” by the engineers on a particular project. In the case of changed lines of code, this metric is best approximated by using the same tool the particular engineering team uses for viewing the code diffs. Here, the measurement is a side-effect of a tool.
Special care needs to be applied to any metric that concerns measuring people or teams. Especially if there are incentives attached to the metrics, the data will over time become unreliable as far as its initial objectives. A classic example is applying a “number of defects found” metric to judge the effectiveness of testing efforts. In such circumstances, it is not unusual to see multiple defects opened for each found symptom of one underlying problem where a single more comprehensive bug report would be more useful and would require less work filling out, triaging, and tracking. Counteracting the effects of gaming is hard because causes of the changes in metrics are often not easily distinguishable from naturally occurring events and requires in-depth knowledge of the project and the team. Normalization and using a set of metrics more resilient to gaming often helps. For example, instead of “defects opened”, it might be worth applying “defects resolved through a code change” metric, since the latter is harder to game; performing a code change is typically more visible across the team than performing a defect record change. Since the problem of gaming might occur in any dataset involving events produced by incentivized people, recognition of its potential existence and applying countermeasures is therefore very important.
13.5.1.3 Process semantics
In many cases, specifics of the workflow are not explicit; but required for correct interpretation of data. Such workflow semantics can be understood in the context of and with deep knowledge of the process and the team working on a project. How important it is to understand the assumptions being made on the project is best illustrated with challenges faced when interpreting defect data.
Defect reports come from many sources: internal testing efforts, limited deployments, production deployments, telemetry collected directly from users, either automatically or through surveys and studies. The source of a defect report often determines the quality of the report and its fate. For example, crash data being reported automatically is precise as far as the symptom and, at least partially through the stack trace, the path software took to trigger the problem. Such defects often have a determinate root cause and a solution. On the other hand, when reporting issues found by usability studies, there is more subjectivity and consequently less precision in the defect report.
There is also a lot of subjectivity around categorization of defects. Assigning severity to a defect, even on teams with strong policies, is often unequal. A simple issue of deciding whether a task is tracking a bug fix or a more general work item can be difficult to deconstruct and varies even among teams working on the same product. Applying the concept of “bug triage” is frequently a way for a team to impose some measure of consistency of information gathered and resolution on the bug queue. Bug triage often removes noise from the defect data, for example, by requesting that all defects come into the queue with some minimum level of information provided, that work items tagged as defects are not in fact features (or vice versa), or that duplicates of the same issue are recognized and tagged properly. From the metrics point of view, defects which have gone through triage are typically carrying more data, are of higher quality and more readily amenable to analysis. In the absence of a team triage, the data clean up falls on the analyst who may be less knowledgeable about the team’s policies and consequently less able to produce a high quality dataset.
Another class of problems with defect data stems from the fact that records for some of the defects do not exist (are omitted) so they may not reflect the reality of the product. Most commonly, omission of records happens when fixing a defect is less costly than the cost of tracking it in a formal system, or the visibility requirements at that stage of the project are not high. Code reviews, for example, depending on the level of formality attached to them, may result in defects being communicated to an engineer through a side channel, an informal conversation, or a comment attached to an e-mail. Customer-reported issues, on the other hand, are treated with more formality, in no small measure to ensure that there is a record of the interaction with the customer.
13.5.2 Data Interpretation
This section discusses some of the most common issues regarding interpreting metrics, and some methods to mitigate them.
13.5.2.1 Metrics as indicators
While metrics ideally should reflect the development process, they are often only indicators of the status of the project and not precise statements of fact about the project. Software development is a complex process and metrics provide windows into the development process but rarely a complete view. As such the metrics should assist in managing software development but they are not a substitute for management.
The people responsible for interpreting the metrics should continually validate their interpretation with the software engineers developing the product. Where divergence occurs between the interpretation and the engineer’s perception, then the reasons for the divergences needs to be understood which may result in changes to how the metrics are interpreted.
13.5.2.2 Noisy data
There are two main classes of noisy data: missing data and unreliable data.
Missing data can occur due to tool issues or changes in practices. In these circumstances it is necessary to capture this data via different methods. Missing data should be investigated as it may be indicative of problems of either the development tools or the development process.
Unreliable data will always exist irrespective of the quality of the tools and the collection process. A common issue is the focus of development tools (which is not on metrics generation) so the metrics may not be totally accurate. For example, code diff’ing tools are inaccurate when the difference between files is large. Another common issue is default values in data fields; when data is entered manually it may not be clear if the person intended the field to be set to the value or they forgot to set the field to the correct value. A common issue is that a lot of defect reporting processes will have a default value for the defect priority and severity. These default values can bias any results. The greatest reason for noisy data, however, is data generated manually that is not strictly necessary for completion of primary tasks. Examples of auxiliary data often generated manually include: time spent on actions, ownership data, organization structure data. This data is often not kept up-to-date, or is liable to be gamed.
The models used for interpretation need to be able to handle missing data. If data is missing or becomes unreliable then it should be excluded from the model. But the model should be able to differentiate between a zero value for data and a null value, which represents missing data.
13.5.2.3 Gaming
Gaming of the system occurs when groups or individuals use the rules and procedures that are meant to protect or allow for understanding of a system, to manipulate the systems for a desired outcome. Gaming is more likely to occur when individuals or teams are being measured implicitly or explicitly by metrics. A common example of this is the effectiveness of test teams being measured in terms of the number of defects they find or code coverage achieved. This places pressure on the test team to find defects in a product irrespective of its quality or to add coverage in places that are not substantially at risk of failure only to achieve a desired number. If such gaming becomes prevalent, it invalidates the using of susceptible metrics as measures of quality.
Gaming can often be identified through correlations between metrics, so for instance, if the rate of defects opened is not correlated to the rate of defects fixed through code changes, this raises issues regarding the validity of using opened defects as a quality metric.
Where gaming has been identified then those metrics should not be used and other non-gamed metrics need to be identified. In the example above, where the rate of opened defects is not reflective of quality, then it can be replaced by the rate of code churn due to bug fixes.
13.5.2.4 Outliers
Metric outliers can skew statistics, such as averages, and so the temptation is to automatically ignore these values. Unfortunately, an outlier may either be due to noisy data or actual product issues. Monitoring and interpreting metrics from a single product makes it difficult to automatically interpret outliers. To understand the cause of outliers requires manual inspection of the data.
When applying the same set of metrics to multiple products it is possible to automatically differentiate between noisy data and truly problematic areas. Where the same set of outliers occurs across multiple products then it is more likely that the data is representative of normal product behavior and not corrupt data. Outliers should be discussed with the engineering team as some outliers indicating bad behavior may be normal development practice. For instance, the development team may decide to follow a different development methodology for a specific subtask of the development (as in certain cases of refactoring).
13.6 Example of Changing Product Development Through the Use of Data
During the development of Windows Server 2012, the product team was frustrated by the length of time it was taking engineers to integrate completed features into the trunk branch.
The product team set two goals for themselves:
1. Increase the velocity of code integration from the feature branches into the trunk branch.
2. At least maintain but preferably improve product quality.
To achieve these goals the product team had to investigate what was the current code velocity for the product and what were the influencing factors. Windows Server is developed in a large branch tree, which shares the same trunk branch with Windows Client (Windows 8 and 8.1). The Windows Server development cycle is split into multiple milestones; some milestones are allocated for refactoring, some for feature development, and some for stabilization. The focus on code velocity is mainly during the feature development periods, so the investigation focused on that period.
To generate a benchmark for Windows Server 2012 R2, data analysts and engineers from the product team analyzed the metrics generated during the Windows Server 2012 development. Where the metrics were at odds with the perceptions of what the engineers believed occurred (e.g., a particular feature was problematic) the data analysts and the engineers met to understand these differences. The most common reasons for differences between the metrics and engineering perception was misinterpretation of a metric, the requirement for the metric to take into account other related measurements, or the engineering teams “forgetting” issues with the product development. The result of the exercise was to improve the accuracy of the metrics and also to increase the confidence of the engineering team with the metrics.
Analysis of the data identified that the branches with more engineers developing code on, had the fastest code velocity; and the more shallow the branch tree the faster the code velocity was. Analysis of factors influencing code velocity identified the necessity of treating implementation and integration velocity separately. For code quality, the main focus was on avoidance of code integration issues. Typical examples of such issues are: (i) merge conflicts where code simultaneously developed on two parallel branches does not cleanly merge into a branch dedicated to verification, resulting in failure of the merge; (ii) runtime issues discovered in testing. Analysis identified a correlation between the number of code conflicts and the integration velocity.
Based on the analysis, the decision was made to increase the number of teams who developed code simultaneously on the same branch and to decrease the depth of the branch tree. The resulting architectural changes are shown in Figure 13.2.

Reducing the depth of the branch tree was perceived as an increased quality risk, as certain branches where dedicated to verification purposes and now these branches were being removed. Additionally, the product group, recognizing that changing a complex process can have unforeseen side-effects, wanted to continuously monitor the impact of the changes in development architecture.
At the end of the first feature development milestone for Windows Server 2012 R2, a full analysis was performed comparing Windows Server 2012 R2 (the new branch model) behavior against that of Windows Server 2012 (old branch model serving as a benchmark). The product team was interested in comparison between old and new processes, not the absolute values achieved. The results of the analysis are displayed in Table 13.2, as interpretation of the metric value is dependent on the metric itself, a status column is included to assist the readers. In the Status column, we indicate whether the change between releases was viewed as a positive or negative change.
Table 13.2
Comparable Metrics Between Product Developments
| Category | Metric | Windows Server 2012 | Windows Server 2012 R2 | Status |
| Branch size | Number of Branches | 1× | 0.74× | Positive |
| Engineers per Branch | 1× | 2.1× | Positive | |
| Teams Per Branch | 1× | 2.1× | Positive | |
| Code velocity | Implementation Velocity | 1× | 0.88× | Positive |
| Integration Velocity | 1× | 1.23× | Negative | |
| Quality | Integration Conflicts | 1× | 0.56× | Positive |
| Volume of churn | Files | 1× | 1.28× | Positive |
| Lines | 1× | 1.28× | Positive |

Meetings were held with the product team to better understand these results. Specifically, questioned about changes to working practices, it was identified that while individual teams preferred to work separately in their own branches, they all felt that they benefited from working in branches with their related teams. The teams felt that the sharing of branches is the reason for the reduction in code conflicts. Previously, teams would develop their features separately and then merge the feature into a larger branch for verification. Often, during that verification stage, which could be days after the code was originally written, conflicts were identified. During Windows Server 2012 R2, as more teams worked simultaneously in the same branch conflicts were identified and corrected immediately. Further analysis confirmed that the teams were moving more towards a continuous integration style of development.
Ironically, the metric that showed the smallest overall improvement was the implementation velocity, additionally the integration velocity showed a decrease, which was the opposite of what was intended. The combination of these metrics identified that code was spending less time in the branch used to develop the feature but more time being processed through the branch structure. Further investigation highlighted that separate decisions had been made to increase the amount of system testing that the software had to undergo prior to being allowed to check into the trunk branch; this increase may have been a reaction to the decrease in the number of integration branches dedicated to testing.
Overall the amount of code generated by the development team during the milestone period increased by 28%, indicating a general improvement in productivity. This improvement of the Windows Server 2012 R2 development process was considered successful by the product team. Consequently and following that, the team embarked upon a second major round of changes to the branch architecture using the same metrics-based methodology.
The three main findings that readers should take from this example are:
1. The importance for the product team to have clear measureable goals: Through the considerable effort in analyzing Windows 8, the teams could both quantify goals and have confidence that the metric generation process would accurately characterize the development of Windows 8.1.
2. Continuously meeting with the product team to interpret the metrics, during the product development: These meetings quickly identified where changes in the development process resulted in incorrect interpretation of the metrics, due to missing data or changes in naming conventions, etc. This ensured that when the product teams needed the data to make decisions then the data was accurate and available.
3. Changing a complex process will always have unpredicted side-effects: The changes to the development process had a positive side-effect of improving the working practices of the engineering teams. But equally the changes could have resulted in negative impact on other aspects of the development process (e.g., an increase in the velocity measures could have resulted in a decrease in quality). Therefore, it is important to not only monitor those aspects of the development process that are planned to change, it is also important to monitor areas that are supposed to be unaffected by the change.
The next section takes the learnings gained from a number of similar studies within Microsoft and provides a generalized approach to develop a data-driven engineering process.
13.7 Driving Software Engineering Processes with Data
This section summarizes the overall approach a software engineering team should apply to use data to drive their engineering processes, based on the factors discussed previously in this chapter.
The minimum requirement to enable data to help drive the software engineering process is for companies or product teams to define goals for their software development process.
The act of setting development goals forces the product groups to define the metrics that will be used to monitor those goals. Through defining the goals the product teams will also define the relative importance of different aspects of the development process. While ideally, product groups will want all aspects of their process to improve, realistically, improving one development characteristic will often have, at least initially, a negative impact on another characteristic. For example, it is challenging to increase the speed of product release and maintain quality without sacrificing the number of features in the release without a period of adjustment.
Without goals, it is also difficult to interpret the collected metrics. If the product performance is monitored and the average response time increases, without understanding the intention of the product teams, it is difficult to determine if that change was good or bad. Under such conditions, discussions that are supposed to be about the actions to be taken from the metrics inevitably result in time spent trying to resolve the definition of the metrics. Discussions about the implicit goals of the product and the actions are deferred.
Since a standard set of metrics that product groups can use to monitor their development process does not exist, in Table 13.1 we provide a sample set of metrics that can help product teams in establishing their own scorecards. For all the metric categories, we provide examples of specific metrics, the goals for the metrics, and some of the challenges in interpreting those metrics.
Once the product group has determined the goals of the software engineering process and their metrics, they need to develop a process to collect and report on those metrics. The process of collecting metrics should be as automated as possible. The metrics and the data collection process can be verified through applying the process to prior releases of the same or similar products. The data analyst should characterize the behavior of the development of the prior product release and then verify their interpretation with the engineers who worked on the product. Through these discussions, the data analyst can improve their interpretation methods and also become aware of the accuracy and relevance of the chosen metrics. Ideally, this process should be applied to more than one development project, as that allows the data analysts to be better able to interpret whether statistical anomalies should be ignored or if they should be flagged as issues that need addressing.
Benchmarking the software engineering process based on the prior releases will allow the data analysts to translate the product goals into metric values. These metric values may vary over the total development cycle, for instance the code velocity during feature development periods should be longer than during stabilization periods.
This background work provides the information to allow the data analysts to track the performance of the product through comparing the collected metrics to the product goals. The focus of the data analysts during the development process should be to:
1. Continually validate the collected metrics through discussions with the engineering team and through correlate-related metrics to ensure their accuracy and lack of gaming.
2. Validate that the product development is still performing to plan based on the values of the collected metrics in relation to the product goals.
3. Examine the main drivers of any specific metric to identify opportunities to improve the metrics through optimizing the development process.
The process of creating product goals and translating those goals to validated metrics is expensive, but once a product group has a trusted set of metrics, and a set of metric-based goals, they can use those to drive product development and to optimize their development process.