
Analyzing Text in Software Projects
Stefan Wagner*; Daniel Méndez Fernández† * Software Engineering Group, Institute of Software Technology, University of Stuttgart, Stuttgart, Germany
† Software & Systems Engineering, Institut für Informatik, Technische Universität München, Garching, Germany
Abstract
Most of the data produced in software projects is of textual nature: source code, specifications, or documentation. The advances in quantitative analysis methods drove a lot of data analytics in software engineering. This has overshadowed to some degree the importance of texts and their qualitative analysis. Such analysis has, however, merits for researchers and practitioners as well.
In this chapter, we describe the basics of analyzing text in software projects. We first describe how to manually analyze and code textual data. Next, we give an overview of mixed methods for automatic text analysis, including n-grams and clone detection, as well as more sophisticated natural language processing identifying syntax and contexts of words. Those methods and tools are of critical importance to aid in the challenges associated with today’s huge amounts of textual data.
We illustrate the methods introduced via a running example and conclude by presenting two industrial studies.
3.1 Introduction
Most of the data we produce in software projects is of a textual nature. This ranges from requirement specifications to designs and documentation and customer surveys. Textual data, however, is notoriously difficult to analyze. We have a multitude of techniques and tools which are well known to software developers to process and analyze quantitative data. We handle numerous bugs or lines of code very often. Yet, what should we do with all the textual data? So far, the potential of analyzing this data has not been realized.
Software analytics for practitioners already involves (and will increasingly involve) how to make use of all this textual data. Fortunately, we have seen an interesting development in the research area of analyzing texts. This is often promoted under the umbrella text mining or text analytics. Both mean roughly the same thing: systematically retrieve and analyze textual data to gain additional insights, in our case additional insights into the software development project.
In this chapter, we first discuss and categorize what kind of textual data we usually encounter in software projects and where we encounter it. On the basis of this categorization, we will discuss the sources of this textual data and how to retrieve them. Next, we will introduce manual coding and analysis as a very flexible but elaborate means to structure and understand different texts. As a means to handle large amounts of text and reduce the manual effort, we will discuss a sample of the currently available automatic analyses of texts such as n-grams or clone detection.
Finally, we will employ a running example of textual data which we will analyze with each analysis approach presented. We use the publicly available specifications of the Hypertext Transfer Protocol (HTTP) and the Internet Message Access Protocol (IMAP) as typical representatives for textual requirements specifications. In the case of automatic analyses, we will provide references to the tools used so that the examples can be easily reproduced.
3.2 Textual Software Project Data and Retrieval
Textual data appears at many points in a software development project. The main result of a software project—the code—is also textual although we are more concerned with natural language text in this chapter. Yet, source code usually contains also a considerable share of natural language text: the code comments. Apart from that, we have requirements specifications, architecture documentation, or change requests with textual data. There is no generally agreed on classification of the artifacts generated in a software development project, and hence there is also no agreement about textual data contained in these artifacts. As a foundation for the remainder of this chapter, we will therefore first discuss different sources of textual data and then classify them to describe how to retrieve the data for further analysis.
3.2.1 Textual Data
Sources of textual data
Although we often consider software developers to be people dealing mostly with formal languages—that is, programming languages—there are many sources of textual data in a software project. Most of this data comes from the developers themselves. A substantial part of any high-quality source code consists of informal or semiformal text code comments. These already contain shorter inline comments as well as longer descriptions of interfaces or classes (as, e.g., with JavaDoc for Java). Apart from that, depending on the development process followed, many other documents are written by the developers or other people in related roles, such as testers, software architects, and requirements engineers. These include requirements specifications, design and architecture documents, test cases, test results, and review results. Yet, we need to think also beyond the “classical” artifacts in software development. Team members nowadays communicate via e-mails and chats, change requests, and commit messages, which all are available electronically as text sources. Finally, in a software project, especially in the context of product development, customer surveys and product reviews are a common means to better understand the requirements for and satisfaction with a software product. These artifacts can also contain open questions which result in textual data to be analyzed.
A classification of textual software project data
We found the general structure of the German standard software process model V-Modell XT1 to be useful to classify artifacts related to software engineering as it is rather general and applies to many application domains. It contains several detailed artifacts that we do not consider in our classification of textual software project data, but we follow the general structure. The classification is shown in Figure 3.1.

The V-Modell XT structures the textual artifacts mainly along different process areas or disciplines in the development process. This starts with documents for contracting such as requests for proposals or offers. One could, for example, be interested in analyzing public requests for proposals to investigate technological trends. Next, there are several textual documents in project planning and control. An example that could be interesting for text analytics is risk lists from projects where we could extract typical risk topics to define mitigation points. We classified the above-mentioned e-mails under reporting, which could give relevant insights into the communication between developers or between developers and customers. A now commonly analyzed area in software engineering research is configuration and change management. Problem reports, change requests, and commit messages all contain valuable textual information about a project’s progress. By evaluation, we mean artifacts related to evaluating other artifacts in the project—for example, test case specifications. We could analyze, for instance, the terminology used in the test cases and compare it with the terminology used in the code. The next three categories correspond to the constructive phases of the project: requirements and analysis, software design, and software elements. All contain valuable information about the product. In the latter, we see also the code and with it the code comments, in which we can check the language used by text analytics. Finally, the logistic elements contain any further documentation which could also be analyzed for the topics discussed and for relationships between documents.
Running example
As a running example for the remainder of this chapter, we chose the specifications of Internet protocols. They are openly available examples of software requirements specifications. The Internet Engineering Task Force publishes all open protocols as so-called Requests for Comments (RFCs) and, hence, these documents are called RFC XXXX, where “XXXX” is the number of the specification. We selected standards concerning two well-known Internet protocols: HTTP and IMAP. We hope that by choosing these, we avoid lengthy introductions and potential misunderstandings about the domain. HTTP is the application-level Internet protocol for most network applications today. IMAP allows access to mailboxes on mail servers. For methods that require a larger text corpus, we add additional RFCs to the corpus that are related to HTTP or IMAP.
The following is a part of RFC 2616 of the specification of HTTP 1.1. It describes valid comments in the HTTP header. It shows that our examples contain text that is similar to text in other requirements specifications:
Comments can be included in some HTTP header fields by surrounding the comment text with parentheses. Comments are only allowed in fields containing “comment” as part of their field value definition. In all other fields, parentheses are considered part of the field value.
Yet, also other kinds of text need to be analyzed. In our industrial studies in Section 3.5, we see that free-text answers in surveys are usually not well-formed, complete sentences. Also code comments are often not complete sentences. Although we will not discuss this in detail in the following, most techniques are able to cope with this.
3.2.2 Text Retrieval
With the various sources and classes of different texts in software engineering projects, the first step is to collect or retrieve these texts from their sources. A complete text corpus, consisting of different texts, will often come from different sources, and we want to keep connections between the texts as stored in the sources. For example, we often have pointers from the commit messages in the version control system to specific change requests in the change management system. These links are useful for further analysis and should be retrieved. Figure 3.2 gives an overview of such retained links between texts in the text corpus. In the following, we will go through the categories of textual project data from Section 3.2 and discuss the sources and possible links between texts.

The texts in the supply and contracting category are often not stored with most of the other project documentation. They are usually held either in the form of a formatted document on a file server or as part of a larger enterprise resource planning (ERP) system. Hence, we need either to access the file server and extract the plain text from the formatted document or to access the ERP system, which usually has some kind of application programming interface (API) to retrieve data. We should aim to keep links to the actual project in terms of project IDs or something similar.
Similarly, planning and control texts are also often kept as formatted documents on file servers or in ERP systems. Then, they need to be treated in the same way as supply and contracting texts. They have a better chance, however, of being also kept in a version control system. For example, the above-mentioned risk lists can be maintained also as plain text and, therefore, can be easily handled in Subversion2 or Git.3 Then, we can use the APIs of the corresponding version control system for retrieval. This also allows us to retrieve different versions and, hence, the history of documents, which can be necessary for temporal analyses.
Reporting can be done in formatted documents, ERP systems, and version control systems. Quality status reports can also be automatically generated by quality control systems integrated with the continuous integration system. For example, SonarQube4 or ConQAT5 can be used to automatically generate quality reports on the basis of data from various sources. These reports can be used directly if they can be retrieved. Usually they provide the possibility to put the report as a file on a server, into a version control system, or into a database. They often provide links to the artifacts analyzed, which should be retained if possible. E-mail can be most easily retrieved if a central mail server is used for the project. While most textual data we retrieve is sensitive, with e-mail we need to take the utmost care not to violate privacy rules established in the organizational context. It is advisable to anonymize the data at this stage and only keep, for example, links to specifications or code explicitly referenced in the e-mails.
Texts from configuration and change management are programatically easy to obtain as they are stored in databases in most companies. We have the above-mentioned version control systems, ticketing systems (e.g., OSTicket6 ), and change or issue management systems such as Bugzilla7 and Atlassian Jira.8 They all provide APIs to retrieve the text contained. Depending on the system and possible naming conventions, we can retrieve, besides the texts, links between commit messages and change requests or links between problem reports and change requests.
The further categories are supposed to be held mostly in version control systems. Evaluation (i.e., test or review) reports that sometimes are stored separately on file servers can be exceptions. Also user survey results can be retrieved most easily by going directly to the online survey servers used. They often provide some kind of API or export functionalities. Otherwise, we need to write a Web crawler or retrieve the results manually. To be able to retrieve code comments, we also need to write an extraction tool that is able to distinguish between code and comments. It can also be useful to distinguish different types of comments as far as this is possible in the retrieval directly. This could also be a further step in the analysis.
3.3 Manual Coding
Once we have collected textual data for analysis and interpretation, it needs to be structured and classified. This classification is often referred to as coding, where we identify patterns in texts, having an explanatory or a exploratory purpose [1] and serving as a basis for further analysis, interpretation, and validation. Coding can be done in two ways: manually or automated. In this section, we introduce coding as a manual process. A detailed example for applying the manual coding process is provided in Section 3.5.1.
Although manual coding is often associated with interview research, the data we code is not limited to transcripts as we can structure any kind of textual data given in documents, Wikis, or source code (see also Section 3.2.2). This kind of structuring is used in social science research and is also gaining attention in software engineering research. An approach commonly used in these research areas is grounded theory. We briefly describe grounded theory in Sidebar 1, but its theoretical background is not necessary for many practical text analysis contexts.
3.3.1 Coding Process
Manual coding is a creative process that depends on the experiences, views, and interpretations of those who analyze the data to build a hierarchy of codes. During this coding process, we conceptualize textual data via pattern building. We abstract from textual data—for example, interview transcripts or commit comments stated in natural language—and we build a model that abstracts from the assertions in the form of concepts and relations. During this coding process, we interpret the data manually. Hence, this is a creative process which assigns a meaning to statements and events. One could also say that we try to create a big picture out of single dots.
There are various articles and textbooks proposing coding processes and the particularities of related data retrieval methods such as why and how to build trust between interviewers and interviewees (see, e.g., Birks and Mills [1]). The least common denominator of the approaches lies in the three basic steps of the coding process itself followed by a validation step:
1. Open coding aims at analyzing the data by adding codes (representing key characteristics) to small coherent units in the textual data, and categorizing the concepts developed in a hierarchy of categories as an abstraction of a set of codes—all repeatedly performed until a “state of saturation” is reached.
2. Axial coding aims at defining relationships between the concepts—for example, “causal conditions” or “consequences.”
3. Selective coding aims at inferring a central core category.
4. Validation aims at confirming the model developed with the authors of the original textual data.
Open coding brings the initial structure into unstructured text by abstracting from potentially large amounts of textual data and assigning codes to single text units. The result of open coding can range from sets of codes to hierarchies of codes. An example is to code the answers given by quality engineers in interviews at one company to build a taxonomy of defects they encounter in requirements specifications. During open coding, we then classify single text units as codes. This can result, for example, in a taxonomy of defect types, such as natural language defects which can be further refined, for example, to sentences in passive voice. During axial coding, we can then assign dependencies between the codes in the taxonomies. For example, the quality engineers could have experienced that sentences in the passive voice have frequently led to misunderstandings and later on to change requests. The axial coding process then would lead to a cause-effect chain that shows potential implications of initially defined defects. The final selective coding then brings the results of open and axial coding together to build one holistic model of requirements defects and their potential impacts.
We subsequently form a process that we applied in our studies and which worked well for us. Figure 3.3 depicts the basic coding process and further steps usually (or ideally) performed in conjunction with the coding process.

The idea of (manual) coding—as it is postulated in grounded theory—is to build a model based on textual data—that is, “grounded” on textual data. As the primary goal is to gather information from text, we need to follow a flexible process during the actual text retrieval and the coding process as well. For example, in the case of conducting interviews, we perform an initial coding of the first transcripts. If we find interesting phenomena for which we would like to have a better understanding of the causes, we might want to change the questions for subsequent interviews; an example is that an interviewee states that a low quality of requirements specifications is also connected with low motivation in a team, leading to new questions on what the root causes for low motivation are. We thereby follow a concurrent data generation and collection along with an emerging model which is also steered according to research or business objectives.
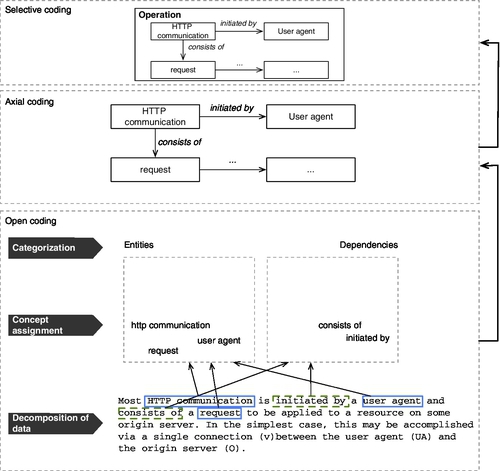
Figure 3.4 shows the coding steps for our running example. During the open coding step (lower part of the figure), we continuously decompose data until we find small units to which we can assign codes (“concept assignment”). This open coding step alone shows that the overall process cannot be performed sequentially. During the open coding step, we found it useful
• to initially browse the textual data (or samples) before coding them to get an initial idea of the content, meaning, and finally, of potential codes we could apply,
• to continuously compare the codes during coding with each other and especially with potentially incoming new textual data, and
• to note down the rationale for each code to keep the coding process reproducible (of special importance if one is relying on independent recoding by another analyst).
Having a set of codes, we allocate them to a category as a means of abstraction. In our running example, we allocate the single codes to the categories “entities” and “dependencies.” During axial coding, we then assign directed associations between the codes. Finally, the last step in the coding process is supposed to be the identification of the core category, which often can also be predefined by the overall objective; in our case, it is “Operation.”
The overall coding process is performed until we reach a theoretical saturation—that is, the point where no new codes (or categories) are identified and the results are convincing to all participating analysts [1].
3.3.2 Challenges
The coding process introduced is subject to various challenges, of which we identify the following three to be the most frequent ones.
1. Coding as a creative process. Coding is always a creative process. When analyzing textual data, we decompose it into small coherent units for which we assign codes. In this step, we find appropriate codes that reflect the intended meaning of the data while finding the appropriate level of detail we follow for the codes. This alone shows the subjectivity inherent to coding that demands a validation of the results. Yet, we apply coding with an exploratory or explanatory purpose rather than with a confirmatory one. This means that the validation of the resulting model is usually left to subsequent investigations. This, however, does not justify a creationist view of the model we define. A means to increase the robustness of the model is to apply analyst triangulation, where coding is performed by a group of individuals or where the coding results (or a sample) of one coder are independently reproduced by other coders as a means of internal validation. This increases the probability that the codes reflect the actual meaning of textual units. We still need, if possible, to validate the resulting model with the authors of the textual data or the interviewees represented by the transcripts.
2. Coding alone or coding in teams. This challenge considers the validity of the codes themselves. As stated, coding (and the interpretation of codes) is a subjective process that depends on the experiences, expectations, and beliefs of the coder who interprets the textual data. To a certain extent, the results of the coding process can be validated (see also the next point). Given that this is not always the case, however, we recommend applying, again, analyst triangulation as a means to minimize the degree of subjectivism.
3. Validating the results. We can distinguish between an internal validation, where we form, for example, teams of coders to minimize the threat to the internal validity (the above-mentioned analyst triangulation), and external validation. The latter aims at validating the resulting theory with further interview participants or people otherwise responsible for the textual data we interpret. This, however, is often not possible; for example, in the case of coding survey results from an anonymous survey. In such cases, the only mitigation we can opt for is to give much attention to the internal validation where we try to increase the reliability of the theory during its construction—for example, by applying analyst triangulation.
3.4 Automated Analysis
As any manual coding and analysis of textual data is difficult, largely subjective, and very elaborate, automation can have a huge positive effect. Especially in recent years, automated natural language processing has made progress we can exploit for analyzing software data. We cannot replace reading a complete introductory book on natural language processing with this chapter. Yet, we will concentrate on a selected set of promising techniques and corresponding tools that can give us insight into software engineering data complementing manual coding.
3.4.1 Topic Modeling
We often want to quickly get an overview of what different texts are about—for example, to decide what to read in-depth or to simply classify the texts. Topic modeling is an automatic approach that attempts to extract the most important topics per text document. The basic assumption of topic modeling [6] is that documents are created using a set of topics the authors want to describe and discuss in the documents. The topics might, however, not be explicitly specified in the documents, and might remain only implicitly in the heads of the authors. Nevertheless, for each topic, the authors still use certain words in the documents. Therefore, for this analysis, we say that a topic is formed by a set of related words. Hence, there are probabilities with which certain words appear in the context of several topics. Topic modeling makes use of this by aiming to extract these probabilities and thereby recreating the topics. Figure 3.5 shows the whole process from document creation based on topics and the subsequent topic modeling to rediscover the topics. Hence, the user of topic modeling does not have to specify any topics to look for in the documents, but they are extracted from the text.

Mathematically, we need an algorithm which is able to group the words extracted from documents into probable topics. The most common one used is latent Dirichlet allocation [7], but there are others to choose from. The concrete algorithm is mostly uninteresting for the user of the topic modeling method, because all algorithms are not exact. An exact algorithm is impossible to define as the goal (the topics) are not clearly defined. The algorithms typically start by assigning topics to words randomly and then use Bayesian probability to incrementally refine the assignment. Finally, when an equilibrium is reached and the assignments cannot be improved, we have the most probable topics for the corpus of documents.
The uses of topic modeling of software engineering data are vast. For example, if we have a large body of existing specifications to which our software has to conform, we can generate a network of documents based on the topics they share. Fortunately, there is open and usable tool support for building topic maps. Mallet9 is written in Java, and allows users either to run it using the command line or to include it into their own analysis software using an API. Hence, topic modeling is a useful tool for getting an overview of a large corpus of documents.
By applying topic modeling to our running example of RFC specifications using Mallet, we can reconstruct several useful topics related to HTTP and IMAP. Figure 3.5 also illustrates some of the rediscovered topics. The top topic for the uniform resource identifier specification contains server, message, client, and standards. For the HTTP specification, we get the terms request, response, header, and http, and for the IMAP specification, we get command, mailbox, message, and http. Not every word in each topic is helpful. Some can even be confusing, such as http in IMAP, but most of the topics give a good idea of what the specification is about. Furthermore, each document can have more than one topic. Figure 3.5 shows this by the thickness of the arrows.
A simple alternative for small documents, which are not suitable for topic modeling, is word clouds (see also Section 3.4.5) or word counts. These cannot show semantic relationships between words, but infer the importance of words by their frequencies. Available Web tools, such as Voyant,10 can also show the context in which chosen words appear in the text, and thereby, provide an initial semantic flavor.
Topic modeling can give only a rough idea of what the main topics consisting of important words are. The further analysis and interpretation needs manual effort. Yet, especially for larger text corpora, topic modeling can be an interesting preanalysis before manual coding. The topics found can form initial ideas for coding, and we can mark context in which they were found to be checked in detail by the coder.
3.4.2 Part-of-Speech Tagging and Relationship Extraction
A way to further dig into the meaning of a large text corpus is to analyze its syntax in more detail. A common first step for this is to annotate each word with its grammatical task. This is also referred to as part-of-speech (POS) tagging. In its simplest form, this means extracting which word is a noun, verb, or adjective. Contemporary POS taggers [8] are able to annotate more—for example, the tense of a verb. The taggers use machine learning techniques to build models of languages to be able to do the annotations.
We see an example sentence from the HTTP 1.0 specification in Table 3.1. We POS-tagged this sentence using the Stanford Log-linear Part-Of-Speech Tagger [9]. The tags are attached to each word with an underscore as a separator. They use a common abbreviation system for the POS. For example, “DT” is a determiner and “NN” is a singular noun. The full list of abbreviations can be found in [10].
Table 3.1
A POS-Tagged Sentence from RFC 1945
Original sentence from RFC 1945
The Hypertext Transfer Protocol (HTTP) is an application-level protocol with the lightness and speed necessary for distributed, collaborative, hypermedia information systems.
POS-tagged sentence
The_DT Hypertext_NNP Transfer_NN Protocol_NNP -LRB-_-LRB- HTTP_NNP -RRB-_-RRB- is_VBZ an_DT application-level_JJ protocol_NN with_IN the_DT lightness_NN and_CC speed_NN necessary_JJ for_IN distributed_VBN ,_, collaborative_JJ ,_, hypermedia_NN information_NN systems_NNS ._.
This allows us to extract the main nouns which probably form a part of the domain concepts of the specified system. In the example, if we combine consecutive nouns, we will find “Hypertext Transfer Protocol,” “HTTP,” “protocol,” “lightness,” “speed,” and “hypermedia information systems.” These nouns already capture a lot of the main concepts of the specification. We can further qualify them with adjectives. For example, the specification is not only about hypermedia information systems but is also about “collaborative” hypermedia information systems. Yet, we also see a problem in this kind of analysis in this example. The word “distributed” is tagged as a verb (“VBN”) instead of as an adjective, which would probably distort an automated analysis.
The possibilities of further analysis having the POS tags in a text are very broad. A concrete example of exploiting this in the context of software engineering is to extract domain information from a specification to generate design models or code skeletons. For example, Chen [11] investigated the structure of English prose specifications to create entity-relationship (ER) diagrams. Put very simply, he mapped nouns to entities and verbs to relationships. For example, the sentence
Most HTTP communication is initiated by a user agent and consists of a request to be applied to a resource on some origin server.
from RFC 1945 can be transformed into the five entities HTTP communication, user agent, request, resource, and origin server. They are connected by the relationships is initiated by, consists of, to be applied to, and on. The resulting ER diagram is shown in Figure 3.6.

Similar approaches were proposed by Abbott [12] to create a first skeleton of Ada code based on a textual specification and by Kof [13], who has built an ontology from a textual specification to infer initial component diagrams and message sequence charts. All these approaches can help to bridge the gap from textual specifications to further, more formal artifacts. Yet, a multitude of other applications of POS tagging are also possible on other kinds of textual software engineering artifacts. For example, we can assess the quality of requirements specifications by detecting requirements smells such as the passive voice [14]. Furthermore, POS tagging can help as a preprocessing step in manual coding by highlighting nouns, adjectives, and verbs with different colors to quickly grasp the main concepts.
3.4.3 n-Grams
Computational linguists are looking for ways to predict what a next word in a sentence could be. One way to achieve this is by looking at the immediately preceding words. “On the basis of having looked at a lot of text, we know which words tend to follow other words” [15]. Hence, we need a way of grouping these preceding words. A popular way is to construct a model grouping words having the same preceding n − 1 words. This model is then called an n-gram model. An n-gram is a contiguous sequence of n words in a piece of text. The n-gram-based analysis of texts does not aim at abstracting the content of the texts but aims at categorizing or predicting attributes of them.
n-gram models have received a lot of interest in recent years. Part of the interest comes from the availability of Google Ngram Viewer11 for the books digitized by Google. It can show the percentage of an n-gram in relation to all n-grams of all books per year. For example, for the bigram “software engineering,” we can see a spike in the early 1990s and a mostly flat line since the 2000s. So, one application of n-grams is to compare how frequently words occur together in different texts or over time.
Another interesting application of n-grams is for categorizing texts into their languages. On the basis of already learned models for different languages, n-grams can indicate in which language a given text is. Imagine your company policy is to write all documents in English, including specifications and code comments. Then, an analyzer using the n-gram models could look for non-English text in code and other documents. Another example is to automatically classify specification chapters into technical content and domain content. A useful tool in that context is the Java Text Categorizing Library.12 It comes with n-gram models for a set of languages, and is also capable of being trained for other categories. When we sent the RFC specification documents we use as running example into the Java Text Categorizing Library, it correctly classified them as being written in English.
There are further uses of n-gram models in software engineering. Hindle et al. [16] investigated the naturalness of source code. They built n-gram models for source code and then predicted how to complete code snippets similar to autocompletion in modern integrated development environments. Allamanis and Sutton [17] built on the work by Hindle et al. and created n-gram language models of the whole Java corpus available in GitHub. Using these models, they derived a new kind of complexity metric based on how difficult it is to predict the sequence of the given code. The intuition behind this complexity metric is that complex source code is also hard to predict. Hence, the worse the prediction matches the actual source code piece, the more complex it is. These applications are not ripe for widespread industrial use, but show the potential of the analysis technique.
3.4.4 Clone Detection
Clone detection is a static analysis technique born in code analysis but usable on all kinds of texts. It is a powerful technique to get an impression of the syntactic redundancy of a piece of software, and it is highly automated at the same time.
What is a clone?
A clone is a part of a software development artifact that appears more than once. Most of the clone detection today concentrates on code clones, but cloning can happen in any artifact. In code, it is usually the result of a normal practice during programming: Developers realize that they have implemented something similar somewhere else. They copy that part of the code and adapt it so that it fits their new requirements. So far, this is not problematic, because we expect that the developer will perform a refactoring afterward to remove the redundancy introduced. Often, however, this does not happen, either because of time pressure or because the developer is not even aware that this can be a problem.
A developer most often does not create an exact copy of the code piece, but changes some identifiers or even adds or removes some lines of code. The notion of a clone incorporates that too. To identify something as a clone, we allow normalization to some degree, such as different identifiers and reformatting. If complete statements (or lines of text) have been changed, added, or deleted, we speak of gapped clones. In clone detection, we then have to calibrate how large this gap should be allowed to be. If it is set too large, at some point everything will be a clone. Yet, it can be very interesting to see clones with a difference of three to five lines.
As mentioned above, clone detection is not restricted to source code. If the particular detection approach permits it, we can find clones in any kind of text. For example, we have applied a clone detection tool on textual requirements specifications and found plenty of requirements clones. We will discuss this study in detail in Section 3.5.2. This works because clone detection in the tool ConQAT13 is implemented on the basis of tokens which we can find in any text. Only normalization cannot be done because we cannot differentiate identifiers.
Impact of cloning
It is still questioned today in research if cloning is really a problem [18], while Martin [19] states that “duplication may be the root of all evil in software.” Many factors influence the effects of cloning. In our studies, however, we found two clearly negative impacts of cloning.
First, it is undeniable that the software becomes larger than it needs to be. Every copy of text adds to this increase in size, which could often be avoided by simple refactorings. There are border cases where a rearrangement would add so much additional complexity that the positive effect of avoiding the clone would be compensated. In the vast majority of cases, however, a refactoring would support the readability of the text. The size of a software codebase is correlated to the effort needed to read, change, review, and test it. The review effort increases massively, and the reviewers become frustrated because they have to read a lot of similar text.
Second, we found that cloning can also lead to unnecessary faults. We conducted an empirical study [20] with several industrial system as well as an open-source system in which we particularly investigated the gapped clones in the code of those systems. We reviewed all gapped clones found and checked whether the differences were intentional and whether they constitute a fault. We found that almost every other unintentional inconsistency (gap) between clones was a fault. This way, we identified 107 faults in five systems that have been in operation for several years. Hence, cloning is also a serious threat to program correctness.
Clone detection techniques
There are various techniques and tools to detect clones in different artifacts [21]. They range from token-based comparison [22] to the analysis of abstract syntax trees [23] to more semantics-close analyses such as memory states [24]. In the following example, we work with the tool ConQAT mentioned above. It is applied in many practical environments to regularly check for cloning in code and other artifacts. The measure we use to analyze cloning is predominantly clone coverage, which describes the probability that a randomly chosen line of text exists more than once (as a clone) in the system. In our studies, we often found code clone coverage values for source code between 20% and 30%, but also 70% to 80% is not rare. The best code usually has single-digit values for clone coverage. For other artifacts, it is more difficult to give average values, but we have also found clone coverage up to 50% in requirements specifications [25].
In general, false positives tend to be a big problem in static analysis. For clone detection, however, we have been able to get rid of this problem almost completely. It requires a small degree of calibration of the clone detection approach for a context, but then the remaining false positive rates are negligible. ConQAT, for example, provides black listing of single clones and can take regular expressions describing text to be ignored, such as copyright headers or generated code. Finally, we use several of the visualizations the dashboard tool ConQAT provides to control cloning: A trend chart shows if cloning is increasing or a tree map shows us which parts of our systems are affected more or less strongly by cloning.
Running example
We now run the standard text clone detection of ConQAT on the HTTP and IMAP RFCs. By inspecting the found clones, we find several false positives—for example, the copyright header, which is similar in all documents. While these are copies, we do not care because we do not have to read them in detail or compare them for differences. We ignore the headers by giving ConQAT a corresponding regular expression. Figure 3.7 shows an example of a remaining clone in RFC 2616. It describes two variations of HTTP types which are mostly the same. A manual check of what is the same and what is different between the two clone instances would be boring and error-prone. Hence, clone analysis could be used to point to text parts that should be removed and, thereby, make understanding of the specifications easier.

Overall, we have a clone coverage of 27.7% over all 11 analyzed documents from the HTTP and IMAP specifications. The clone coverage is rather evenly distributed, as shown in the tree map in Figure 3.8. The tree map displays each file as a rectangle. The size of the rectangle is relative to the size of the file and the color indicates the clone coverage. The darker a rectangle is, the higher the clone coverage for this file. This can quickly give us an overview of even a large number of documents.

Manual coding as well as automatic techniques, such as POS tagging or topic modeling, aim at providing a concise abstraction of the text. We can use it to describe, summarize, and better understand the text. Clone detection, however, has the goal to describe the redundancy created by copy and paste in the text. Hence, a possibility is to use clone detection as a first analysis step to exclude clones from the further analysis. Simply copied texts will otherwise distort the other analyses.
3.4.5 Visualization
“A picture is worth a thousand words” is a cliché, but a graphical visualization can help strongly in understanding the results of text analyses. In the previous sections, we have already seen a tree map in Figure 3.8 to quickly get an overview of cloning in different text files. It could be used to visualize the distribution of all kinds of metrics over files. A further visualization is the ER diagram in Figure 3.6, which shows the domain concepts in a text in an abstract form well known to computer scientists.
The support for analysts by visualization is a very active research area, often denoted by the term visual analytics. Also for visualizing unstructured textual data, several new methods and tools have appeared in recent years. Alencar et al. [26] give a good overview of this area. We will base our discussion on their work and will highlight three exemplary visualizations.
Word cloud
A well-known, simple, but effective visualization of text is called a word cloud, tag crowd,14 or wordle.15 Different implementations give different concrete visualizations, but the idea is always to extract the most frequent words and show them together with the size of each word in relation to its frequency. Our example of the HTTP and IMAP RFCs gives us the word cloud in Figure 3.9. A useful tool for that is Voyant,16 which we have already mentioned in the context of topic modeling (Section 3.4.1). It can create a word cloud out of a text corpus and allows us interactively to change its appearance, include stop word lists (to avoid having “the” as the largest word) and to click on any word to see its frequency and context. The word cloud in Figure 3.9 was created using Voyant. A word cloud can be a good first step for finding the most important terms in a set of texts. For example, it could be an input into a manual coding process for identifying a set of prior codes likely to appear often in the texts.

Phrase net
A comparable visualization that adds a bit more semantics is a Phrase net [27]. It not only presents very frequent words, but also presents their relationship to other frequent words. The kind of relationship can be configured: for example, the connection of both words by another word such as “the” or “is” can be a relationship. Figure 3.10 shows a phrase net for the RFC corpus with the selected relationship “is.” It shows frequent words, the larger the more frequent, as well as arrows between words that are connected by an “is.” The arrow becomes thicker the more frequently the relationship occurs in the text. For example, the RFCs often contain the word “response”—as we already saw in the word cloud—but we additionally see that “response” is frequently connected by “is” to “state-based” and “cacheable.” If the data are publicly accessible, the IBM Many Eyes17 system is an easy tool to create phrase nets. It is a more complicated visualization than word clouds, but gives more information. It could be used as an alternative to create domain models as with POS tagging (Section 3.4.2) or to check and extend those domain models. Furthermore, it could provide a more comprehensive input to manual coding as it contains not only single words but also important relationships between words.

Temporal change
A next step in visualizing textual data was to introduce a further dimension in the visualization such as the change over time in texts. This can be interesting for the analysis of several versions of a document or survey results collected regularly. We can see changes in the interest in different topics, for example. Havre et al. [28] proposed ThemeRiver to visualize topics as streams horizontally over time, with the thickness of the stream related to the strength of the topic at that point in time. Chi et al. [29] extended this with their approach TextFlow, which adds specific events extracted from the texts such as the birth or death of a topic to the streams. At present, there is no tool available to perform this kind of analysis.
A text flow of the different versions of the RFC on HTTP is sketched in Figure 3.11 to show the concept. We see that in 1996, the stream for “request” is bigger than that for “response” and, hence, was more often used. This changes in the later versions. The word “header” comes in as a very frequent word only in 1997, and continues to increase in importance in 1999.

3.5 Two Industrial Studies
We further illustrate the application of text analytics in software engineering by two industrial studies: first, a survey on requirements engineering (RE) we manually coded and analyzed, and, second, clone detection on RE which we combined with manual coding of the requirements clones found.
3.5.1 Naming the Pain in Requirements Engineering: A Requirements Engineering Survey
We conducted this survey study in 2013 as a collaboration between Technische Universität München and the University of Stuttgart. We have been working with industrial partners on RE for several years and had a subjective understanding of typical problems in this area. Yet, we often stumbled on the fact that there is no more general and systematic investigation of the state of the practice and contemporary problems of performing RE in practice. Therefore, we developed a study design and questionnaire to tackle this challenge called Naming the Pain in Requirements Engineering (NaPiRE). While you are not likely to perform the same study, the way we analyzed the free-text answers to our open questions is applicable to any kind of survey. You can find more information on the complete survey in [30, 31] and on the website http://www.re-survey.org/.
Goals and design
Our long-term research objective is to establish an open and generalizable set of empirical findings about practical problems and needs in RE that allows us to steer future research in a problem-driven manner. To this end, we wanted to conduct a continuously and independently replicated, globally distributed survey on RE that investigates the state of the practice and trends, including industrial expectations, status quo, problems experienced, and what effects those problems have. The survey presented in the following describes the first run of our survey in Germany.
On the basis of these goals, we developed a set of research questions and derived a study design and questionnaire. For most of the aspects we were interested in, we designed closed questions that can be analyzed with common quantitative analyses from descriptive statistics. Often we used the Likert scale from “I fully agree” to “I do not agree at all” to let the survey respondents rate their experiences. We often complemented closed questions with an open question to let the respondents voice additional opinions. At the end of the questionnaire, we asked open questions about the personal experiences with RE in their projects. Our design included a manual analysis using manual coding (Section 3.3) of all the textual data we would get from the open questions. We wanted to derive an improved and extended understanding of potential problems which we would then include in the closed questions of the next survey run.
Example questions and answers
Let us look at two examples of open questions we asked in the questionnaire and some answers we got. The first question we discuss is as follows:
If you use an internal improvement standard and not an external one, what were the reasons?
The context was that we first asked about normative standards, defined by external parties, that they use for improving their RE practices. An example of such a standard would be the Capability Maturity Model Integration (CMMI) of the US Software Engineering Institute and adaptations of that standard for RE. We were interested in how satisfied the respondents are with such standards and, in turn, why they did not use them. Answers included “We want to live our own agility,” “We do not use any standard,” and “I am not convinced of the external standards.”
The second question we look at provoked longer answers from most respondents. It is also the one from which we could get the most with our manual coding later. It was as follows:
Considering your personally experienced most critical problems (selected in the previous question), how do these problems manifest themselves in the process, e.g., in requests for changes?
We had presented a set of problems we encountered in practice before in the previous question. Now, we wanted to better understand what problems the respondents consider most critical. From this, we wanted to learn about the context of the problems, potential causes, and candidates for new problems. The answers we got included “Requirements emerge and change priority once the system is deployed. Again, this is no problem but the environment. It becomes a problem if you’re not prepared to deal with it” and “Hard negotiations regarding the CR/Bug question, mostly leading to bad relationship with the customer on project lead level.”
Coding process and challenges
To analyze the free-text answers, we followed the manual coding procedure as introduced in Section 3.3. However, we already have a predefined set of codes (given RE problems) for which we want to know how the participants see their implications. For this reason, we had to adjust our procedure from the standard procedure and rely on a mix of bottom-up and top-down approaches. We start with selective coding and build the core category with two subcategories—namely, RE problems with a set of codes each representing one RE problem and Implications, which then groups the codes defined for the answers given by the participants. For the second category, we conducted open coding and axial coding for the answers until we reached a saturation for a hierarchy of (sub-)categories, codes, and relationships.
During the coding process, we had to tackle several challenges. One was the lack of appropriate tool support for manual coding, especially when working in distributed environments. Another one was the missing possibility to validate the results by getting feedback from the respondents. Figure 3.12 shows the procedure we followed during manual coding.

For this reason, we relied on analyst triangulation during the open coding step as this was essentially the step which most depended on subjectivity (during interpretation of the answers to the open questions). During this open coding step, we decomposed the data using spreadsheets and worked with paper cards, where we also denoted the rationale for selected codes. In a third step, we arranged the cards according to categories using a whiteboard. A third analyst then repeated, as a validation step, independently the open coding process on a sample.
Coding results
Because of the resulting complexity in the answers given and the resulting coding scheme, we describe the results stepwise. To this end, we first introduce the full results from the open coding, followed by the full results of the axial coding. In a last step, we present a condensed overall view of the results as a graph with a minimal saturation. We show only those results having a minimal occurrence in the answers to include only those in our theory.
Figure 3.13 summarizes the full results from the open coding. We distinguish a hierarchy of categories as an abstraction of those codes defined for the answers given in the questionnaire. For each code, we furthermore denote the number of occurrences. Not included in the coding are statements that cannot be unambiguously allocated to a code—for example, the statement “never ending story” as an implication of the problem “incomplete/hidden requirements.”

Given that we asked what implications the problems have, we would expect two top-level categories. The participants also stated, however, reasons for the problems, and occasionally also how they would expect to mitigate the problem. As shown in Figure 3.13, we thus categorize the results into the predefined category RE Problems, Implications, and the additional category Reasoning.
Regarding the implications, we distinguish three subcategories: consequences of problems in the RE phase itself, consequences to be seen in further phases of the software life cycle other than RE, and more abstract consequences for the overall project quality. The highest occurrence of statements is given for the code Change Request, being stated 22 times. Other codes resulted from only one statement, but they were unique, specific formulations that could not be merged with other statements. For instance, the code Weak Relationship Customer & Project Lead in the category Overall SW Project Quality resulted from a statement which we could not allocate to another code without interpretation and potentially misinterpreting the statement (given that no validation with the respondents is possible).
Regarding the reasoning for the given RE problems, we distinguish the category Rationale as a justification of why particular problems occurred, and Improvement/Mitigation for statements that suggested how to mitigate particular problems. The first category can be further divided into Factors in RE and General Factors.
Also here, we encountered very mixed statements, including detailed ones we had to allocate to codes having in the end only one occurrence and vague statements we could accumulate with (consequently vague) codes. The subsequent original statements should give an impression of the answers given:
Code Missing Abstraction from Solution Level: “Stakeholders like to discuss on solution level, not on requirements level. Developers think in solutions. The problem is: even Product Managers and Consultants do it.”
Code No RE explicitly planned (in tendering): “A common situation is to take part in a tender process—where requirements are specified very abstract—most of these tender processes do not include a refinement stage, as a supplier we are bound to fulfill vague requests from the initial documents.”
Code Weak Communication: “The communication to customer is done not by technicians, but by lawyers.”
Code Too Ambitious Time Planning: “Delivery date is known before requirements are clear.”
Code Implicit Requirements not made explicit: “Referencing common sense as a requirement basis.”
Code Failed Acceptance: “After acceptance testing failed, the hidden requirements came up and had to be fixed on an emergency level.”
Code Missing Coordination of Interdisciplinary Teams: “Missing coordination between different disciplines (electrical engineering, mechanical engineering, software etc.).”
The axial coding defines the relationships between the codes. As a consequence of the categories introduced in the previous section, we distinguish two types of relationships:
1. The consequences of given RE problems for the category Implications.
2. The consequences of the codes in the category Reasoning for the RE problems, including rationales and improvement suggestions.
We cannot show the full results of the axial coding here. We further refrain from interpreting any transitive relationships from reasonings to implications because of the multiple input/output relationships between the codes of the different categories; for instance, while “Too ambitious time planning” was stated as an exclusive reason for “time boxing” as an RE problem, the problem “incomplete/hidden requirements” has multiple reasons as well as multiple consequences.
We are especially interested in a condensed result set that omits the codes and the dependencies with limited occurrences in corresponding statements. The reason is that we need a result set with a minimal saturation to propose its integration into the questionnaire for the next run of the survey. After testing the results with different values for the minimal occurrences, we defined a graph including only codes with a minimal occurrence level of 7. This resulting graph is shown in Figure 3.14. Nodes represent a selection of codes, and edges represent a selection of relationships between nodes.

With the chosen minimal occurrence level, the final graph does not include statements coded in the category Reasoning, leaving us with a selection of RE problems interconnected with their implications. The three nodes with the highest occurrence in their underlying statements are “Additional communication and replaning,” “Stagnating progress,” and “Change requests.” Change requests (in the center of the figure) are stated as the most frequent consequence of various RE problems such as time boxing or incomplete/hidden requirements. Additional communication and replanning (upper part of the figure) was another frequently stated consequence of interconnected RE problems, similarly to a stagnating process (left side of the figure).
3.5.2 Clone Detection in Requirements Specifications
We performed this case study in 2009 in a collaboration between Technische Universität München and itestra GmbH as an exploratory study on the extent of cloning in commercial requirements specifications. We had a subjective feeling that there is a lot of textual redundancy in those specifications from experiences with project partners but we had not this investigated systematically before. All details of the study can be found in [25]. It is an example for clone detection on natural language texts (Section 3.4.4) as well as for manual coding (Section 3.3).
What is the problem with clones in specifications?
Requirements specifications are a central artifact in most software development processes. They capture the goals of the software to be developed and constitute the connection between the customer/user and the developers. Many call the specifications the determining part for project success or failure. Yet, as with any other development artifact, requirements specifications contain redundancy. Semantic redundancies are the source of many potential problems in a development project, but are also extremely hard to detect. Yet, there are also syntactic redundancies: Specifications are written by people who tend to copy (and adapt) text if they need similar things in different parts of the document or in different documents. These syntactic redundancies can be found by clone detection (see Section 3.4.4).
In our collaborations with various industry partners on their RE processes, we often found syntactic redundancies in their specifications. They lead to various problems. The most direct is the sheer increased size of the specifications, which, in turn, leads to greater efforts for reading, reviewing, and changing them. In addition, similarly to code cloning [20], redundancy can introduce inconsistencies. The copies of the text drift apart over time as some copies are adapted, for example, to changes in the requirements of the customer, while others are forgotten. We now have conflicting requirements, and the developers can introduce faults into the software. Finally, an undesired effect of clones in requirements specifications is also that the developers introduce redundancy by cloning the implementation or, even worse, develop the same functionality more than once.
Analysis approach
To better understand the actual extent of cloning in industrial requirements specifications, we designed a study in which we used automated clone detection on a set of industrial specifications and then classified the clones found with manual coding. The former gives us a quantification of the phenomenon and the latter gives us qualitative insight into what information is cloned. We worked in several research pairs and followed the process shown in Figure 3.15.

We assembled a set of 28 requirements specifications of various lengths and for a wide variety of systems and domains. We first assigned the specifications randomly among pairs of analysts. Each pair ran a clone detection without any filters using the tool ConQAT. We then inspected the clones found for false positives (pieces of text reported as clones but not actual redundancies). As expected, we found a few false positives such as copyright headers and footers. We added corresponding filters in the form of regular expressions so that the false positives will be ignored. Afterward, we ran the clone detection again and inspected the results. This continued until we could not find any false positives in a random sample of the clones. This gave us the quantitative results of the study.
Afterward, we manually coded a random sample of the clones to form categories of the type of information that was cloned. We had no predefined codes, but developed them while inspecting the clones. As we did not need any larger theory, we skipped axial coding (Section 3.3). The coding gave us a complete set of categories. To validate the more subjectively developed categories, we performed an independent recoding of a sample of the categorized clones and found a substantial agreement between the raters. Besides, we also noted additional effects such as the impact on the implementation. This gave us the qualitative results of the study.
Results of automatic analysis
All the quantitative results of our study are shown in Table 3.2. The outcome is clear: there are many industrial requirements specifications that contain cloning, several with high clone coverage values between 30% and 70%. The third column gives the number of clone groups per specification. A clone group is a set of clones, the individual copies. There are several specifications with more than 100 clone groups. Hence, there has been a lot of copy and paste in these documents. There are also several specifications, however, with no or almost no cloning. Therefore, it seems to be possible to create specifications without copy and paste.
Table 3.2
Automatic Analysis Results of Cloning in Requirements Specifications
| Specification | Clone Coverage (%) | Clone Groups | Clones |
| H | 71.6 | 71 | 360 |
| F | 51.1 | 50 | 162 |
| A | 35.0 | 259 | 914 |
| G | 22.1 | 60 | 262 |
| Y | 21.9 | 181 | 553 |
| L | 20.5 | 303 | 794 |
| Z | 19.6 | 50 | 117 |
| C | 18.5 | 37 | 88 |
| K | 18.1 | 19 | 55 |
| U | 15.5 | 85 | 237 |
| X | 12.4 | 21 | 45 |
| AB | 12.1 | 635 | 1818 |
| V | 11.2 | 201 | 485 |
| B | 8.9 | 265 | 639 |
| N | 8.2 | 159 | 373 |
| D | 8.1 | 105 | 479 |
| P | 5.8 | 5 | 10 |
| I | 5.5 | 7 | 15 |
| AC | 5.4 | 65 | 148 |
| W | 2.0 | 14 | 31 |
| O | 1.9 | 8 | 16 |
| S | 1.6 | 11 | 27 |
| M | 1.2 | 11 | 23 |
| J | 1.0 | 1 | 2 |
| E | 0.9 | 6 | 12 |
| R | 0.7 | 2 | 4 |
| Q | 0.0 | 0 | 0 |
| T | 0.0 | 0 | 0 |
| Average | 13.6 | ||
| Sum | 2631 | 7669 |

Results of manual classification
The manual coding of a sample of clones resulted in 12 categories of cloned information being encountered. The categories we identified are described in Table 3.3 [25]. Overall, we coded a sample of over 400 clone groups almost 500 times because we sometimes assigned a clone group to more than one category, especially if the clones were longer and, hence, contained different aspects. To better understand these different categories and how they occur in practice, we quantified the results by counting the number of clone groups per category in our sample (Figure 3.16). The highest number of assigned codes belongs to the category “Detailed use case steps,” with 100 assignments. “Reference” (64) and “UI” (63) follow. The least number of assignments belongs to the category “Rationale” (8).
Table 3.3
Descriptions of the Categories of Cloned Information in Requirements Specifications
| Detailed use case steps | Description of one or more steps in a use case that specifies in detail how a user interacts with the system, such as the steps required to create a new customer account in a system. |
| Reference | Fragment in a requirements specification that refers to another document or another part of the same document. Examples are references in a use case to other use cases or to the corresponding business process. |
| UI | Information that refers to the (graphical) user interface. The specification of which buttons are visible on which screen is an example for this category. |
| Domain knowledge | Information about the application domain of the software. An example is details about what is part of an insurance contract for software that manages insurance contracts. |
| Interface description | Data and message definitions that describe the interface of a component, function, or system. An example is the definition of messages on a bus system that a component reads and writes. |
| Precondition | A condition that has to hold before something else can happen. A common example is preconditions for the execution of a specific use case. |
| Side condition | Condition that describes the status that has to hold during the execution of something. An example is that a user has to remain logged in during the execution of a certain functionality. |
| Configuration | Explicit settings for configuring the described component or system. An example is timing parameters for configuring a transmission protocol. |
| Feature | Description of a piece of functionality of the system on a high level of abstraction. |
| Technical domain knowledge | Information about the technology used for the solution and the technical environment of the system—for example, bus systems used in an embedded system. |
| Postcondition | Condition that describes what has to hold after something has finished. Analogous to the preconditions, postconditions are usually part of use cases to describe the system state after the use case execution. |
| Rationale | Justification of a requirement. An example is the explicit demand by a certain user group. |

Overall, this study was a beneficial combination of manual and automatic text analyses to better understand the extent and type of cloning in requirements specifications. The automatic analysis has the advantage that we could integrate it into a regular quality analysis—for example, contained in the nightly build of the corresponding system. This way, introduced clones could be detected and removed early and easily. Nevertheless, it is interesting to regularly also inspect the clones and categorize them to understand if new types of clones appear.
3.6 Summary
Textual data constitutes most of the data that is generated in a software project. Yet, we often do not make use of the information and insights contained in this textual data. The problem is that many analysis methods are focused on quantitative data. There are various possibilities of manual as well as automatic analyses now available that help us in employing textual data in better understanding our software projects.
In this chapter, we discussed first manual coding to analyze any kind of textual data. We assigned different types of codes to the text to abstract and interpret it. This is a highly subjective task which needs appropriate means such as triangulation of analysts to make it more objective. Yet, it can be flexibly applied and allows the analysts to bring their own expertise to the data analysis. The biggest problem, however, is the large amount of effort necessary for the analysis.
Therefore, we discussed a sample of automatic analyses available, mostly with easily accessible tool support. For example, clone detection is an easy and viable means to detect any syntactic redundancy in textual software artifacts. Topic modeling is another example that can help us to investigate dependencies between documents or quickly get an overview of topics contained in the documents. Visualizations can greatly support all of these automatic analyses to make them easier to comprehend, especially for large text corpora.
Research on text analytics is still very active, and we expect to see many more innovations that we will be able to exploit also for analyzing textual project data from software projects. The possibilities are huge.