
22. Consequences of the Industrial Revolution
Before the Industrial Revolution, the amount of carbon dioxide (CO2) and other greenhouse gases released into the atmosphere was in a rough balance with what could be stored on Earth. Natural emissions of heat-trapping gases matched what could be absorbed in natural sinks. For example, plants take in CO2 when they grow in spring and summer, and release it back to the atmosphere when they decay and die in fall and winter.
Industry took off in the mid-1700s, and large amounts of greenhouse gases were being emitted.
Fossil fuels were burned more and more to run cars, trucks, factories, planes, and power plants, adding to the natural supply of greenhouse gases. The gases—which can stay in the atmosphere for at least 50 years and up to centuries—are building up beyond the Earth’s capacity to remove them and, in effect, are creating an extrathick heat blanket around the Earth. The result is that the globe has heated up by about one degree Fahrenheit over the past century—and it has heated up more intensely over the past two decades.
According to the National Oceanic and Atmospheric Administration’s Earth System Research Laboratory, carbon dioxide concentrations in the atmosphere increased from approximately 280 parts per million (ppm) in preindustrial times to 382 ppm in 2006, a 36% increase. Almost all the increase is due to human activity. The current rate of increase in CO2 concentrations is about 1.9 ppmv (parts per million by volume). Currently, the CO2 concentrations are higher than at any time in at least the past 650,000 years. See Figure 22-1 and Figure 22-2 for a record of CO2 concentrations from about 420,000 years ago to present.(1)
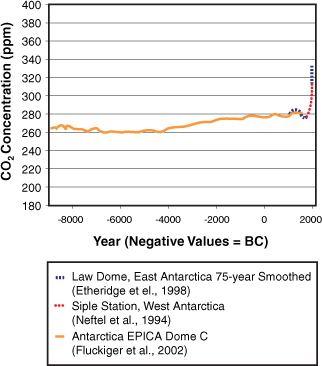
Figure 22-1. CO2 concentrations from 8947 BC to 1975 AD(1)

Figure 22-2. CO2 concentrations from 1959 AD to 2006 AD(1)
Scientists expect that, in the absence of effective policies to reduce greenhouse gas pollution, the global average temperature will increase another 2.0 degrees Fahrenheit by 2100.(2) Even if the temperature change is at the small end of the predictions, the alterations to the climate are expected to be serious: more intense storms, more pronounced droughts, and coastal areas more severely eroded by rising seas. At the high end of the predictions, the world could face abrupt, catastrophic, and irreversible consequences.(2)
The last four complete years of the Mauna Loa CO2 record plus the current year are outlined in Figure 22-3. Data are reported as a dry air mole fraction defined as the number of molecules of carbon dioxide divided by the number of all molecules in the air, including CO2 itself, after water vapor has been removed. The mole fraction is expressed as parts per million (ppm). Example: 0.000400 is expressed as 400 ppm.

Figure 22-3. Represents the recent monthly mean of CO2 at Mauna Loa(4)
In Figure 22-3, the dashed line with the most volatility represents the monthly mean values, centered on the middle of each month. The smoothed line with the square symbols represents the same, after correction for the average seasonal cycle. The latter is determined as a moving average of seven adjacent seasonal cycles centered on the month to be corrected, except for the first and last three-and-a-half years of the record, where the seasonal cycle has been averaged over the first and last seven years, respectively.
The last year of data is still preliminary, pending recalibrations of reference gases and other quality-control checks. The Mauna Loa data are being obtained at an altitude of 3,400 meters in the northern subtropics, and may not be the same as the globally averaged CO2 concentration at the surface.
It is important to study the data from the Mauna Loa Observatory from 1960 to 2010. The carbon dioxide data measured as the mole fraction in dry air on Mauna Loa constitutes the longest record of direct measurements of CO2 in the atmosphere and is the volatile data on the graph. This work was started by C. David Keeling of the Scripps Institution of Oceanography in March of 1958 at a facility of the National Oceanic and Atmospheric Administration.(3) NOAA started its own CO2 measurements in May of 1974, and they have run in parallel with those made by Scripps since then.(3) The stable line in the center represents the seasonally corrected data.
Data are reported as a dry mole fraction defined as the number of molecules of carbon dioxide divided by the number of molecules of dry air multiplied by one million (ppm). Figure 22-4 shows the rise in parts per million.

Figure 22-4. Atmospheric CO2 at Mauna Loa Observatory from 1960 to 2010, Hawaii(4)
Now review the current increase in global temperatures. The data presented documents the increase in global temperature over the time span of 1890 to the current date (see Figure 22-5). Furthermore, 2009 was tied for the second-warmest year in modern record, according to a new NASA analysis of global surface temperature. The analysis, conducted by the Goddard Institute for Space Studies (GISS) in New York City, also shows that in the Southern Hemisphere, 2009 was the warmest year since modern records began in 1880.(5)

Figure 22-5. Global Land–Ocean Temperature Index(5)
Although 2008 was the coolest year of the decade—due to strong cooling of the tropical Pacific Ocean—2009 saw a return to near-record global temperatures. The past year was only a fraction of a degree cooler than 2005, the warmest year on record, and tied with a cluster of other years—1998, 2002, 2003, 2006, and 2007—as the second-warmest year since record keeping began.(5)
January 2000 to December 2009 was the warmest decade on record. Throughout the last three decades, the GISS surface temperature record shows an upward trenvd of about 0.2°C (0.36°F) per decade. Since 1880, the year that modern scientific instrumentation became available to monitor temperatures precisely, a clear warming trend is present. In total, average global temperatures have increased by about 0.8°C to 1°C (1.44°F to 1.8°F) since 1880 (see Figure 22-6).

Figure 22-6. Global temperature(6)
References
(2) EDF Environmental Defense Fund. http://www.edf.org/climate/basics-global-warming.
(3) http://www.esrl.noaa.gov/gmd/ccgg/trends, referencing C.D. Keeling, R.B. Bacastow, A.E. Bainbridge, C.A. Ekdahl, P.R. Guenther, and L.S. Waterman, “Atmospheric carbon dioxide variations at Mauna Loa Observatory, Hawaii,” Tellus, 28 (1976): 538–551 and K.W. Thoning, P.P. Tans, and W.D. Komhyr, “Atmospheric carbon dioxide at Mauna Loa Observatory 2. Analysis of the NOAA GMCC data, 1974-1985,” Journal of Geophysical Research-Atmospheres, 94 (1989): 8549–8565.
(4) http://www.esrl.noaa.gov/gmd/ccgg/trends.
(5) http://www.nasa.gov/topics/earth/features/temp-analysis-2009.html.