13. Furthering Collaboration with Suppliers (CPFR)
A further enhancement to the supply chain is the concept of Collaborative Planning, Forecasting, and Replenishment (CPFR). The American Production and Inventory Control Society (APICS) defines collaborative planning, forecasting, and replenishment as “a collaboration process whereby supply chain trading partners can jointly plan key supply chain activities from production and delivery of raw materials to production and delivery of final product to end customers.” CPFR is more than a generic description of cooperation among supply chain partners.
Formalized in 1998 by the Voluntary Interindustry Commerce Solutions (VICS) Association, CPFR is an evolving set of best practices that help supply chain partners jointly plan some or all key activities from the production of raw materials to the sale of finished products. Originally designed with retail supply chains in mind, the CPFR standards have been broadened somewhat to encompass lessons learned in other areas, including technology and chemistry. As more firms in different industries implement CPFR, the specific guidelines will undoubtedly continue to evolve.
CPFR is a web-based business tool that combines the knowledge of many trading partners, similar but more advanced than VMI, and is used to coordinate demand forecasting, production and purchase planning, and inventory replenishment functions. The savings seen with CPFR include an improvement in service levels, a corporate goal of 97%-plus, better promotional and seasonally accurate forecasting, increased sales, increased turnover, reduced inventory levels, greater efficiency in receiving inventory, and a fill rate increase from 1% to 4%, and in one case a vendor moved from a 93% to 97% fill rate.
The original CPFR model, introduced in 2001, started with a nine-step process:
1. Develop collaborative planning—This is the front-end agreement with the supplier and retailer, conducted quarterly. This is the first part of a partnership agreement. It is the hardest to accomplish because each of the corporations comes with its own mind-set and culture. Having a mind-set of being better than the competition has no place in CPFR. This all-knowing attitude is easy to spot and difficult to work with. It takes a very special person from both organizations to tie the knot on the agreement. Each must be professional and technical, self-motivated, extroverted, and energetic. Most of all, each must believe in the concept.
2. Create a joint business plan—After the companies agree to enter the partnership, this is the end result of the collaborative arrangements. It is important that each partner understands his role and knows whom to contact within the collaborative arrangement. It is also very important that both retailer and manufacturer have the backing of upper management. It actually is helpful that the owners of the CPFR project give quarterly results to the board throughout the year. This keeps the relevancy and importance of the project in front of upper management.
3. Create the sales forecast—This is to be reviewed weekly or monthly. The forecast is a joint agreement between the retailer and the manufacturer. There are many ways to collaborate on the forecast. One way is to agree to use the same forecasting methodology. The other way is to agree to a list of software vendors that the retailer and the manufacturer can both use. It is also possible to have the programs linked in order to share all exceptions.
4. Identify exceptions—Exceptions can be identified and must be communicated to the partners. The exceptions can vary:
• Item on allocation
• Severe weather patterns
• Price changes
• Item no longer available and to be discontinued
• Giving the discontinued date
• Substitute items
• Plant closing for vacation
• Shutdown time
5. Resolve exceptions—The exceptions are finally resolved through the collaborative information. Some of the resolutions are informational. It is assumed that the partners will act on this information.
6. Create the order forecast—The buyer creates the order and electronically sends it to the supplier. By this time, the order should have the input from the supplier and the retailer so that the level of communicated intelligence in the order is better than the silo approach.
7. Identify exceptions—The exceptions were listed previously.
8. Resolve exceptions—At this level the resolutions to the exceptions have been input into the forecast program.
9. Generate orders—The forecast has been accepted by all the prior steps and the order is sent to the supplier.
The New CPFR Model
The new CPFR Model, introduced in 2004, takes into account eight tasks that incorporate some of the previous nine steps in a revised edition. The new model completes the same functions as the older model but it breaks down the responsibilities. The new system has four activities that are shared between the retailer and the supplier: strategic planning, demand and supply management, execution, and analysis.
Each of these activities is broken into three tasks:
• The Retailers Task—This is the area where the retailer is responsible for performing the tasks. These are the tasks that the retailer can do a better job of than the manufacturer.
• The Collaborative Task—This is the area where both the supplier and the retailer can share their respective knowledge base. The event management and collaborative notifications occur with this task.
• The Manufacturer Task—This is the area where the manufacturer has the responsibility of performing the tasks. Again, these are the tasks that the manufacturer usually can do a better job of, compared to the retailer. Each activity is broken down into two enterprise activities per task. The total number of enterprise activities in the model is 4 (Activities) × 2 (Enterprise Activities) × 3 (Tasks) = 24 Enterprise Activities.
Figure 13-1 shows the four activities and the three collaboration tasks.
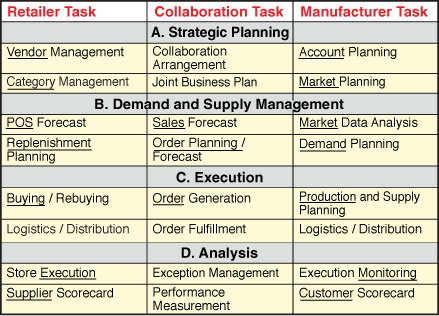
Figure 13-1. The New Collaboration Model shows the relationship between the manufacturer and the retailer.
In the figure, the collaboration tasks appear in the center column; the enterprise tasks appear in the left column (Retailer Task) and right column (Manufacturer Task). This procedure forces cooperation between the retailer and the manufacturer. They have visibility into each other’s demand chain. The four activities are broken into three tasks: Retailer Task, Collaboration Task, and Manufacturer Task. This gives 12 categories of tasks or action.
Strategic Planning Activity
In the Strategic Planning activity, the plan identifies significant events such as vendor promotions, retail promotions, special events, natural disasters, store grand openings and closings, competitive analysis, and new item product introductions.
Under the Retailer Task there are two activities:
• Vendor Management—This part of the strategic planning uses a macro concept of working with all the vendors, managing all details and communications with the suppliers.
• Category Management—This is the determination of how the retailer will display the supplier’s merchandise, what the racking is, and what product groupings will be shown.
The center category, Collaboration Task, is the collaborative joint business plan. This utilizes the vendor and retailer partnership agreements. There are two Collaboration Task activities:
• Collaboration arrangement—This is the agreement between the supplier and retailer explaining how they intend to share the collaborative responsibility.
• Joint business plan—This spells out the intended goals and how both parties intend to meet them.
The Manufacturer Task involves two activities:
• Account Planning—This is the macro concept of how to plan and collaborate with all the retailers.
• Market Planning—This is the responsibility of the manufacturer. The manufacturer has the global view of all promotions and sales. They are in an excellent position to collaborate with the retailer on the revenue potential of certain categories of products.
Demand and Supply Management Activity
In the Demand and Supply Management activity, the manufacturer receives the point-of-sale demand from the retailer’s stores. This is a very difficult task because of the nuances in the different retailers’ cash register systems. There are three available techniques for retailer demand. The first technique is the point-of-sale system. The second is called member purchase history. The retailer demand is taken from invoices of previous purchases (note: these are purchases and not sales; however, there are some analytical benefits obtained by comparing the use of both). The third technique involves giving the manufacturer the usage file and certain item file fields.
The promotional forecast in EDI 830 documentation can also be passed along. In the distributor model, the manufacturer ships to the warehouse and the distributor then reships products to the retailer. Usage and certain regular item fields from the item file can be shared through the EDI transaction set 852. In choosing to use the distributor model, it is imperative to watch out for out-of-stocks.
The Retailer Task is broken into two activities:
• POS Forecast—It is the retailer’s responsibility to prepare point-of-sale data, demand history, or the EDI document 852 and 830 for the manufacturer. Providing this documentation allows the manufacturer to plan the Manufacturing Requirements Planning (MRP) more effectively. The MRP program plans when to start production and in what quantities in order to match the ship date for purchase orders. The retailer can also notify the manufacturer of any special promotions they are planning and at what price.
• Replenishment Planning—This involves the actual summation of the POS forecast where the retailer sets the schedule and quantities of all the items needing replenished and assigns the ship dates to the purchase orders.
The Collaborative Task is broken into two activities:
• Sales Forecast—This represents the actual sales forecast developed by the collaborative effort between retailer and manufacturer.
• Order Planning Forecast—This is the actual planning of how to deliver the forecast to the retailer. It denotes the time schedule as well as the delivery schedule.
The Manufacturer Task is broken into two activities:
• Market Data Analysis—The vendor is in a unique position to see the effects of price changing in different areas globally and so can project the promotional lift of the price to elasticity-to-demand ratio changes. For instance, a price drop of 10% may increase sales by 30% that week. The manufacturer sees this from their customers, which allows them to assist in the planning process by using Demand Data Analysis.
• Demand Planning—The manufacturer analyzes market data and applies the unique events to each retail opportunity. In this phase, the Market Data Analysis is transformed into actual quantitative numbers called Demand Planning. The manufacturer can also receive the data from the POS information from the retailer. The data is only one week old and can be used for forecasting the next week’s sales. The manufacturer will use the data to see whether there are any changes in the region or sale cycles. The supplier can see information right down to the retailers’ shelves and anticipate increasing or decreasing inventory based on sales results. They can also spot instances in which the retailer is buying too much inventory in anticipation of a coming event.
This acts as a warning signal to the supplier to slow their production system down because the inventory-to-sales ratio of the retailer is becoming excessively higher. This helps the supplier become more proactive to the needs of the customer. Without this information, the supplier would continue to stock extra inventory based on past buying habits.
In the normal demand-driven system, the distributor would order every three to four weeks. Only then would the manufacturer receive the order quantity. If the distributor’s inventory was high, they would need to delay their ordering by an additional one to four weeks or more. The distributor would then place the order at a later time.
The supplier works under the feast-or-famine modus operandi. After an order is received by the distributor, the retailer may have lowered the price of selected items. This may cause a run on these products. At this time, the warehouse or distributor would be placing an order much higher than usual. This is known as pent-up demand from the manufacturer’s side or the feast side of the feast-or-famine equation. Collaboration minimizes the potential for the bullwhip effect.
The bullwhip effect was coined by Wal-Mart and P&G when they were working on VMI programs. The distributor or supplier can measure the relationship between the retailers’ on-hand and its relative demand. If the retailer’s inventory begins to grow, the supplier and distributor can be alerted to slow down on potential purchase orders. This is one of the reasons for major overstocks for promotions, because the distributor or supplier will still build inventory in lieu of the promotion in anticipation of larger demand.
The inventory-to-demand ratio denotes whether and when an increase in sales is materializing. Another important collaborative demand planning function is that the manufacturer communicates all plant shutdowns and vacation shutdowns to the retailers. The supplier would automatically add stock to the retailer’s order just prior to the supplier’s vacation shutdown. This issue gets ignored by many retailers and they wonder why their out-of-stocks go up in the summer.
Discontinued items and their last dates of ordering should be communicated. This is another thorny issue that leaves retailers wondering why they have outs on certain items, and later they discover that the items have been discontinued. The supplier should give an automatic issue of any substitute items available.
There is some difference between the supplier and the retailer in purchasing responsibilities. The manufacturer conducts demand planning, whereas the retailer undertakes replenishment planning. In many cases the demand planning is conducted with various sophisticated forecast models including SAP, Oracle, IBM, JDA, I2 (now part of JDA), Demand Solutions, and American Software.
Execution Activity
The Execution activity is also known as the “order-to-cash cycle.” It is the plan to deliver goods to the retailer at the right time, at the right place, with the right quantity, and at the least cost.
The Retailer Task is broken into two activities:
• Buying/Rebuying—This is the actual placing of orders based on the algorithms in the system. After the orders are placed, they are electronically sent to the vendor or supplier. The orders are placed after all the collaborative efforts have been finalized. This activity also covers making payment or order payment.
• Logistics and Distribution—This is the shipping from the supplier to the receiving dock of the retailer. This represents the true transportation lead time.
The Manufacturer Task is broken into two activities:
• Production and Supply Planning—This is why the previous information is so important. For the supplier to do an excellent job in the MRP system, it needs to have excellent system visibility. Production and supply planning involves the production plan that matches the ship date given by the retailer in the retailer’s buying and rebuying phase to the actual shipment delivery dates.
• Logistics and Distribution—This is scheduling and delivering the merchandise to match the retailer’s delivery schedule.
The Collaborative Task involves two activities:
• Order Generation—This is the execution part of the supply chain. This function involves getting the orders to the plant door.
• Order Fulfillment—This involves getting the products from the plant to the retailer. This involves the logistic departments for both the manufacturer and the retailer.
Analysis Activity
The Analysis activity for the supply chain partners monitors planning and execution activities to identify exceptions. This is the quintessential continuous improvement activity. Analyzing execution highlights how a company can improve each step in the supply chain process. The partners also compile the results and calculate key metrics and the KPIs. This information is used to share insights and adjust plans as part of continuous improvement.
The Retailer Task is broken into two activities:
• Store Execution—The retailer or distributor receives and stocks the merchandise.
• Supplier Scoreboard—This measures the supplier’s performance to the KPIs developed jointly with the supplier. Often, the manufacturer with the highest metrics receives the outstanding manufacturer of the year award. This definitely adds an incentive for the manufacturer to work more closely with the retailer because it’s all about the retailer’s reputation.
The Collaborative Task is broken into two activities:
• Exception Management—This involves execution monitoring by the manufacturer and the retailer. The objective is to identify the outlines that did not perform to the business plan. After the exceptions are identified, both parties identify any improvements. It is almost considered a living system because it’s constantly growing and changing to the continuous improvement initiative.
• Performance Assessment—Manufacturers and retailers keep scorecards to assess each other’s performance. The common performance metrics (KPI) are gross margin percent, return on investment and sales growth, in-stock percent at point-of-sale, inventory turnover, inventory level, sales forecast accuracy, potential sales lost due to stock-out, manufacturing cycle time, order cycle time, shipping cycle time, problem resolution time, rate of emergency or canceled orders, percent shipped or delivered on time, and mean number of back orders and timing of back orders.
The Manufacturer Task involves two activities:
• Execution Monitoring—The execution monitoring is the analysis of how well the supplier and retailer performed in the partnership. What are the pressure points in the system and what is causing the company pain? Perform a value stream mapping to see how much value was added and compare this to the previous plan.
• Customer Scorecard—This is the manufacturer’s scorecard of how well the retailer performed when measured against the other retailers the manufacturer is partnering with. Many times this can be published in trade magazines as the outstanding customer award of the year. This definitely adds an incentive for the retailer to work more closely with the manufacturer. It is all about reputation.
Here is a summary of the metrics that can be used in CPFR which are very important in measuring the retailer’s performance and the execution performance of the manufacturer:
• ![]() .
.
• Sales growth:
• ![]()
• ![]()
• ![]()
• ![]()
• ![]()
and C can represent the cost or revenue dollar for each line sold.
• ![]()
• Days of supply = (average value of inventory) / ((cost of goods sold) / 365)).
• GMROI (Gross Margin Return on Investment) = net profit margin × inventory turns.
• ![]()
This assumes forecasting once a month for the vendor, and the percent is calculated for one year.
• Manufacturing cycle time = the total amount of time the manufacturer takes to complete the PO. It is measured from the receipt of the purchase order until the product leaves the plant.
• Transportation time = the amount of time the product takes to be picked up at the plant until it is received by the retailer.
• Receipt to stock time = the time the product is received until it is put away to stock and registered in on-hand inventory.
• Total lead time = manufacturing cycle time + transportation time + receipt to stock time. This is the metric to minimize. Note that it is a metric which is composed of the manufacturers, shipper, and retailer. To minimize, the collaborative presence of all three is necessary.
• ![]()
• ![]()
• ![]()
• Number of back orders by vendor per year.
• Percent of back orders per vendor per year.
• Average length of time to complete the back order per vendor per year.
• Suppliers chosen for cost and quality.
• Product design that strives for maximum performance and minimal cost.
Installing VMI and other collaborative technologies minimizes the effect of CPFR because the inefficiencies are removed from the system. There is definitely an added value to installing CPFR, which is seen in the Lean and Green Savings.
Lean Savings of CPFR
• The service levels increase due to better demand management planning in promotions and also in new item introduction. The higher service level allows for a .5% increase in sales from $943,720,533 × 1.005 to $948,439,136.
• This is an increase of $4,718,603 in sales. This increases the profit by 18% × $4,718,603 = $849,348.
• Inventory levels decreased by 3% in the 3PL program. This results in an inventory reduction of $156,628,357 × .03 = $4,698,851. The new inventory level is at $151,929,506.
• A 2% increase in sales occurs because of the added collaboration between manufacturer and distributor. This further increases the sales from $948,439,136 to $967,407,918.38. This is a sales increase of $18,968,78, which adds an additional $18,968,783 × 18% = $3,414,380 profit to the company.
• The new turns are $967,407,918 / $151,929,506 = 6.37.
• The lower cost of transportation is a result of the collaborative effort between supplier and buyer. The reduction is 1.5%, which allowed for a drop in transportation costs by 1.5% because of better rates. The norm is 6,766,667 gallons per year × $3.12 per gallon = $10,608,000. A savings of 1.5% = $159,120.
• The carrying cost savings is .266 × $4,698,851 = $1,221,701.
• Cost of capital freed up on the inventory is 2% × $4,698,851 = $93,977.
• The total Lean Savings is $5,738,526.
Green Savings of CPFR
• Damaged inventory cost represents .75% × = $4,698,851 inventory = $35,241.
• Obsolete inventory cost reduction is 9% × $4,698,851 inventory reduction = $422,896.59.
• The Green Savings of reduced gasoline usage is 1.5% × 6,766,667 gallons per year = 101,500-gallon-per-year reduction in gasoline usage. As in the TMS model, one gallon of gasoline produces 2,778 grams of carbon content in the atmosphere. This is equal to a savings of 101,500 gallons per year × 2,778 grams = 281,967,000 grams of carbon content reduction per year.
• As discovered in the TMS section, CO2 emissions from a gallon of diesel are 2,778 grams × 0.99 × (44 / 12) = 10,084 grams = 10.1 kg/gallon = 22.2 pounds/gallon.
• This is a 101,500-gallon-per-year reduction in gasoline usage × 22.2 pounds/gallon = 2,253,300 pounds of CO2 reduction into the air for the entire fleet per year.
• Reduced wear and tear of the existing highway system:
• As in the TMS model, one five-axle tractor semitrailer has about the same effect on concrete pavement as 9,600 passenger cars.
• Using a similar analogy in the TMS system, the Green Savings is 9 trucks × 9,600 cars × 5 days × 51 weeks = 22,032,000 reduced cars on the road per year.
• The total Green Savings is $458,137.97.
The total Lean and Green Savings is $6,196,663.
Collaborative Transportation Management
One last topic to cover is the use of collaborative technology on transportation. This follows the same VICS initiative. The technology is called Collaborative Transportation Management (CTM). The CTM is actually building the same relationships built with CPFR but now extending this all the way through the transportation area.
The CPFR ends on order confirmation. The order has been sent and confirmed. The CTM phase continues through the delivery and includes all freight payments. The next paragraph illustrates the performance initiatives.(1) These pilot projects have demonstrated that the benefits of CTM are very real and substantial. Shippers and receivers have documented gains such as these:(2)
• On-time service improvements of 35%
• Lead-time reductions of more than 75% (for example, average lead time for one customer was reduced from 7 days to 1.5 days)
• Inventory reductions of 50%
• Sales improvements of 23% through improved service to customers
• Premium freight cost reductions of greater than 20%
• Administrative cost reductions of 20%
Carriers have recorded equally dramatic benefits from CTM pilot projects, including these:
• Deadhead mile reductions of 15%
• Dwell time reductions of 15%
• Fleet utilization improvements of 33%
• Driver turnover reductions of 15%
References
(1) http://www.VICS.org.
(2) http://www.idii.com/wp/ctm.pdf or White Paper Version 1.0, developed by the CTM Sub-Committee of the VICS Logistics Committee, April 6, 2004.