
2. Warehouse Management System (WMS)
Warehouse management is part of Supply Chain Management and Demand Management. Supply Chain Management (SCM) is composed of two parts: Supply Chain Planning (SCP) and Supply Chain Execution (SCE). The Warehouse Management System, or WMS, is part of the SCE strategy. The execution portion of the supply chain is definitely action-oriented. Even production management is, to a great extent, dependent on warehouse management. Efficient warehouse management gives a cutting edge to a retailer or distributor. Warehouse management does not start with receipt of material. It starts with the initial planning of the container design made for a product. Warehouse design and process design within the warehouse are also part of warehouse management. Warehouse management is part of logistics and SCM.
A WMS is a key part of the supply chain and primarily aims to control the movement and storage of materials within a warehouse and process the associated transactions, including shipping, receiving, stocking, and picking. The systems can also optimize the stocking process. The optimization routine is based on real-time information of bin locations in the warehouse and the products to be put away. The system knows the cube of the product and exactly where the closest empty bin will be to place the merchandise.
The optimization programs attempt to minimize the time it takes the workers to stock the product. The system is also cognizant of the picking operations. Because it is more efficient for the picker to place the item in a particular warehouse bin in close proximity, the system navigates through the alternative locations to find the optimum bin location. The system also balances both the stocking and the picking operations by choosing product placement to minimize the time for the overall warehouse operation.
The WMS provides a computerized schedule to guide employees through their daily tasks by setting up the procedures and times for each operation performance. The system can be automated to notify suppliers electronically if product is being returned and get the authorization number e-mailed back for proper identification. It can perform the initial dialog with the Transportation Management System (TMS) to set up communication with the carriers. It won’t perform the logistic functions but can notify carriers when the product will be ready to be picked up. This enhances efficiency through collaboration of both the WMS and the TMS systems. The WMS should be integrated with other systems as discussed in the next section.
System Integration with the WMS
The WMS can capture data for the ERP system. It can track employee performance, allowing managers to plan which operations the worker performs best, enabling assignments by performance ratings. This is invaluable when using an incentive system and capturing the times below the goal.
The WMS system should be linked to the Inventory Management System so that product movement is immediately visible to the ordering system. The closer the operation is to real time, the lower the inventory. Any percentage reduction of lead time has an equal reduction in average inventory. This helps in demand planning through balancing demand with real-time inventory availability. The WMS is also connected throughout the ERP system to the Accounting and Controls area of the company, allowing for a more accurate evaluation of the warehouse assets. The WMS system should be set up to communicate to the IT system with a seamless approach, synchronizing files from the WMS system to the ERP or legacy file structure.
The Functionality of the WMS
When selecting a WMS computer system, find a solution that will address as many of the following areas as possible.
Order Fulfillment—This is the process of completing the entire order transaction, including the order query, the quote, the purchase order generation, the delivery notification, and the receipt and invoicing of the purchase order. The WMS speeds up the process of receipts and picking the merchandise for the order fulfillment function.
Inventory Management—The WMS system can aid in cycle counting regardless of the type of inventory system. The faster the inventory input, the lower the receiving time. As lead times decrease, the need for extra safety stocks decreases and the more accurate the inventory count is.
Web-Based Platform—The system should have the option of a web-based program for connectivity anywhere in the company. This makes the new paradigm accessible anywhere and anytime.
Warehouse Productivity—How efficient are employee schedules? What is the best schedule to use to minimize the distance traveled by the worker? What is the optimum location needed for the system to minimize the cost of receiving and picking? This is the ABC location analysis, in which the merchandise needed the most is placed in the middle of the bin for faster picking or receiving.
Shelf Life Monitoring—The WMS can track shelf life. This is important in the stock rotation and filling orders in a FIFO (first in, first out) environment by minimizing spoilage of perishable products.
Transportation Performance—The WMS must communicate with the Transportation Management System. If the schedule is expedited, the transportation process can be enhanced. The WMS measures what TMS issues are affecting warehouse performance.
Scalability and Configurability—The system should be scaled so that it can grow easily with any future enhancement. This assumes that the system will work well in a plug-and-play environment with other software.
Receive Stock and Returns/Reverse Logistics—The system should maximize the process of receiving by creating the best schedule for labor to match incoming freight. It can match worker times and efficiency to the different types of vendors. The WMS system can facilitate a reverse logistics function. If done correctly, it will minimize the cost of the least productive part of the warehouse system. Companies can see a 10% annual savings in logistics: 20% through labor cost savings and 80% in lowered freight costs and reduced pipeline inventory.(1)
Manage Storage Facilities—The WMS can model the warehouse into multiple locations based on the best use of cube and worker productivity. This is the process of designing the warehouse and partitioning it into multiple areas such as slow pick, fast pick, heavy bulk, over stock, zone picking and receiving, mezzanine levels, and so on. The system can allow for random storage or manual storage.
Manage Stock—A simulation package can be used to minimize time and maximize employee performance by placing the goods in better locations so that they can be picked at a faster pace. Placing faster moving items in the middle of the bins or at the front of each racking location minimizes the worker’s horizontal or vertical travel.
Provide Connectivity to the Enterprise—With the advent of ERP systems, the WMS system can give notification of delivery to all the departments. For instance, customer service departments need to know when an item is received. The WMS will notify customer service immediately upon receipt of the ASN. The customer support staff then notifies the customer and schedules receipt or delivery.
The WMS allows the following warehouse productivity techniques to be computerized:
Cross Docking—Cross docking is a practice in logistics of unloading materials from an incoming semitrailer truck or rail car and loading these materials directly into outbound trucks, trailers, or rail cars, with little or no storage in between. This practice can reduce overall cost of pick-to-stock and pick-to-order by 15% to 21% by eliminating unnecessary movement from receiving to stock and then back to the shipping door.
Postponement—A postponement strategy aims at delaying some supply chain activities until customer demand is revealed in order to maintain both low systemwide cost and fast response. The driving force of postponement is waiting on manufacturing, packaging, or labeling until product is needed by the customer. This is a great definition of the pull system in Lean terminology. Don’t stock it until it is needed. Inventory cost is reduced and the variety of end products to the customer is increased. This process also helps to increase service levels because the interchangeable parts are stocked with a higher level of safety stock. From these parts comes the final product. Postponement cuts the total cost to delivery to the customer by 5%.(2)
Work Planning—This process organizes and coordinates the activities of an enterprise in accordance with certain policies and in achievement of clearly defined objectives. The system will plan the incoming shipments against standardized worker times to generate a schedule that uses the fewest resources. Management will be included in the decision making of production schedules, along with machines, materials, and cost.
Order Processing—This is the ability to process the order from the customer accurately and in a timely manner.
Tracking Material Flow—This involves setting metrics to analyze labor hour’s efficiencies and standards. Logistics → Logistics Execution → Information System → Warehouse → Standard Analyses → Material Flow. By tracking material flow in the warehouse, labor costs can be cut by 20% to 40%. Management can spot the bottleneck and act immediately.
Metrics Used in a WMS
The WMS system uses several metrics to improve the order fulfillment. These are critical because the customer sees these metrics and evaluates performance based on these figures.
• Order Fill Rate—This is the average fill rate per order.
• Line Fill Rate—This is the average of all the items shipped to the items ordered. This is the average service level the customer receives and is the best indication of how quickly the customer receives the order. The service level has the normal standard distribution. The line fill rate is the center of the probability distribution of line fill rate. The normal complaints are at the left end of the curve. For instance, 50% of the customers have a service level of 97% if this is the normal line fill rate. Table 2-1 illustrates the spread of service levels when all is going well. For instance, when the service level is 97%, then 5.57% of the membership is at a service level between 90 and 97%. To be exact .76% of customers are at a 90% service level. This is why companies cannot afford to turn a blind eye on customer complaints about service. The last example shows that .76% of the customers will have a service level of 80% or 20% out of stocks. The table assumes that the cumulative probability distribution set at .5, with a mean of .97, and the standard deviation of .5.
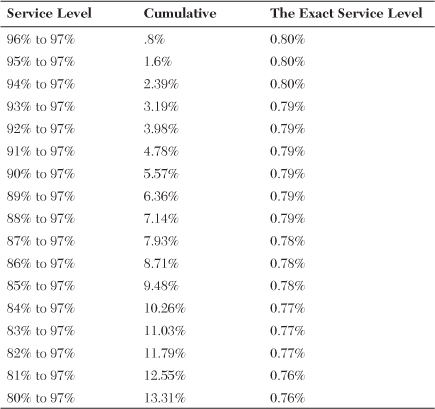
Table 2-1. Percentage of Customers at Specified Service Levels
• Dollar Fill Rate—This is the average of the entire dollars shipped to the dollars ordered. The indicator shows how much revenue is lost. This figure is usually lower than the line fill rate.
• Order Accuracy—This is the accuracy with which the picker picks the order to be delivered to the customer. Did the warehouse employee fill the wrong order? This is where the RF process and the WMS work well together. This combination makes it much harder to make mistakes.
• Line Accuracy—This is the accuracy of the specific SKUs in the order. Are all lines filled? Is the right product being filled?
• Orders Cycle Time—This is the time between orders. This is scheduled by the WMS to maximize the productivity of the employees.
• Number of Back Orders—This is a great metric of how well a vendor is doing in filling the order, which can cause higher outs. One of the metrics can measure the time it takes to fill an entire order, including all back orders.
• Calculated Vendor Lead Time—This is where the computer calculates the vendor lead times based on all back orders and their respective times. For example, let’s say the vendor had three back orders. The first order was shipped in 15 days and was 60% complete. The second back order was shipped in 20 days and shipped 30% of the order. The last back order was shipped in 30 days and shipped the remaining 10% of the order. The new calculated vendor lead time for that distribution center is:
The first order weight value is 1, and it is assumed that this would be the proper lead time to use if there were no back orders. This increased lead time can be input into the system to allow for greater stock or more safety stock.
• Back Order Time to Completion—This is the total time of completion. In the preceding illustration the time would be 30 days.
• On-Time Delivery—This is usually the metric that is used to show the number of times per year the vendor shipped on time. It can also show the spread of the variance around the designated ship date.
• Vendor Lead Time—This is the normal standardized time for the vendor. The vendor lead time is calculated as Total Lead Time − Receiving to Stock Time − Transit Time.
• Individual Item Lead Time—This is the calculated average item lead time. This may not be near the vendor lead time or calculated vendor lead time of the product. In vendor negotiations, it is essential to run a vendor report and show which items have an item lead time significantly greater than the vendor lead time.
Improve Inventory Management
Improve Inventory Management is one of the greatest advances in the WMS. Service levels and turns significantly improve shortly after the WMS is introduced.
• Inventory Accuracy—This is needed when computing the perpetual inventory cycle counting system. The WMS increases accuracy in quarterly sample checks of inventory and in complete inventory counts.
• Days on Hand—This can be calculated using the WMS.
• Storage Utilization—The WMS calculates the spatial efficiency by cube in the warehouse.
• Dock to Stock Time—This is the time it takes to enter the item into inventory after receipt.
• Inventory Visibility—This can be accommodated by a real-time dashboard that shows warehouse movement and congestion. The product placement and inventory dollars can be illustrated on a CAD/CAM diagram of the warehouse.
• Simulations for Decision Making—The WMS can visually show the results of changes in the procedure and recommend a future course of action.
• Inventory Turns by Warehouse—This is an excellent metric in which to gauge the warehouse productivity. The productivity could be within the Distribution Center or it could be a function of the routing issues into the warehouse.
• Inventory Turns by Warehouse Section—The metric shows the difference in stocking levels for different sections or departments.
The Improved Warehouse Worker Productivity
The Improved Warehouse Worker Productivity can be measured with these key performance indicators:
• Orders picked per hour per worker
• Order stocked per hour per worker
• Lines picked per hour per worker
• Lines stocked per hour per worker
• Comparison of warehouse location costs
• Cost per order
• Demurrage cost by carrier
• Productivity improvement
• Comparison to standard for incentive pay by worker
• Cost as percentage of sales
Improved Transportation Performance
The WMS can also help to show the Improved Transportation Performance. This is an important metric because the transportation process is one of the more expensive segments of the supply chain. The WMS will show all the TMS key performance indicators as related to the distribution center.
• On-time deliveries
• Demurrage cost percentage
• Damage
• Missed appointments percentage
• Freight bill accuracy
• Cost per order
• Delivery date accuracy
In Management by Walking Around, problems with employee performance are discovered and potential solutions are discussed with the staff. A typical order picker can walk six miles a day through the warehouse. Order picking constitutes the highest operations cost and time, so increasing productivity through stronger talent-management techniques is a great place to start. Here is a breakdown of costs by percentage in the manufacturing sector:
• Shipping: 20%
• Receiving: 10%
• Storage: 15%
• Order picking: 55%
Order picking can be the most labor-intensive activity in the warehouse, with as much as 75% of time spent in activities related to picking. If the functions of order picking are examined with a process map using value stream mapping, the following will result:
• 10%: searching (which is non-value-added)
• 5%: writing (which is non-value-added)
• 25%: picking (which is value-added)
• 60%: walking (which is non-value-added)
When Value Stream Mapping (VSM) is used, the yield equals a 25% value-added for the picking process. Picking is a large problem for most warehouses. A dynamic scheduling program will help to optimize the efficiencies of the order pickers. A good example of making changes to the productivity of the process is to use the Pareto process.
The largest producer of non-value-added in the picking process is walking. Decreasing walking time by 30% increases efficiency from 25% to 31.25%: 25 / (10 + 5 + 25 + 40) = 31.25%. This represents a 25% increase in the total picking process, which translates to a 25% decrease in labor needs. Existing workers can be reassigned to more productive tasks.
A typical example of a worker receiving orders from the WMS is explained in this paragraph. The WMS offers the employee routing information or the warehouse location and quantity of the next pick. It offers the employee routing information or the warehouse location and quantity of the next pick. The screen can also be used in the receiving process. It tells the worker which trailers are the most important in the overall service-level needs of the company. If the receipt is being cross-docked, it will tell the employee upon receipt of the goods which items need to go to stocking and which items need to go to shipping.
Table 5-1 in Chapter 5, “Savings of B2B E-commerce,” shows that the highest warehouse costs are labor and space. This can be addressed by the WMS. Use of the WMS can produce the following benefits:
• Warehouse labor hours decreased by 40% to 50%, but 50% to 60% with RF. The computer tracks the worker efficiency and flow, matching the worker to the job. The system also picks the shortest distance to travel per worker. Recall that a typical warehouse worker will walk six miles a day in filling orders. Minimizing this will significantly add to labor efficiency.
• Inventory write-off dropped by 5%. This is caused by better real-time tracking of inventory so that merchandise is not lost in the system. The system also monitors shelf life and reduces mis-ships.
• Total inventory dropped by 2.7%. The system allows better and faster tracking of inbound receipts to the stocking area. All overstock locations are minimized, so it does not take as long to split orders into stocking and overstock.
• Shipping errors dropped by 80%, caused by the double-checking of the system with the RF system (discussed in the section later in this chapter, “Radio Frequency (RF) as a Warehouse Management System—An Introduction into RF Systems Used in the Distribution Centers”).
• Space utilization improved by 20% to 30%. WMS is designed to minimize the distance traveled, simulating a smaller distribution center.
• Scrap reduced by 13% to 30%. This is attributed to better real-time visibility of the inventory and process.
• Picking productivity increased by 16% to 25%. This would not be possible without the use of a fully computerized and real-time system measuring against the needed metrics. Also available:
• Optimized picking routes
• Labor standards to match the laborer to the task
• Labor standards to show the need for staffing
• Customer returns reduced by 11% to 25% due to fewer picking errors.
• Cross docking saved 21% in labor cost by minimizing the distance the worker has to travel to fill orders.
WMS Savings:
• The Lean Savings
• Warehouse labor hours dropped by 40%. A warehouse with 600,000 square feet of space would need about 200 workers. Using 125 people with a savings of $18 per hour and benefits of 25%, the total cost is $22.50 per hour. Total savings is 250 days per year × 8 hours × $22.50 × 75 people = $3,375,000 in labor savings per year.
• Inventory reduction of 2.7% of $217 million is $6 million.
• Carrying cost savings of 26.6% × $6 million = $1.60 million.
• Freed-up cost of capital is .02 × $6 million with inventory savings = $120,000.
• Total Lean Savings is $5,095,000.
• The Green Savings
• Improved space utilization of 25% means a warehouse designed with 25% fewer square feet. This is a savings of 600,000 square feet × 25% = 150,000 square feet.
• Value for electric utility bill is .5717 per square foot × 150,000 square feet saved = $85,755 in utilities per year.
• Total savings so far is $5,180,755.
• Company turns are 4.41.
• Sales are $931 million.
• Inventory now is $211 million.
Radio Frequency (RF) as a Warehouse Management System—An Introduction into RF Systems Used in the Distribution Centers
The RF system is used for receiving, storage, and physically counting inventory. As an extension of the WMS, it enhances the physical counting process by entering the counts in the system by the terminal, making the process of warehouse management paperless. Rather than weekly or monthly physical counts, the RF system works on a perpetual inventory cycle. Productivity is increased because inventory tracking does not require warehouse downtime due to physical count requirements. The RF makes the process of entering a number a seamless event and extends the WMS capabilities by enabling and improving the times and error rates for the following functions in distribution:
1. Unloading and staging merchandise on the receiving floor. This is the process of receiving and checking delivery contents against POs. Using an RF hand-held gun works extremely well in this environment. After the product is staged on the receiving floor, it can be moved to the stocking area.
2. Sorting the product occurs after it has been staged. It is sorted out by warehouse location number. This process takes the longest in the receiving process. Employees use the RF device to scan the item and then separate pallets by RF locations. Each pallet will go to a different location in the warehouse based on the WMS instruction. After the pallet is placed in the stocking area, the items will all be stocked in close proximity. They can be license-plated with a bar code telling the computer that the product is on the pallet. Many Warehouse Management Systems mandate the use of the RF process.
3. The RF process also helps facilitate creating the carrier identification file. This file keeps track of all inbound or outbound shipments by carrier.
Track the shipments by scanning the inbound and outbound specifics:
• Get the date of the shipment and store it.
• Record the time of delivery. This allows management to see whether the suppliers are shipping on schedule and abiding by the shipping agreement.
• Track the employee loading or unloading time for performance levels.
4. Reducing paper documentation and permission needed to perform certain tasks. The paper savings can be a great source for minimizing paperwork. Tasks can be accomplished faster without an accompanying paper trail. All the adjust inventory slips and exception slips can be eliminated.
5. Minimizing errors because less time is spent writing the adjustments on a form. The forms could also be scanned and input in the system by the RF or RFID system.
6. Receiving multiple POs at the same time. Depending on the WMS software, the PO and vendor number can be scanned, as well as individual boxes for receipts. In working with certified vendors, the PO, vendor number, and contents are scanned and the PO is taken off the on-order file and added to the item file simultaneously. This assumes that the product is stocked before billing starts.
7. Improving inventory levels. The return on investment can be anywhere from one to three years, after which the warehouse is working with improved technology and lower overhead.
8. Improving time on return goods or reverse logistics. Looking up the item’s bin number or location is no longer required because after it’s scanned the printer at the station can print the location tag to be placed on the item. If an item is damaged, a tag can be printed to throw away or repair. If the item needs to be sent to auction, the appropriate tag is printed.
9. Cross docking notifies the warehouse of out-of-stock merchandise. The item can be received and placed on the customer’s outgoing order from receiving, eliminating the out of stock and the double trips from receiving-to-stock and stock-to-shipping.
The standardized bill of lading is used to ensure that each supplier gives the information in the same sequence. When bills of lading have fields in different positions on the form, it becomes easier to make mistakes. The standardized bill of lading will speed up the receiving process because every form looks the same. The same efficiencies will follow the product through the supply chain, from supplier to carrier to distributor to customer.
The form shown in Figure 2-1 is an illustration of the standardized bill of lading. The form was established by the Voluntary Interindustry Commerce Solutions Association.(3)

Figure 2-1A. The standardized bill of lading (page one)

Figure 2-1B. The standardized bill of lading (page two)

Figure 2-1C. The standardized bill of lading (page three)
The Importance of the Voluntary Interindustry Commerce Solutions Association to the Industry
VICS, the Voluntary Interindustry Commerce Solutions Association, has worked to improve the efficiency and effectiveness of the entire supply chain. VICS pioneered the implementation of a cross-industry standard, Quick Response (QR), that simplified the flow of product and information in the retail industry for retailers and suppliers alike.(3)
A 1996 study by Kurt Salmon Associates showed that companies that implemented VICS’s business replenishment processes had dramatic results: increased sales, faster turns, improved inventory control, and cost savings. Although the results were impressive, VICS continued to develop a new collaborative dimension to supply chain processes: Collaborative Planning, Forecasting, and Replenishment (CPFR®).(3)
By 2001, an AMR research study demonstrated that retailers and suppliers jointly achieved higher sales with double-digit inventory decreases and improved stock at wholesale and on the retail shelf at a lower overall logistics cost. At the same time, Kurt Salmon Associates estimated that “the benefits of CPFR for just the apparel industry alone could conservatively total $8.3 billion annually.”(3) VICS’s committees continue to build their legacy of supply chain excellence through continuous improvement of existing supply chain processes, development of new collaborative commerce business processes, and effective implementation of e-commerce standards.(3)
VICS is composed of the following committees:
• Collaborative Planning Committee
• CPFR Collaborative Planning Forecasting and Replenishment Committee
• Floor Ready Merchandise Committee
• Logistics Committees
• Collaborative Transportation Management (CTM)
• DC Bypass
• Global Logistics Management (GLM)
• Product Image Committee
The Applied RF Analysis: Receiving, Directed Putaway, Stocking, and Order Filling
In receiving, the radio frequency (RF) process starts when merchandise arrives at the distribution center. The merchandise is unloaded and a piece-count is verified. Full pallets of merchandise are labeled with a bar-coded license plate for tracking. The scanner provides the status code for warehouse employees who are putting the merchandise into the stocking locations. The workers will have real-time information on their forklift display as to relevancy and need of the stocking items.
If this is a new item, the scanner scans the bar code from the UPC number. The new SKU number is found and entered into the scanner. This process updates the company’s table for associating UPC numbers with internal numbers. The RF scanner provides a status code that will show the following results:
• Out of Stock—The forklift display shows the workers which purchase orders have the highest percentage of line outs. This can be traced to incoming shipments that have the items marked with their corresponding ASNs. The shipments can be directed to allow the most important shipments to be received first. The worker is empowered with this knowledge first and does not need to seek direction from purchasing for stocking decisions. Many times the forklift driver, rather than purchasing, knows what needs to be stocked to minimize out-of-stocks.
• On Sale—The software tells employees when each sale starts and stops. The purchase orders are rated by the timeline of receipt. If an order is being received just before the sale ends, it is given a higher priority index, which means to restock immediately.
• Central Stock to Send to Other Centers—If an item is received and the system determines that there is too much merchandise in stock, it will scan other warehouses to see whether the item is needed elsewhere. If the merchandise is needed in another warehouse, the system directs the cartons or pallet to be transshipped from the existing center to the new center. This saves the shipment from being stored and then repulled. If the item is received and is at the wrong location, the system sends a notification error indicating that it is in the incorrect distribution center. This saves any errors in receiving and stocking.
• Discontinued Items—If discontinued items are received from the manufacturer, they are redirected to the exception area. Purchasing decides whether to stock the merchandise or return it to the supplier. The message is sent to the buyer as an exception e-mail on the system software instead of a phone call from distribution, saving time for both the distribution and the purchasing centers.
• Replenishment Inventory—Material is expedited to stocking locations based on the status code provided. The license plate is scanned per pallet so that employees know what product is on a pallet and the location of each pallet. Each item, carton, or bag is labeled with the appropriate bin location number.
The second area for the WMS and RF system is the directed putaway. Material is expedited to stocking locations based on the status code. The license plate is scanned per pallet so that employees know what product is on what pallet and the location of each pallet. Each item, carton, or bag is labeled with the appropriate bin location number.
• The RF system tracks all locations within the warehouse.
• The system recognizes all empty overstock locations.
• The RF system searches for a location based on the size and weight of the pallet.
• The scanner displays the exact location of the merchandise.
• When merchandise is received, the RF system will search the warehouse for an empty location.
The third area the WMS and RF system is used is order stocking.
• The item is scanned to check the location number.
• The location is scanned to double-check the location.
• The operator places the material in the location.
• The operator verifies the quantities and keys it into the scanner.
• The receipt file is updated.
• The operator returns to the dock for the next pallet.
• The scanner will determine the sequence of stocking to reduce travel time and distance.
The fourth and final part of the WMS and RF system is the order filling.
• The scanner sequences the locations to be pulled in order by priority and for the shortest distance and time.
• The forklift operator is directed to the location from which overstock is to be pulled via display screen on the scanner.
• Member orders are filled from overstock locations.
• The RF system searches locations to do the following:
• Avoid the need to pick a large quantity from the pick location.
• Combine bin replenishment and order filling with one move.
• Avoid returning partial pallets to overstock.
• Fill orders requiring a full pallet of merchandise.
• Remove partial pallets from overstock, opening locations for the storage of full pallets.
• Sequence the locations to be pulled in the order by priority and for the shortest distance and time using the scanner.
• Direct the driver to the correct shipping door using the scanner.
The Applied RF Metrics Used in the Distribution Centers
The following represents the process improvements with the implementation of RF:
• A 28% increase in units handled per man-hour worked, showing performance and accuracy in order picking
• A 50% increase in efficiency in receiving
• An 18% reduction in cost per unit handled
• Location of each product known
• Picking accuracy of 99.95%
• Improved customer service
The Lean Savings of RF:
• The enhancements of the certification programs and the RF scanning techniques.
• The initial Lean inventory reduction is 2.4% × $211 million inventory = $5 million reduction in inventory.
• The new inventory: $206 million.
• Frees up the cost of capital which is 2% × $5 million, resulting in an inventory savings = $100,000.
• The Lean reduction of carrying cost due to the reduction in inventory. The reduced carrying cost is .266% × $5 million = $1,330,000 in additional savings.
• Damaged inventory represents .75% × $5 million inventory = $37,500.
• Obsolete inventory cost reduction is 9% × inventory reduction = $450,000.
• Combined savings of $487,500 on potentially wasted merchandise.
• Inventory transfer cost of .5% to 1% in wasted movement in the system. It is moving product from one warehouse to another. The Green Savings of moving product from one warehouse to another with an average of 450 miles between the warehouses and the cost per mile for the semi truck is the variable cost of 6 miles per gallon plus wear and tear on the truck: variable cost is $3.12 per gallon × 450 / 6 = $234. The fixed cost (wear and tear) is $0.65 per mile (450 × .65 = $292). One trip has a total cost of $234 + $292 = $526.
• If a company has nine warehouses, at a pace of one trip a month for each truck to each warehouse, the total cost per year is 12 × 9 × $526 = $56,808. This does not include any round-trip costs or the wear and tear on the existing highway infrastructure.
• Total savings for RF is $1,974,308.
The savings after the RF program includes company turns at 4.52, sales at $931 million, and inventory at $206 million. The savings for the RF with a WMS program are Lean Savings of $1,430,000; Green Savings of $544,308; and a total savings of $1,974,308.
References
(1) Minahan, Tim, “Manufacturers take aim at end of supply chain,” Purchasing, April 23, 1998.
(2) http://aisel.aisnet.org/cgi/viewcontent.cgi?article=1087&context=pacis2001&sei-redir=1#search=“Postponement+metrics”.
(3) “P11 VICS Voluntary Guide Lines for the Bill of Lading,” February 2005, http://www.vics.org.