5. Savings of B2B E-commerce
The only growth options in today’s economy are through increased market share and increased internal intelligence. Both options are important, but the business-to-business (B2B) portals emphasize growth through better cash flow and merchandising planning.
Do it Best Corp. uses Microsoft SharePoint to integrate their B2B commerce initiative. A SharePoint is like a Web page. It is easily added to with a message, a link to a Web site, RSS feeds, document files, or a portal to the page. SharePoint can also be used to contact the warehouses and communicate with online blackboards or video communications. Business Intelligence (BI) on SharePoint aids in the incoming communications with the warehouse. Communications that can be utilized with Share Point include the following:
• What messages take priority?
• What are the contents of incoming shipments?
• What are the times of arrivals?
• What reminders need to be sent for meetings?
• What can we use in business intelligence for SQL?
When a portal for a company is being designed, it’s important to add intelligence to the operations and retrieval of data. The data warehouse is considered a one-stop, one-shop approach to the saving and retrieval of data. The additional intelligence will allow for intelligent queries of the data.
The data warehouse is a repository (collection of resources that can be accessed to retrieve information) of an organization’s electronically stored data. It is designed to facilitate reporting and analysis. More simply, a data warehouse is a collection of a large amount of data. This data is called meta data (which stands for massive data), which means a very large amount of data.
This definition of the data warehouse focuses on data storage. The main source of the data needs to be cleaned, transformed, and cataloged and is then made available for use by managers and other business professionals. Management can use the data warehouse for data mining, online analytical processing, demographics, market research, and decision making. Data must be cleansed because it comes from various sources. These sources may store the files as an Excel spreadsheet, used in an Oracle database, or stored in an SQL language, and could be stored in weekly, monthly, or quarterly periods. Data warehousing uses summary data to include business intelligence and queries to transform, load, manage, and display the data in one readable format.
The need for data warehousing comes from the absolute need for a company to differentiate itself from its competition. The only way to do this is to add intelligence into the system that the competition does not have. Information and the ability to intelligently comprehend the solutions will keep companies ahead of the competition.
The B2B initiatives can be set up as a series of portals with trading partners to add value to the supplier, the retailer, and the customer. These portals include the Vendor Portal, the Customer Portal, and the Distribution Portal.
The Vendor Portal
The Automation of the Show Market Bulletin from the Vendor Portal
The Show Market Bulletins are filled out by the manufacturers and sent electronically to the retailer. In the past, the supplier would spend approximately $275,000 in paperwork and $250,000 yearly on postage, and cost the environment 625 trees per year to send the market bulletins to partner companies. Both the supplying and the receiving end increase accuracy while decreasing the amount of internal supply chain staff needed.
If the Show Market Bulletin is filled out based on the previous year’s use, then bulleting can be overlaid from year to year. The only changes the suppliers need to document are the new items for the bulletins for this year and any price and description changes. This saves the vendor time in the sale of bulletin preparation because they only enter what has been changed. In many cases, these changes represent 30% to 50% of the promotions, saving the vendor 50% to 70% of their time.
If the manufacturer has a staff of 10 people working on the project, there is now a savings of at least half the number of employees. If employees make $14 per hour, the internal supply chain stands to save $14 × 1.25 × 40 × 52 × 5 = $182,000 per year in payroll costs. This actually represents a major advance between two or more companies in the supply chain, allowing them to save in both Lean dollars and the Green carbon footprint. This is a perfect example of mutual collaboration benefiting all participants in the supply chain.
The Vendor Portal Used for the Automation of the Show Market Bulletin
• Lean
• The supplier would save $275,000 on paper not used.
• The supplier would save $250,000 on postage not used.
• The supplier would save $182,000 in years on payroll savings.
• Total Lean Savings is $707,000.
• Green
• The show bulletin automation would save 625 trees not cut down per year.
• Total Green Savings is 625 trees not having to be cut per year. Table 4-7 shows that 625 trees converts to 5 yrs. × 13 lbs. of CO2 × 625 = 40,625 pounds of CO2 saved each year in the atmosphere.
• Total Lean and Green Savings is $707,000 plus saving 625 trees per year, yielding 40,625 pounds of CO2 saved each year in the atmosphere.
New Items Portal from the Vendor
This gives the retailer an electronic list of all the new product listings from the manufacturer. The biggest problem with new items is the new item product introduction time. It normally takes 1.5 years for a new item to match its full-capacity sales. Shortening this cycle will increase revenue for the supplier and the retailer. New items sent electronically can be entered into the retailer’s e-catalog three to six months faster. This cuts down on the 1.5-year new product introduction curve to 1 year, representing $30 million dollars in added sales per year. If profit is 18% on sales, the new profit would be $2,400,000 (see Table 5-1).
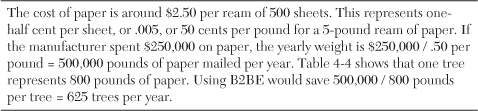
Table 5-1. Savings of B2B E-commerce
The New Items Portal from the Vendor Savings
• Lean
• The added profit would be $2,400,000.
• Total Lean Savings is $2,400,000.
• Green
• No Green Savings from the New Items Portal.
• Total Lean and Green is $2,400,000.
Information on Closeout and Discontinued Items
The vendor portal can be used to advertise for monthly specials or weekly dump-bin promotions. The closeouts are already discounted from the supplier, so the distributor can buy a significant part of the inventory to augment its product line and sell at the regular or discounted price to its retailer. This closeout merchandise can also be used by members needing to boost their sales, add to their profit margin, or increase traffic when the dealer is located near the competition.
Information on Special Events
This keeps the retailer or distributor abreast of any special events or training sessions from the supplier, drawing the retailer closer to the vendor.
Special Prices
Similar to closeouts, this can help the retailer advertise for monthly specials or weekly dump-bin promotions. The specials are already discounted from the supplier, so the distributor can buy a significant part of the inventory to augment its product line and sell at the regular price or discount the price to its retailer.
The Customer Portal
The Customer Portal tracks data better to help the customer and keep product in stock. The following are POS portal programs that can be used by the retailer. As a point of interest, Triad and Activant are leaders in this area. Activant Solutions Inc. is a technology company specializing in business management software solutions, retail solutions, and POS, retail, and wholesale distribution businesses solutions and ERP systems for wholesale distribution. Activant provides customers with tailored proprietary software, professional services, content, supply chain connectivity, and analytics. The company was also the first to provide an electronic catalog to the automotive aftermarket. Activant was formerly known as Triad Systems until it changed its name in 2003.
Lift by Category
A lift is a percentage showing the amount of increase in sales because of a promotion. The distributor can analyze the effects of sales over a very broad area and over many different demographics. With the data evaluated, the distributor can tell the retailer that if they put these items on sale they will receive a lift of 40% (which means a 40% increase in sales during the promotion period). This is a valuable tool because the distributor can analyze any of the diverse demographics for differences. It is also a very big help to retailers when planning item selection for sale circulars. The program can generally increase member sales for that category by 10% to 20%.
Variable Pricing
The variable pricing programs show the retailer which items will have the highest increase in sales for each incremental decrease in cost. These items are good candidates for sales and can be positioned around other high-price merchandise.
Lift by Item
Similar to lift by category, this shows which items should be placed in sale circulars.
Lift by Month
This will allow the retailer to plan by month, finding the best months to run promotions.
Price Optimizer
This option allows the retailer to analyze all combinations of the selling price to find the price that will maximize the sales margin of the product. This is different from maximizing the sales. The maximum margin may actually mean selling less in revenue because the profit margin may be set too low.
The Competition’s Sales Choices
This gives the retailer an idea of what works best for the most successful stores in the chain. This is an excellent tool to use when planning to change merchandise selection because the retailer can see which items contribute to increased sales and profits in other stores. The report can be run by region or by similar demographics.
Merchandising Optimizer
The Merchandising Optimizer can show what other members are selling and offer a breakdown Pareto analysis by sales, margin, units, inventory-to-sales ratio, and price elasticity. It is also considered a seasonal optimizer because it starts suggesting changes in price by season, shows what other members are offering for the season, and shows the turns of the items before, during, and after the season.
Other Productivity Enhancements of the Customer Portal
The use of online invoices reduces the amount of paper used. The paper-based mailed invoices cost $250,000 per year in postage. The paper costs $275,000 per year for the paper and print. This does not include the cost of the personnel time for stuffing and sealing the envelopes.
Specifically, $250,000 of paper usage is the same as 625 trees per year. This equates to a savings of $300,000. So we can save $300,000 / $250,000 × 625 = 750 trees per year from the B2B program (refer to Table 5-1). According to Table 4-7, this equals 5 × 13 × 750 = 48,750 pounds of CO2 saved per year in the atmosphere.
An example of online claims saving is the reduction of employees in claims from four full-time to one full-time and one part-time. It also reduces the wait time for claims posted to the requester’s account from 56 days to 24 hours. In the past, the cost of postage for mailing claims was $80,000 compared to the current cost for computer processing. The Green Savings equals 225 trees per year.
The Commodities Catalog used to be printed every two months and then sent to the customer. Now, due to the electronic/digital format, a new item can be immediately introduced to the consumer. The printed Commodity Catalog costs $300,000 in paper. The cost of mailing the catalogs averaged $300,000 yearly. With the technological advances now available, that $600,000 now translates into massive savings both in the budget and for the environment.
The New Product Merchandising Portal allows companies to get the new items in front of the customer in a faster and more complete fashion. Before using the New Product Merchandising Portal, it took approximately 18 months to fully catch up to sales. This caused a rather large inventory problem because the turns would be very low for the first 18 months. Companies averaging 3,000 new items per year hold an average inventory of $450,000 due to the low turns. Using the merchandising portal, those same companies can decrease inventory to $150,000 and keep $300,000 in available capital.
Enhanced visibility of 18% × $370,000 = $66,600 increase in profit. The overall increase in member efficiency for the customer from the B2B program increased member sales by 5% or $100,000,000. The average member margin is 35% so the increase in profit for all the membership is $35,000,000. This grows current customer sales and increases customer retention. This is a supply chain savings that allows the retailer to benefit from the increase of information flow to enhance sales.
Here’s the Lean and Green Savings on the $300,000 reduction in inventory for the company from the New Product Merchandising Portal:
• Lean Savings in opportunity cost is .02 × $300,000 = $6,000.
• Lean Savings on carrying cost is .266 × $300,000 = $79,800.
• Total customer Lean Savings is $35,000,000.
• The Green Savings on damaged inventory cost represents .75% of $300,000 = $2,250.
• The Green Savings on obsolete inventory cost reduction is 9% of $300,000 = $27,000.
• Total Lean and Green is $327,000, and this is not added to the landfill and dump bins.
The Customer Portal gives the following savings:
• Lean
• Show Bulletins sent out = $275,000 in paper not used.
• Show Bulletins sent out = $250,000 on postage not used.
• Claims sent out = $90,000 in paper not used.
• Claims sent out = $80,000 on postage not used.
• Total Lean Savings is $695,000.
• Green
• Show Bulletin savings is 750 trees not cut down per year.
• Using the data from Table 4-7, this equates to 5 × 13 × 750 = 48,750 pounds of CO2 not released in the atmosphere per year.
• Claims savings is 225 trees not cut down per year.
• Using the data from Table 4-7, this equates to 5 × 13 × 225 = 14,625 pounds of CO2 not released in the atmosphere per year.
The Commodities Catalog Savings
• Lean
• Bulletins sent out = $300,000 in paper not used.
• Bulletins sent out = $300,000 on postage not used.
• Total Lean Savings is $600,000.
The New Product Merchandising Portal
• Opportunity Cost Savings is .02 × $300,000 = $6,000.
• Carrying Cost Savings is .266 × $300,000 = $79,800.
• Sales increase experienced by the distributor of $370,000 a year because of the added visibility, and this adds $66,600 to the company’s profit.
• The overall increase in member efficiency from the B2B program has allowed for an increase in member sales by 5% or $100,000,000. This adds $35,000,000 to the bottom line.
• Total Lean from the New Product Merchandising Portal = $35,152,400.
• Total Green from the New Product Merchandising Portal = $29,250.
• Total Green in tree savings from the Customer Portal and Commodity Portal = 1,725 trees saved.
• Using Table 4-7 this equates to 5 × 13 × 1,725 = 112,125 pounds of CO2 not released in the atmosphere per year.
The Operational Savings of the Customer Portal
The maintenance and reports section allows companies to change prices for their products online. They can also change the advertising circulars and descriptions electronically. The program will facilitate other miscellaneous file-maintenance procedures as well.
The maintenance and reports section allows the supplier access to the purchase history for all customers. The customers can also buy direct from the manufacturer with direct delivery to their store of choice without going to the warehouse. These direct purchases are not tracked in the purchase order history file because the orders went directly to the manufacturer. This analysis can help businesses plan inventory purchases throughout the year. With the purchase history, companies can track current demand with that of previous years. The purchase history report can also be used to budget based on historical product demand. Another benefit of the purchase history report is the capability to sort products by warehouse, state, price elasticity, month, highest margin items, suggested selling price, and price optimization point.
The Point of Sale Data Report includes warehouse stock purchases and direct ship merchandise from the manufacturer. Everything sold at the register is represented here by UPC number, stock item number, item description, price item, quantity sold, member number, time and date of the purchase, and promotion or regular stock item. The report will show the highest elasticity to demand with the largest margin. As prices change throughout the year, the system keeps track of the changes and figures the amount sold. The report can aid in determining when to do a promotion and whether everyday low pricing is an option.
The On Order Report electronically tracks orders, shipment information, delivery dates, and payment dates. Companies are better able to monitor cash flow and warehouse storage information with the use of the On Order Report.
Plan-o-grams allow companies to electronically view what other vendors have on pan-o-grams for in-store promotions. Knowing this can help in strategic product placement as well as merchandising by category throughout the store. The plan-o-gram file outlines category items similar to the NHRA (National Hardware Retailer Association) categories. All products have unique codes and subcodes for stocking and inventory.
The Distribution Portal
The distribution portal facilitates the information internally between the warehouses. Dashboards outline the relative efficiencies of each center. They can also show productivity reports so that the manager can visualize when and why each warehouse needs additional staff.
Automation
Automating the customer buying experience is another option for increased internal intelligence. For companies that offer their products at trade shows, the bulletins can be loaded online so that the member can view them with an iPad or a mobile smartphone. By using Shop Savvy, customers can scan the UPC code of the product on display and go immediately to the catalog to get the current price, full description, weight, and so on. They can scan the new Google 2-D code and go to the Web site to get a video of how to use the product. This video will play on their Apple iPhone, Android phone, or other smartphone.
The iPad Used in the Distribution Setting
Mobile technology continues to grow at a rapid rate within companies and school systems. Mobile technology includes computers, smartphones, and iPods. Executives are increasingly learning how to utilize these devices to create an engaged, dynamic connectivity, and a constant learning environment. With the release of the Apple iPod in the spring of 2010, new questions about how mobile devices can support industry have multiplied with implications for content on-the-go devices, e-books, tools for learner engagement, instruments of collaboration, videos of meetings from the CEO to the customers, retail store manager meetings with employees, and industry transformation through innovative ways to use the technology to enhance productivity.
The iPad can be used for additional savings options that increase profit margins. For instance, a company that appears at biyearly conventions can set up booth visits according to purchase history and sales tracking. Seasonal characteristics can be added into the matrix, as well as the item’s sales lift or price elasticity to demand. Orders can be taken and stock overages decreased through digital access to warehousing data.
Bulletins also are offered at better pricing at the convention centers. Show content, pricing, and item information can be downloaded from the vendor portal. Visualization allows companies to see graphically how purchasing options can increase sales. Companies utilizing visualization can download On Hand from point-of-sale data and On Order from purchase history.
The concept of change management can be accelerated by the always-on, always-connected world of digital media devices. Managers can use these devices to visualize scenarios developed for advertising apps, new product introduction apps, marketing apps, target marketing apps, and even personnel appointments in lieu of new sale opportunities. Management can keep personnel updated and informed of meeting data, changes, and scheduling.
Table 4-7 demonstrates the following CO2 savings that equate to 5 × 13 × 625 = 40,625 pounds of CO2 saved in the atmosphere per year. Another way to look at it is that $250,000 of paper use is the equivalent of cutting down 625 trees per year.
The Savings of New Items Using the B2B New Item Portal
There are 3,000 new items introduced per year compared to the 65,000 SKU count. This represents 4.6% of the SKU count per year. If the time of new product introduction is reduced to 1 year from 1.5 years, there is an additional 33% increase in sales of the new items. This assumes that 66% of sales in the old system in one year compared to 100% of sales in the new system. The average increase in new item sales is 33%, which would represent a 33% × 4.6% or 1.5% increase in sales. The Lean Savings is 1.5% × $2 billion = an increase of $30 million dollars in sales. If the profit margin is 18%, the added profit is .18 × $30,000,000 = $2,400,000.
The IT Green Savings
The financial and economic downturn over the past few years has taught the business community the importance of technological advancement. From the beginning, many companies used Lean technologies to minimize the cost of operations through increased effectiveness. Companies that ignore these advances suffer as the competition moves ahead of them.
Borders bookstore had a great future in book sales. The technical and computer section offered a broad selection of books on computer languages and software. As time passed, they gained a large debt load while businesses like Amazon.com advanced through the digital generation toward the e-book, such as the Kindle or Nook. The high debt and shrinking revenue forced them into spending cuts, budget cuts, and store closings. Just as Borders faced closure, the following companies filed for bankruptcy; some recovered and some have closed permanently, and shortly after they went bankrupt.(1)
• The Conseco Inc.—December 18, 2002
• UAL Corp.—December 9, 2002
• WorldCom Inc.—July 21, 2002
• Global Crossing Ltd.—January 28, 2002
• Enron Corp.—February 12, 2001
• Pacific Gas & Electric Co.—April 6, 2001
Green IT
Energy Usage
According to the CDW Report, a typical data center consumes the same amount of energy as 25,000 households per year. Electricity consumption by data centers is about 0.5% of the world production.(2)
Energy use is a central issue for data centers. Power draw for data centers ranges from a few kW for a rack of servers to several tens of mW for large facilities. Some facilities have power densities more than 100 times that of a typical office building.(3) By 2012, the cost of power for the data center is expected to exceed the cost of the original capital investment.(4)
Greenhouse Gas Emissions
In 2007, the entire information and communication technologies or (ICT) sector was estimated to be responsible for roughly 2% of global carbon emissions, with data centers accounting for 14% of the ICT footprint.(5) The U.S. EPA estimates that servers and data centers are responsible for up to 1.5% of the total U.S. electricity consumption for 2007.(6) Given a business-as-usual scenario, greenhouse gas emissions from data centers are projected to more than double from 2007 levels by 2020.(5)
Energy Efficiency
The most commonly used metric to determine the energy efficiency of a data center is power usage effectiveness, or PUE. This simple ratio is the total power entering the data center divided by the power used by the IT equipment:
Power used by support equipment, often referred to as overhead load, mainly consists of cooling systems, power delivery, and other facility infrastructure like lighting. The average data center in the U.S. has a PUE of 2.0,(5) meaning that the facility uses one watt of overhead power for every watt delivered to IT equipment. State-of-the-art data center energy efficiency is estimated to be roughly 1.2.(7)
The IT Green Initiative covers IT savings in detail. The Federal Energy Management Program’s Best Practices Guide for Energy-Efficient Data Center Design offers a complete description of Green Initiative savings.(8) The topics presented are broken down into 13 categories for the Data Center Design:(10)
1. Using efficient servers
2. Saving with the use of rack servers
4. Using on-off power cycler devices
5. Addressing IT system redundancies
6. Sharing other IT resources
7. Using Network Attached Storage
8. Managing active energy measures for network equipment
9. Improving the power supply efficiency
10. Consolidating the hardware location
11. Introducing blade servers
12. Virtualization use of VMware
13. Using Microsoft SharePoint 2010
1. Efficient Servers
In a typical data center with a highly efficient cooling system, IT equipment loads can account for over half of the entire facility’s energy use.(8) The use of efficient or sustainable servers will become a big part of the corporate decision-making process in the future. The use of efficient servers will cut the electrical usage and also decrease the size of the equipment and the room. It may also reduce the number of people needed to run and maintain the IT equipment. The added efficiency reduces the need for power to run the coolant for the IT servers.
2. Rack Servers
Rack servers tend to be the main area of wasted energy and represent the largest portion of the IT energy load in a typical data center. Servers take up most of the space and drive the entire operation. The majority of servers run at or below 20% utilization most of the time, yet still draw full power during the process. Recently, vast improvements in the internal cooling systems and processor devices of servers have been made to minimize this wasted energy.(9)
3. Variable-Speed Fans
When new servers are being purchased, it is recommended to look for products that include variable-speed fans as opposed to standard constant-speed fans for the internal cooling component. With variable-speed fans it is possible to deliver sufficient cooling while running slower, thus consuming less energy. The Energy Star program aids consumers by recognizing high-efficiency servers. Servers that meet Energy Star efficiency requirements will, on average, be 30% more efficient than standard servers.(9)
4. On-Off Power Cycler Devices
Additionally, a throttle-down drive is a device that reduces energy consumption on idle processors so that when a server is running at its typical 20% utilization, it is not drawing full power. This is also sometimes referred to as power management. Server power draw can also be modulated by installing power cycler software in servers.(9)
5. IT System Redundancies
Further energy savings can be achieved by consolidating IT system redundancies. Consider one power supply per server rack instead of providing power supplies for each server. For a given redundancy level, integrated rack-mounted power supplies will operate at a higher load factor (potentially 70%) compared to individual server power supplies (20% to 25%). This increase in power supply load factor vastly improves the power supply efficiency.(9)
6. Sharing of Other IT Resources
Sharing other IT resources such as central processing units (CPU), disk drives, and memory optimizes electrical usage as well. Short-term load shifting combined with throttling resources up and down as demand dictates is another strategy for improving long-term hardware energy efficiency.(9)
7. Storage Device
Consolidating storage drives into a Network Attached Storage or Storage Area Network are two options that take the data that does not need to be readily accessed and transport it offline. Taking superfluous data offline reduces the amount of data in the production environment, as well as all the copies. Consequently, less storage and CPU requirements on the servers are needed, which directly corresponds to lower cooling and power needs in the data center.(9)
For data that cannot be taken offline, it is recommended to upgrade from traditional storage methods to Thin Provisioning. In traditional storage systems an application is allotted a fixed amount of anticipated storage capacity, which often results in poor utilization rates and wasted energy. Thin Provisioning technology, in contrast, is a method of maximizing storage capacity utilization by drawing from a common pool of purchased shared storage on an as-need basis. This also allows for extra physical capacity to be installed at a later date as the data approaches the capacity threshold.(9)
8. Network Equipment
As newer generations of network equipment pack more throughput per unit of power, there are active energy management measures that can also be applied to reduce energy usage as network demand varies. Such measures include idle state logic, gate count optimization, memory access algorithms, and input/output buffer reduction.(9)
9. Power Supplies
Most data center equipment uses internal or rack-mounted alternating current/direct current (AC-DC) power supplies. Historically, a typical rack server’s power supply converted AC power to DC power at efficiencies of around 60% to 70%. Today, through the use of higher-quality components and advanced engineering, it is possible to find power supplies with efficiencies up to 95%. Using higher efficiency power supplies will directly lower a data center’s power bills and indirectly reduce cooling system cost and rack overheating issues. At $0.12/kWh, a savings of $2,000 to $6,000 per year per rack (10 kW to 25 kW, respectively) is possible just from improving the power supply efficiency from 75% to 85%. These savings estimates include estimated secondary savings due to lower uninterruptible power supply (UPS) and cooling system loads.(9)
10. Consolidation: Hardware Location
Lower data center supply fan power and more efficient cooling system performance can be achieved when equipment with similar heat load densities and temperature requirements are grouped together. Isolating equipment by environmental requirements of temperature and humidity allow cooling systems to be controlled to the least energy-intensive set points for each location.
This concept can be expanded to data facilities in general. Consolidating underutilized data center spaces to a centralized location can ease the utilization of data center efficiency measures by condensing the implementation to one location, rather than several locations.(9)
11. Blade Servers
The two technologies that save computer time and cut the cost per operation are Virtualization (which includes blade servers) and Microsoft SharePoint.(9) There are other technological solutions through Oracle and IBM that are similar to SharePoint and Virtualization. Regardless of the technology chosen, significant strides can be made toward Green IT agenda within the IT arena.
12. Virtualization(9)
The concept of Virtualization has gained popularity within the past six years. Virtualization is allowing multiple operations or jobs on a single server. In the past, a multipartition computer hosted each job on a separate partition. Now many jobs run on a single server. In the past, computer idle time could be 75% with low computer utilization. As more jobs are run on the computer, the computer utilization increases. Virtualization will cut the number of servers needed because one can replace many servers. It will also run at lower electrical power because there is better economy to scale. For example, one server with five blades acting as individual servers replaces the previous need for five individual servers. Electrical consumption decreases by 40% because the new server requires less power.(10)
13. Microsoft SharePoint 2010
SharePoint is a tool on a collaborative platform focused on improving end-user productivity. SharePoint includes portals, document management, and records management. It is similar to building a Web page to maintain control of company data. Multiple templates are available to increase user friendliness, and various Web themes allow for different backgrounds to the page. Formatting and text type fonts are easy to use and allow for links to other pages. SharePoint also provides advances in internal communication.
All meetings can be on streaming video over SharePoint from different regions of the United States. All documents and records can be stored with content management and the rules that follow this procedure. Customers can take content from separate disparate systems with others through SharePoint. The end users’ collaboration ability is radically increased. Business Intelligence and Analytics are compatible with SharePoint.
SharePoint also has the platform of services which is composed of the following:
• Sites for Collaboration—Collaboration with suppliers and customers can set companies apart as best-of-breed in the industry. It enhances the velocity of transactions and understanding.
• Communities for Portals—Savings potential is in the double digits.
• Search for More Productivity—SharePoint addresses the need for speed with the Fast Search algorithm, minimizing the search time. SharePoint 2010 Search provides intranet searches, people searches, and a platform to build search-driven applications, all on a single, cost-effective infrastructure.
• Contentment for Content Management—Content Management organizes data so that it can be found and acted on faster. Computer memory doubles yearly so data collection becomes a nebulous task. This is where the content management system helps organize the data for a user-friendly experience.
• Composites for Business Processes—Composites represent the replacement of PCs with bidirectional communication systems. This creates a large number of value solutions. SharePoint provides a workflow analysis engine that pinpoints the inefficient parts of the organization. This includes Visio and visualizing the supply chain. Lean Six-Sigma is also an integral tool in the understanding and dynamics of the business process.
• Insight for Business Intelligence—In many companies the content can grow by 40% to 70% or more per year. Business Intelligence makes sense of the increased data flow and presents to the user what is needed. The Pareto approach attempts to find the 20% and then presents the data to the manager faster.
In the past, using enterprise computing for every problem required multiple applications. Business Intelligence required Cognos or Business Objects. Document management projects required Documentum, Vignette, or Stellent. Unfortunately, these advances were costly and confusing. Using the SharePoint solution eradicates the need for multiple applications and saves 8% to 10% in search capabilities with an 8% savings in workflow analysis.
The next few tables translate VMware and blade technology savings into energy savings. Lean Savings is represented in Table 5-3, which shows how to compute dollar cost from kWh. The Green Savings from the VMware and blade technology is explored in Table 5-4. The table can be used to calculate an average CO2 emission from the different ways of generating electricity. The result is a mean CO2 emission from 1 kWh for the country.

Table 5-2. Calculating Gasoline Usage to Emissions in Pounds of CO2 Emitted into the Atmosphere: Carbon Content in Motor Vehicle Fuels: Calculating CO2 Emissions(10)

Table 5-3. Computing Total Cost of Electricity from the kWh
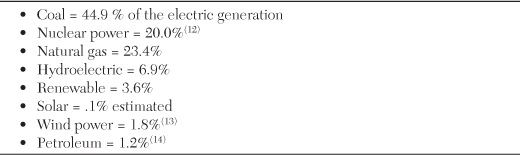
Table 5-4. Using the Cost of Utilities to Calculate the Pounds of CO2 Emitted in the Atmosphere per Year(11)
How much carbon dioxide does 1 kWh create?(13) This is the calculated average amount of CO2 in pounds used in the United States:
• Green Savings is 25% × 24,354,468.68 pounds of CO2 in the atmosphere per year = 6,088,617.17 pounds of carbon dioxide saved per year.
• These numbers are in grams per kWh. The following shows how many grams depending on the method of generating electricity:(15)
• Coal = 800 to 1,050
• Natural gas (combined cycle) = 430 (average)
• Nuclear = 6
• Hydroelectric = 4
• Wood = 1,500 without planting other biomass
• Photovoltaic solar = 60 to 150
• Wind Power = 3 to 22
• Petroleum: 1 pound = 453.6 grams, so 1.969 pounds of CO2(16) is generated by petroleum per kWh. This equals 1.969 pounds × 453.6 grams, or 875 grams.(16) This is used in Table 5-5.
So, using the information in Table 5-4, an average gram per kWh for the United States can be calculated. This averages the electricity generation with the number of grams of CO2 per kWh. Table 5-5 shows the average amount of grams of electricity generated in the United States for one kWh of power.

Table 5-5. The Average Amount of Grams of Electricity Generated in the U.S. for One kWh
The corrected or normalized average is 590.869 / 1.019 = 580. The normalization was required because the percent total came to 1.019. The weighted average is necessary because it represents the blueprint of the entire continental United States. Companies with interests all over the continental United States need an estimate from coast to coast. This average is 580grams/kWh.
Calculate the Enterprise Dollar Cost of the Electrical Utilities
The enterprise cost of utilities per year is $0.5715 × the number of square feet. The average square feet is 450,000 for each of nine warehouses. The corporate square footage is also 400,000. The total square footage is 4,450,000 square feet. The total cost of utilities is equal to 4,450,000 × $0.5715 = $2,543,175 per year.
Calculate the Number of Kilowatt-Hours Used
To calculate the number of kWh used, take the kWh × 12 cents, which equals the cost in dollars. So in seeking the number of kWh used: kWh = Cost / .12 and kWh = $2,543,175/.12 = 21,193,125 kWh.
• Calculate the number of grams of CO2 = 21,193,125 kWh × 580 = 12,292,012,500 grams of CO2 per year.
• 1 gram = 0.00220462262 pounds so the yield of CO2 is 0.00220462262 pounds × 12,292,012,500 grams = 27,099,249 pounds of CO2 in the atmosphere per year.
• The entire company through the electrical grid network emits 27,099,249 pounds of CO2 in the atmosphere per year.
• 40% of the electrical consumption can come from the server network and all the desktop and laptop computers and monitors. The data center accounts for 23% of the electrical usage.
• Cutting the electrical consumption by 20% to 30%, with the given Blade servers and VMware, the average savings will be 25%.
• The Lean Savings of the VMware and Blade Technology:
• 25% of $2,543,175 = $635,793.75.
• The Green Savings of the VMware and Blade Technology:
• 25% of 27,099,249 pounds of CO2 = a reduction in CO2 emissions of 6,774,812 pounds reduction of CO2 in the atmosphere.
References
(1) http://www.dirjournal.com/business-journal/some-major-us-companies-that-went-bankrupt.
(2) http://evanmills.lbl.gov/pubs/pdf/ht_businesscase.pdf.
(3) http://www.energystar.gov/ia/partners/prod_development/downloads/EPA_Datacenter_Report_Congress_Final1.pdf.
(4) http://www.ijcse.com/docs/IJCSE10-01-04-15.pdf.
(5) The Climate Group for the Global e-Sustainability Initiative, “Smart 2020: Enabling the low carbon economy in the information age,” http://www.smart2020.org/_assets/files/03_Smart2020Report_lo_res.pdf. Retrieved 2008-05-11.
(6) U.S. Environmental Protection Agency ENERGY STAR Program, “Report to Congress on Server and Data Center Energy Efficiency,” http://www.energystar.gov/ia/partners/prod_development/downloads/EPA_Datacenter_Report_Congress_Final1.pdf.
(7) Silicon Valley Leadership Group, “Data Center Energy Forecast,”https://microsite.accenture.com/svlgreport/Documents/pdf/SVLG_Report.pdf.
(8) “Best Practices Guide for Energy-Efficient Data Center Design,” http://www1.eere.energy.gov/femp/pdfs/eedatacenterbestpractices.pdf, February 2010.
(9) http://www1.eere.energy.gov/femp/pdfs/eedatacenterbestpractices.pdf.
(10) “Carbon Content in Motor Vehicle Fuels” and “Calculating CO2 emissions,” http://www.epa.gov/oms/climate/420f05001.htm.
(11) http://natpa.org/publications/nuke4.pdf.
(12) http://www.eia.gov/kids/energy.cfm?page=nuclear_home-basics.
(13) http://www.eia.gov/cneaf/electricity/epa/epa_sum.html.
(14) http://www.eia.doe.gov/cneaf/electricity/epm/epm_sum.html.
(15) http://www.eia.gov/tools/faqs/faq.cfm?id=73&t=11.
(16) http://www.eia.doe.gov/cneaf/electricity/page/co2_report/co2report.html.