
25. Case Study: Behavioral Health
This chapter highlights the Lean and Green philosophy by showing the results of the use of a researched methodology, Lean Six Sigma, in the hospital process. The goal is to maximize the value-added process, which inherently adds less waste to the system. The rest of the case study follows the steps of the Lean Six Sigma philosophy to emphasize the profitability and sustainability possible in any company.
Lean Six Sigma is the marriage of two disciplines, Lean and Six Sigma. Lean is the philosophy of the focus on nonvalue activities. This is where the concept of value stream mapping (VSM) comes from. Identify the number of activities that have value and divide by the total process. The total process is composed of activities that have values and activities that do not add directly to the value of the product. These activities are called non-value-added. Create a map of the current processes, identifying the nonvalue activities, and eliminate as many as possible. Then map the activities of the improved model with future processes in mind. The comparison of the value stream mapping of the process and the ratio of value-added should be greater than the VSM of the current process.
Six Sigma is the business management strategy developed by Motorola. It is a philosophy and set of methods companies use to eliminate defects in their products and processes. It seeks to reduce variation in the processes that lead to producing higher inventories or inefficient processes. The introduction of process improvement Six Sigma is now about helping the organization make more money by improving customer value and efficiency. Six Sigma breaks the process improvement effort into five phases, called the DMAIC process: Define, Measure, Analyze, Improve, and Control.
In the Define phase, the problem is identified. This can be very difficult for some companies because problems vary by department. Defining the customer-related issues is a good company-wide starting point. Using value stream mapping will help in determining process goals and delineating a clear problem statement.
In the Measure phase, problems or inaccuracies in the system are measured, defects are defined, and opportunities for improvement are evaluated. During this phase, a process map is developed and data collection procedures begin. Using Pareto charts, histograms, bar charts, and control charts will simplify the introduction of causal relationship strategies.
Analyze is the phase used to quantify what was found in the Measure phase. In this step, define performance objectives, identify value and nonvalue process steps, and determine the root cause of the inefficient process. The Pareto analysis, statistics, ANOVA, and brainstorming techniques can be utilized in this phase.
In the Improve phase, use the preceding steps to determine where to improve the process. Brainstorming, 5S, line balancing or work flow, poka-yoke, and hypothesis testing are excellent methods for completing this analysis.
Control is the last, and perhaps hardest, phase. After the entire plan is developed and implemented, a plan is needed for keeping the process improvement effort in line in the future. If the new environment is too relaxed, it becomes easy to lose focus. Techniques available for maintaining the new status quo include control charts, mistake proofing, process control plans, and training plans.
Case Study of the Six Sigma DMAIC Approach in Health Care
The following case study follows all five phases. This case study in the application of Lean Six Sigma in a hospital measures the efficacy and potential savings of adding Lean Six Sigma into the corporate philosophy. For privacy reasons, the name of the hospital is withheld.
In-Patient Admission
EXECUTIVE SUMMARY
The team was asked to integrate the basic principles of Lean Six Sigma into the in-patient admission process. The team examined the patient admission process from the time of arrival to the time of discharge.
Purpose
The objective of the project was to identify probable variables that are a direct result of slow-speed admissions and customer dissatisfaction. The total average time for patient admission was three hours.
Analysis
Due to the large scale of the projected, limited data collection, and allotted time, the group decided to focus on the process flow. The team discovered that patients were being asked the same questions at one or more points in the communication chain. After examining the process flow, it was concluded that different mediums of communication created a constraint in the flow of information.
Goals
• To achieve a 50% decrease in the amount of time spent on nurse assessment by June 2009
• To increase revenue by increasing the number of patients from 10 to 12 per day
• To decrease patient assessment by 33%
Define Phase
The Behavioral Health hospital is a 24-hour comprehensive mental health program located in Fort Wayne, Indiana, offering specialized inpatient and outpatient services to children, adolescents, adults, and older adults suffering from emotional, behavioral, and chemical dependency problems. The facility opened in August 2000 and currently employs over 200 full- and part-time employees, providing a total of 107 beds, making it the second-largest unit in the hospital family.
The purpose of this project is to provide Behavioral Health Hospital an educational insight concurrent to the methodologies found in the Lean Six Sigma philosophy and to apply that knowledge to Behavioral Health in-/outpatient process flow. The Behavioral Health staff is interested in reducing the cycle time it takes a patient to complete the admission process from entry to exit.
The team’s mission is to look into this data and determine the key input variables that are the root of slow admission processes and determine how to correct or improve on these situations. The mapped process includes five main processes that require the patient to be interviewed and examined by a licensed nurse/physician. These processes include a brief clinical, nurse assessment, social history examination, psychiatric evaluation, genealogy, family history, and physical examination.
Problem Statement
There are four different communication mediums utilized for each admission process: one written, three dictations, and one electronic. Using different mediums has created communication constraints within the process and uses valuable resources to create non-value-added to the process. Often, the same questions are repeated in the five processes, creating frustration for the staff and the patient. The duplication results in inconsistent documentation, wasteful staff resources, and patient dissatisfaction.
The brief clinical is currently processed in written form, whereas the nurse assessment is processed electronically through the hospital’s central computer software. These steps utilize different methods of storing information, which results in data redundancy. The information gathered from the other areas is imaged into their database. Each of these systems offers a means of communication and collaboration but stores data on separate systems. This makes it difficult to access information from one system to the other. The duplication of questions and the inability to transfer answers to questions from one step to the next proves to be a major concern. All the mentioned variables combined result in slow admission speed and patient dissatisfaction.
The process map (see Figure 25-1) illustrates the various steps a patient follows throughout the admission process. In the brief clinical, there are 19 main questions, 12 of which are repeated in nurse assessment. A patient who is already suffering from a mental problem may become more frustrated with recurring questions throughout the process. The Behavioral Health Center is striving for 100% customer satisfaction; however, due to their current system structure, they are unable to meet this goal.
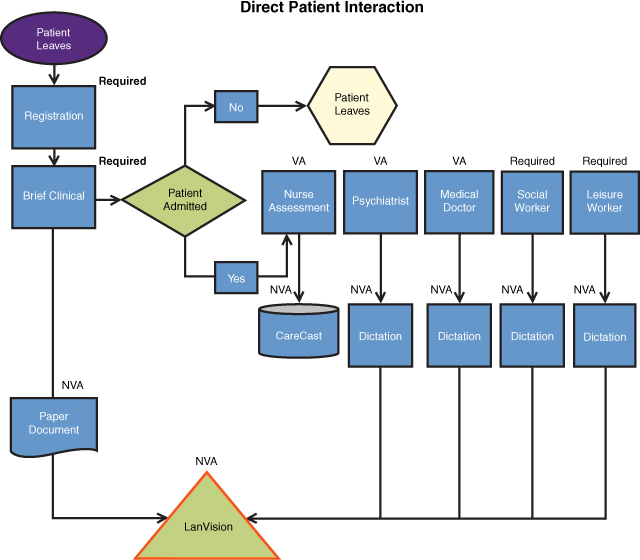
Figure 25-1. Current process flow map
Scope of Analysis
Upon data collection, the team examined each process from the time of patient arrival until the time of discharge. The group focused on the brief clinical questionnaire in comparison to all other processes to determine the number of questions that were repeated in each process. The scope of the project is to eliminate the 15 most time-consuming, duplicate questions from the admission process based on cycle time. A data set has been created to demonstrate how much time can be saved after eliminating the recurring questions.
Purpose
The objective is to examine each process and create alternative opportunities for improving the admission process. This includes identifying internal and external factors that are creating slow admission speed, exploring the channels of communication to improve the process, and eliminating data redundancy. The current time interval for the patients to complete the admission/discharge process is estimated to be three hours. Table 25-1 shows the total amount of time wasted per year, which results in a total cost of $171,250, including 60 minutes of wasted time per patient, resulting in $91,250 in wages for a $25-per-hour salary. The total dictation cost would include the $80,000 salary of $40,000 per year for two employees.
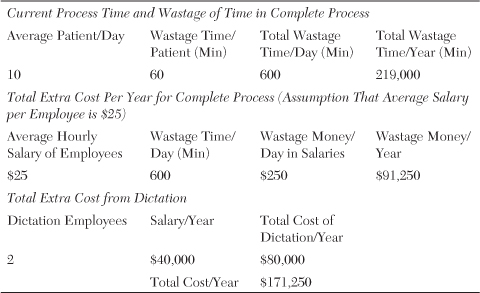
Table 25-1. Cost of Wastage Amount of Time
Goals
• To increase customer/staff satisfaction through elimination of repetitive questions and improvement to the process flow
• To achieve a 50% decrease in the amount of time spent on the nurse assessment by June 2009
• To increase revenue by increasing the number of patients from 10 to 12 per day
• To decrease the amount of time spent for the complete patient assessment process by 33%
Measure Phase
To understand the process, different data and variables collected during the first phase of the project was reviewed. The staff provided the team with their current process flow of inpatients (see Figure 25-1). Due to privacy and confidentiality, the team was unable to physically collect data throughout the five process phases. The staff was able to provide the team with templates for each stage. The total process consisted of six stages; however, the team narrowed the process down to five due to the insignificant value/time the last stage provided.
The team researched each process beginning with the brief clinical. In this portion of the process, an assessor or a nurse performs a written brief clinical to evaluate the patient. Questions focus on better understanding the patient’s chief complaint, presenting problem, and performing a suicide assessment. The average time for a patient to complete a brief clinical was measured at 40 minutes (see Figure 25-2). If assessors believe that the patient is mentally unstable, the patient is moved into the nurse assessment stage.

Figure 25-2. The Behavioral Health Center process flow
In this stage, questions about psychiatric, physical, and overall health of the patient are entered into the computer software CareCast. This process typically takes an average time of 60 minutes per patient. In the third stage, a psychiatrist performs a mental status evaluation of the patient averaging 30 minutes. In the fourth stage, a medical doctor completes a thorough physical evaluation of the patient, which takes an average of 20 minutes to complete. For the final process, a social worker will ask the patient personal information including family history and abuse history. This assessment takes an average of 20 minutes per patient.
During the measure phase, the team decided to focus on the brief clinical as a base foundation for the redundancy of the questions asked throughout all processes. Based on the data gathered, the Dotplot chart illustrates the number of repetitive questions asked throughout the process (X) and the time in seconds (Y) each question takes. The time for each question ranges from 0 to 600 seconds (see Figure 25-3).

Figure 25-3. Dotplot of the current process
The Pareto charts in Figure 25-4 and Figure 25-5 indicate that 50% of the redundant questions make up 80% of the total wasted time. Further examination proves the initial findings. It is important to understand that the Pareto chart in terms of “time” is more important than the Pareto chart in terms of “redundancy” because, although a question may be asked several times throughout the process, the question may take only a few seconds to answer and will not be relevant to reducing time. This can also be viewed in Figure 25-3. Notice that the time, the X axis, is clustered with questions that are less than 200 seconds; however, they become stagnant as time increases.
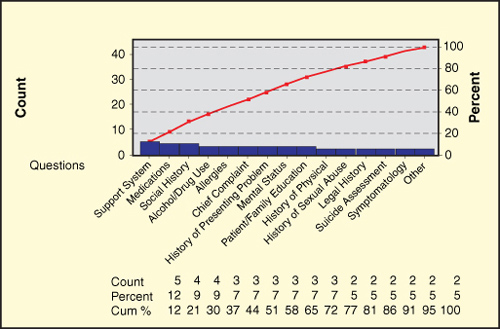
Figure 25-4. Pareto chart on redundancy-based process
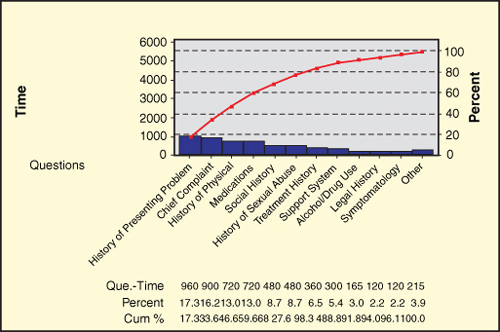
Figure 25-5. Pareto chart on time-based process
Analysis Phase
Given the measure and data provided, the team concluded that 54.08, or 29%, of the questions create wasted time (see Figure 25-6) due to redundancy of data and based on the amount of time each question takes. This was calculated by taking 15 questions from the brief clinical and comparing each question to the questions asked in the processes of social history, psychiatric evaluation, history and physical, and nurse assessment, and selecting questions that pertained to a frequency greater than one. Questions that had a frequency level less than one were considered relevant, nonrepetitive questions.

Figure 25-6. Complete process time
Although many of the frequencies were greater than one, the team examined each question and concluded that some of the questions measured took longer in patient assessment. There may be extreme variations depending on the patient; however, the mean concluded an approximate time for each question to complete. An analysis measured each process and determined the length of each repetitive question, measuring how long each question takes for each process. The findings concluded that recurring questions that took greater than 100 seconds to answer made up 80% of the total wasted time and should be looked at first.
Although the team focused on question redundancy, a closer look at the fish-bone diagram (see Figure 25-7) reveals several factors that may create cause and effect for slow admission speed and customer dissatisfaction. After sitting through several meetings with the staff, the team found lack of collaboration among the doctors and the hospital staff. This may be due, in part, to employee enforcement by management. Many of the doctors are reluctant to use the software provided, either because they don’t think it is user-friendly or because they lack the patience to use the new technology tools available. The nurses feel that due to the nature of the patient’s state of mind, it would be inappropriate to interview the patients while recording data on the computer. The staff argues that loss of eye contact through the use of computers during interviews detracts from their ability to build trust with the patient. Also, the hospital has certain state and government policies to follow that prohibit the staff from following a uniform process flow.
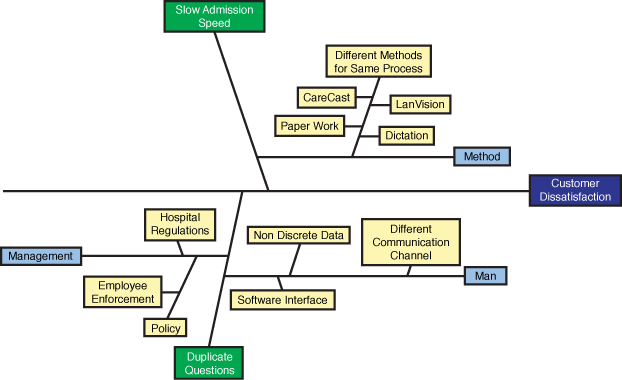
Figure 25-7. Cause-effect diagram, or fish-bone diagram
The major cause of slow admission could be pinpointed at the different methods used for the same process. With several different communication channels, the hospital is unable to flow the process from one stage to the other. It operates on central software but does not utilize this software to its maximum potential. Instead, information is manually written in the brief clinical as opposed to being entered into the system’s software.
The brief clinical is electronically stored into the system database, which is software that stores all the patients’ medical records as images throughout each stage of the admission process. In the second phase, the nurse interviews the patient and inputs the information into the software, which is imaged into the database. It is important to note that the software does not have the capacity of storing information for more than one month. The third and fourth phase involves a contracted psychiatrist and medical doctors who provide their own medical form and dictate the information from each patient. The information is later typed by staff and scanned into the database. This creates many non-value-added processes and redundancy between all processes and uses four means of communication throughout the patient admission process.
Another possible cause for slow admission is the software itself. The software is structured to have data flow from one task to the next; however, the software has some constraints of its own. Comments entered by doctors/staff are considered discrete data and do not allow flow to another task process. If the doctors/staff would like to see the comments made on the nurse assessment, they have to log in to that specific task process.
The selected area in Figure 25-8 should be an area of focus for Behavioral Health. The graph indicates an overall picture of the time in seconds each repetitive question takes to complete. The hospital has the potential to improve its performance by simply eliminating non-value-added data.

Figure 25-8. Individual value plot for current process phases
Improvement Phase
The analysis provided the team with insight on ways to improve the patient admission process, beginning with implementing an effective process to eliminate recurring questions. The total time to complete the admission process is estimated to take three hours. Figure 25-9 shows how the recurring questions could streamline the time, reducing it by 60 minutes or 33%.
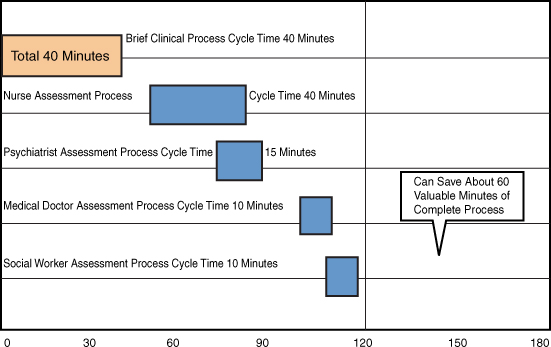
Figure 25-9. The Behavioral Health Center recommended process flow
Improvement is possible through the trials of hardware and software tools currently on the market. For example, Hosp-Cad is a tool used in hospitals that works much like the clipboards used by nurses to write down notes while interviewing patients. The clipboard is a digital device capable of scanning multiple forms while allowing the nurse or doctor to write notes as if it were paper. The Hosp-Cad alleviates the concern for maintaining eye contact with the patient and would be no different than writing on a piece of paper. The staff could then upload the information in digital format straight to the computer. This would eliminate the written brief clinical and the doctor’s paper trail while storing the information in digital form. Hosp-Cad along with Script 1.1, software designed to convert handwriting to digital writing, would allow the information technology department to write software that would interact and input the data into the software.
The current practice for dictation is for the doctor to record his conversation with the patient. At a later time, a hospital staff member dictates the conversation to paper form. A possible solution would be to purchase software called Dragon, a voice-to-digital converter that will eliminate the tedious task of a staff member listening to a monologue and typing it into the system. The software allows the user to speak to the patient while wearing a headset. The headset is connected to a computer input and converts verbal information into digital format.
The cost to implement such tools would be insignificant in comparison to the benefits of implementing the hardware/software. Table 25-2 provides an approximation of the cost to implement the information technology tools. Another system available that performs similar functions is the Tablet PC; although the device is a high-cost product, the benefits would outweigh its short-term cost.
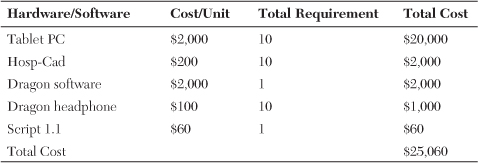
Table 25-2. Costing Table for Recommended Solutions
Upon implementation of the improvements previously mentioned, the team was able to construct an improved process flow (see Figure 25-10) that eliminated the manual brief clinical form. Now a paperless process not only saves the company resources, including the use of and finance for paper, but also eliminates the process of physically having to image the file to the database. Through the elimination of redundant questions, each process was also improved by more than 50%.
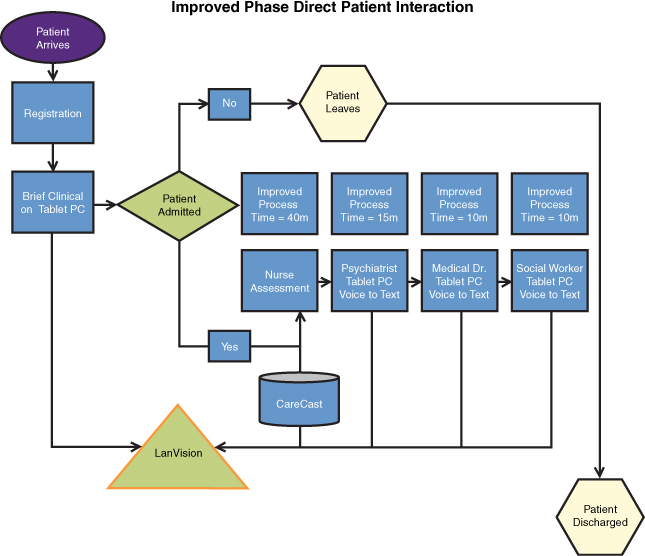
Figure 25-10. Improved process map
A confidence interval was created to determine the effect of the redundant questions in comparison to the amount of time that could be reduced. The team concluded with a certainty of 95% that questions greater than 370 seconds create 80% of the time wasted for all processes. The summary chart for total time (see Figure 25-11) clearly shows the 95% confident intervals for improvements.

Figure 25-11. Summary chart for total time
Figure 25-12 visibly depicts the comparison of the current time for a patient to complete the process and the improvement of the time reduced by 30%. With the implementation of this improvement, Behavioral Health will eliminate non-value-added, which will result in an increase in the number of patients who are admitted daily and increase patient revenue by more than 20%.
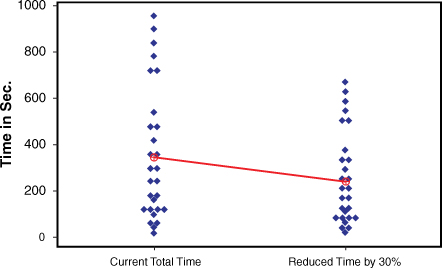
Figure 25-12. Individual value plot of comparison between current and improved time
Through the reduction process, the team expects to increase patient load by 2% per day, which would increase company revenue by $2,640,000 per year, as seen in Table 25-3.

Control Phase
The team concluded that the nurse assessment process was the most time-consuming process. The results were based on the length and breadth of the questions extending throughout the process, whether psychological, physical, family based, background check, or treatment based. After a conversation with one of hospital’s nursing staff, it was discovered that most of the information is already in the system or on paper; however, the nurses don’t have access to the information. This causes the nurse to ask identical questions to the patient throughout all stages.
One of the most critical areas needing correction is the head-to-toe physical examination. The nursing staff reported that almost one-third of their patients come from the Main Hospital Unit. The Main Hospital Unit collects patient information during their head-to-toe examination and stores the data in the center’s database. When the patient arrives in the Behavioral Center, he is taken through the same head-to-toe examination. This particular process can take 10 to 20 minutes. Future research must center on the potential for eradicating this duplication through information-sharing technology between the two treatment units. Information sharing could save both facilities time, money, and resources, as well as increase customer satisfaction.